Majority of Metro-Detroit’s Communities that Flipped Republican have Middle Class Incomes

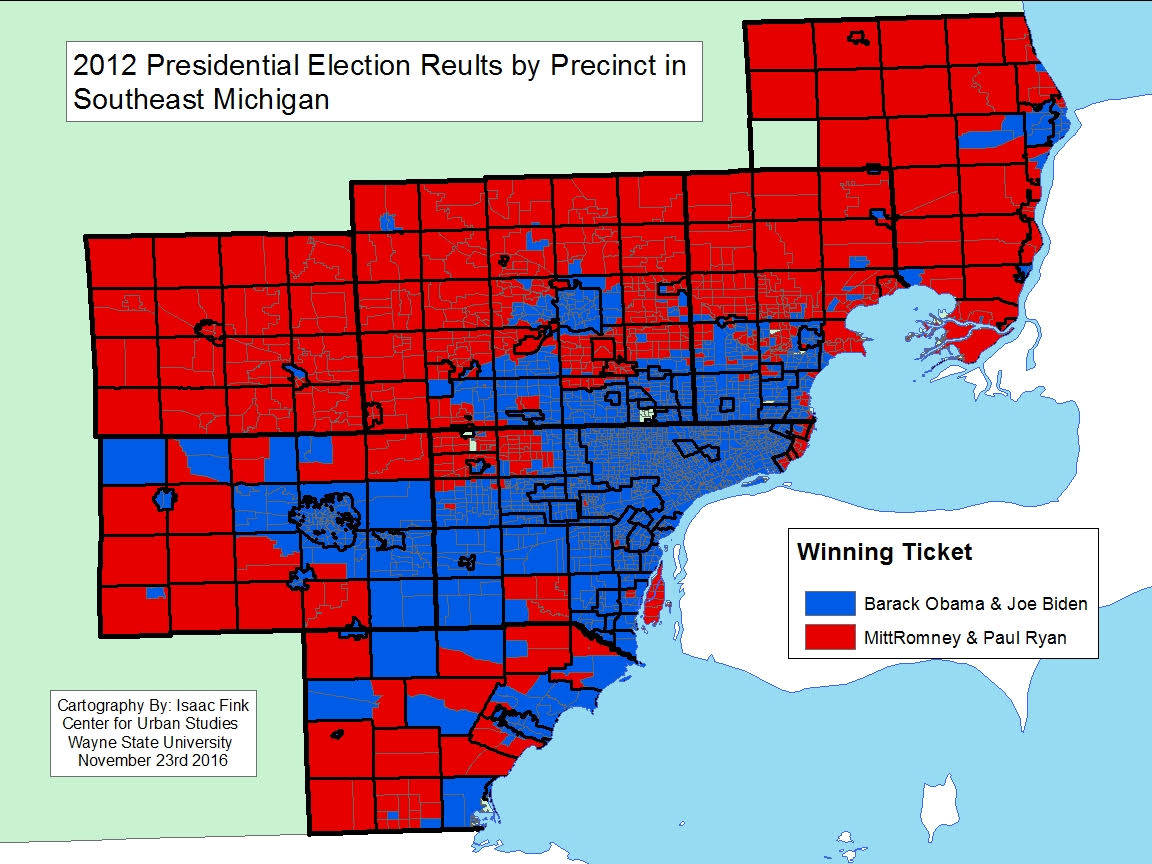
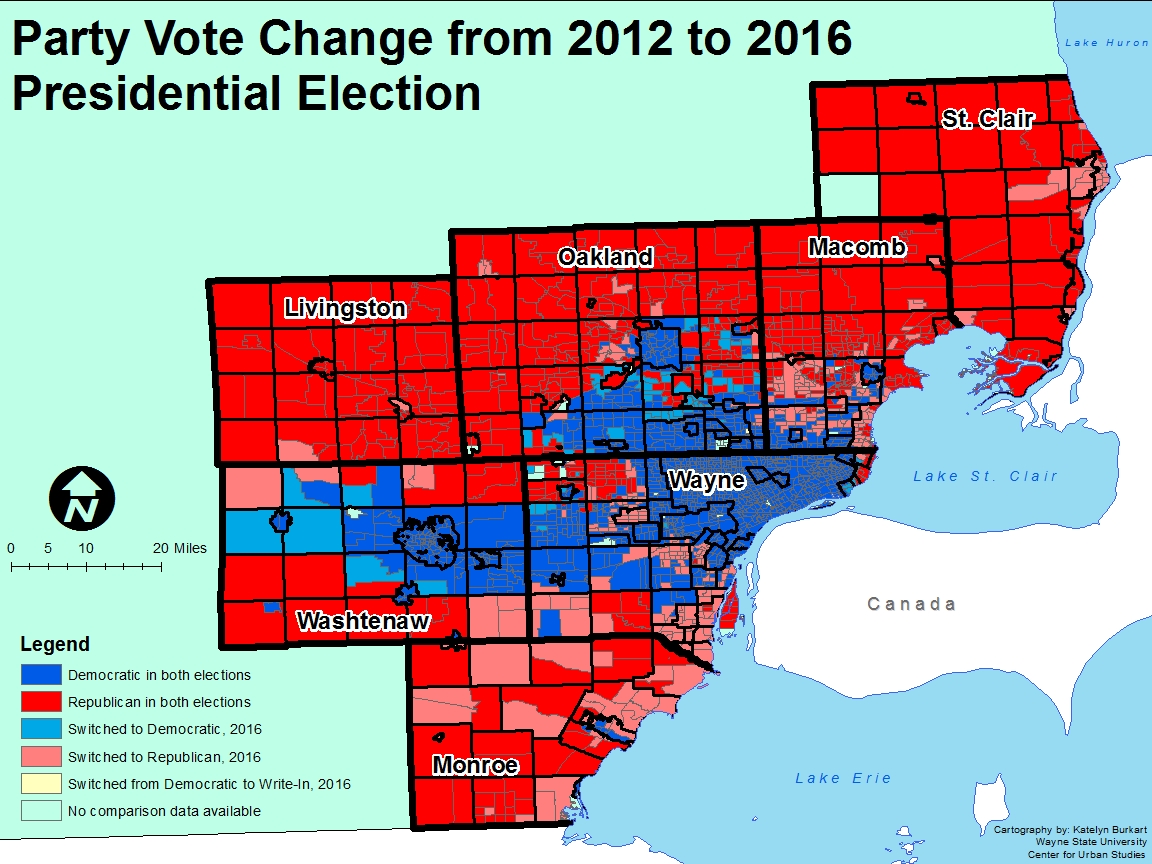
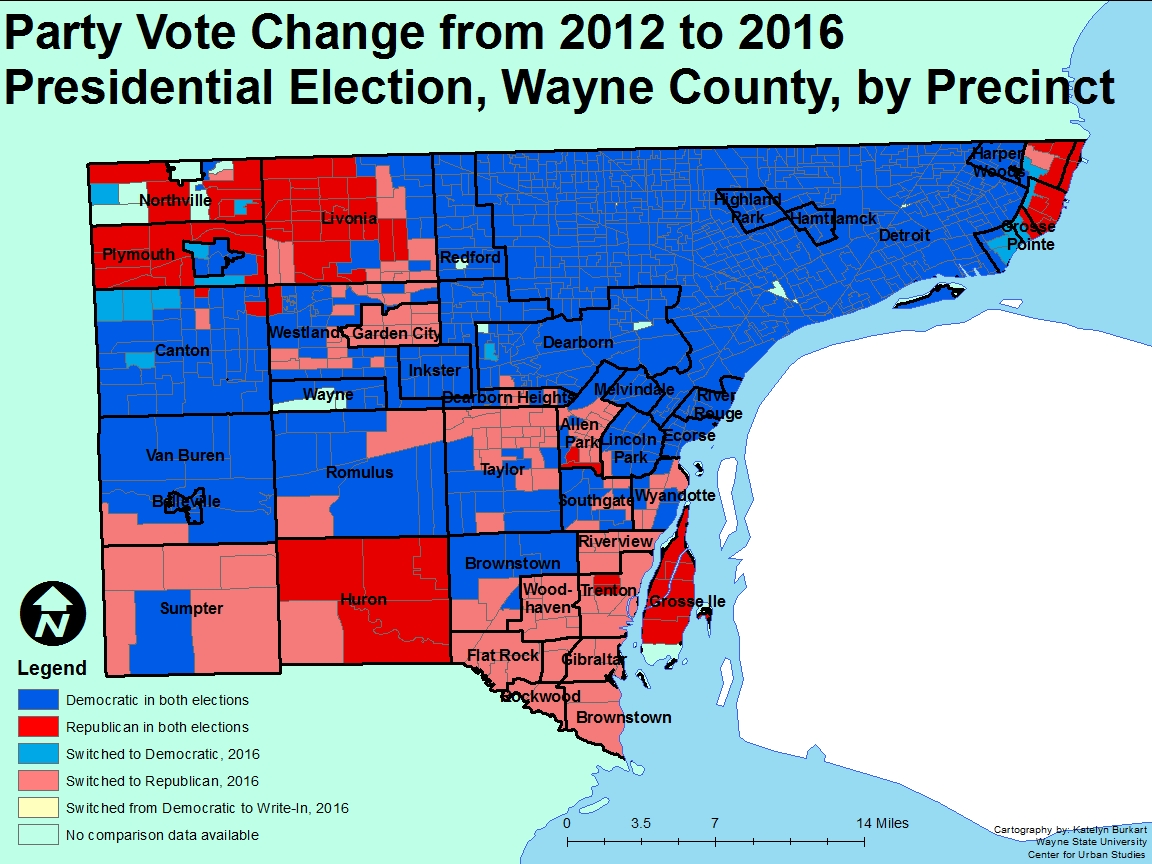
In our last post regarding the 2016 Presidential election we highlighted what areas in Southeastern Michigan flipped from Democratic to Republican, or Republican to Democratic. The most notable switch occurred in Macomb County where, much of the southern portion of the County went from voting Democratic in 2012 to Republican in 2016. This switch was also noticeably evident in the Downriver area of Wayne County.

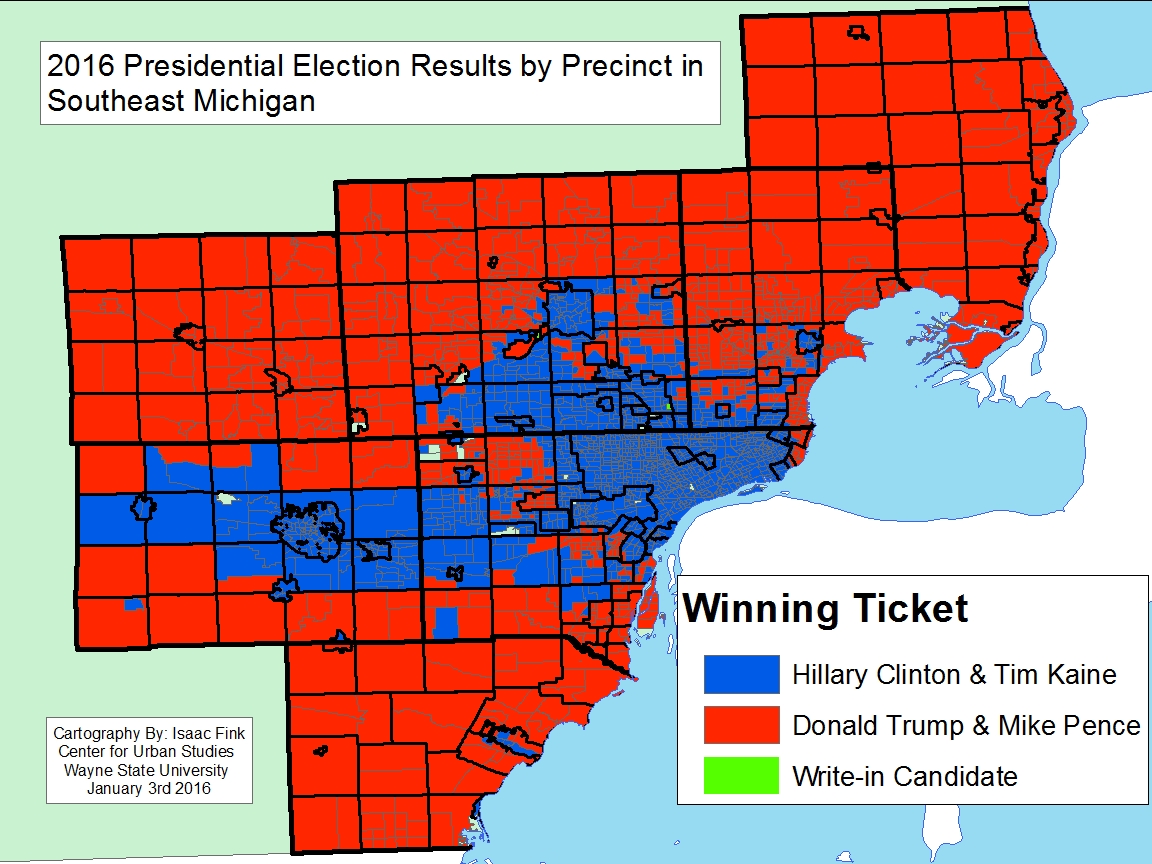
In the 2016, Detroit and its inner-ring suburbs (Ferndale, Royal Oak, parts of Warren, etc.), along with Ann Arbor and its surrounding cities to the east and west, had Democratic Candidate Hillary Clinton as the winning candidate. However, a large share of the region went to now President Donald Trump, including all of Livingston and St. Clair counties and majority of Macomb and nearly all of Monroe counties.

To shine additional light on the 2016 Presidential election, we will now be looking at the socioeconomic characteristics of the region, alongside which Presidential candidate won where. For this post, we will be discussing median income, particularly of the areas that flipped between the 2012 and 2016 elections.

When examining the region overall, the map below shows that majority of the areas in Southeastern Michigan that flipped from Democratic to Republican have a mid-range ($45,000-$70,000) median income. As we get further into the details of the region, we see this to be a defining factor for this group of precincts. Of the areas that have remained Republican, median incomes range from between $45,000 and to over $100,000. Of the areas that remained Democratic the median incomes range from about $17,000 to $100,000.

Slide03

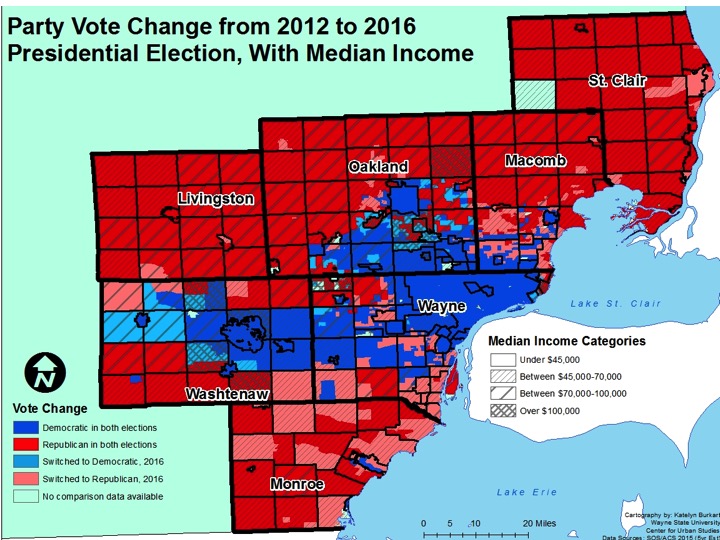
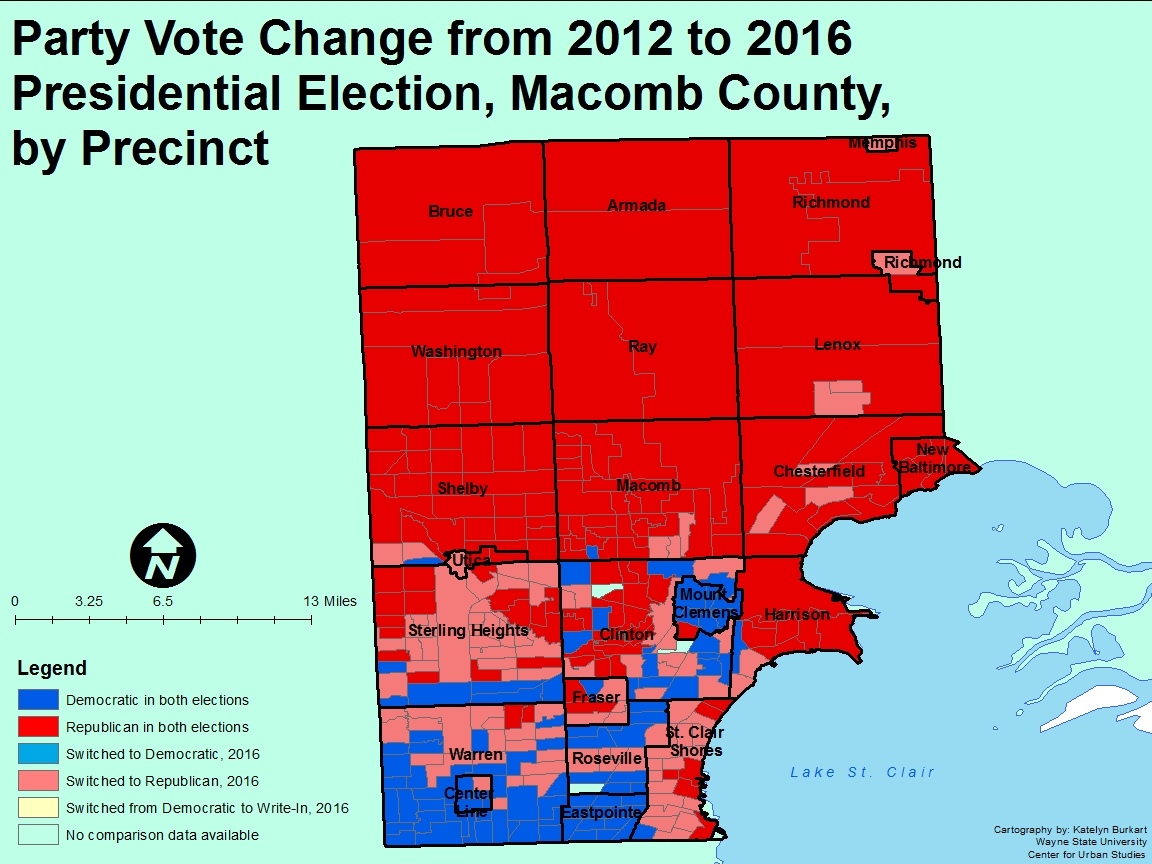
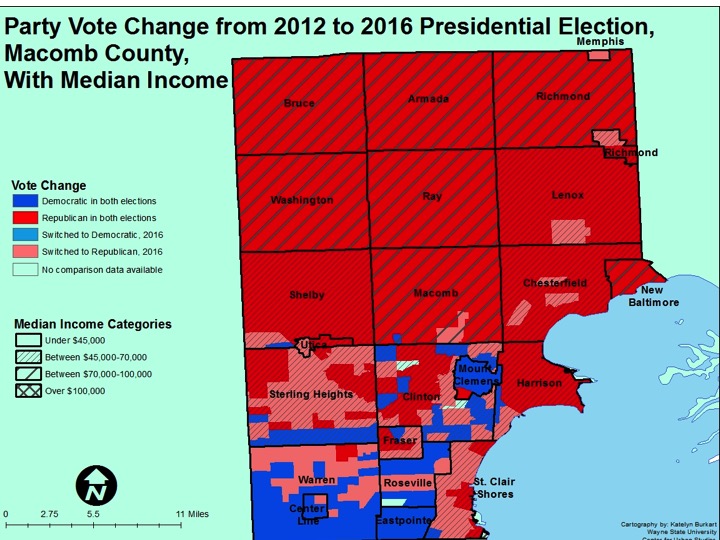
A deeper look at Macomb County shows that majority of the areas that switched from voting Democratic in 2012 to Republican in 2016 have a median income between $45,000 and $70,000. This is true for St. Clair Shores, Sterling Heights and parts of Chesterfield, Lenox, Harrison and Clinton townships, all of which had at least one precinct flip. In the northern part of Macomb County, which voted Republican in 2012 and 2016, the median income is above $70,000.

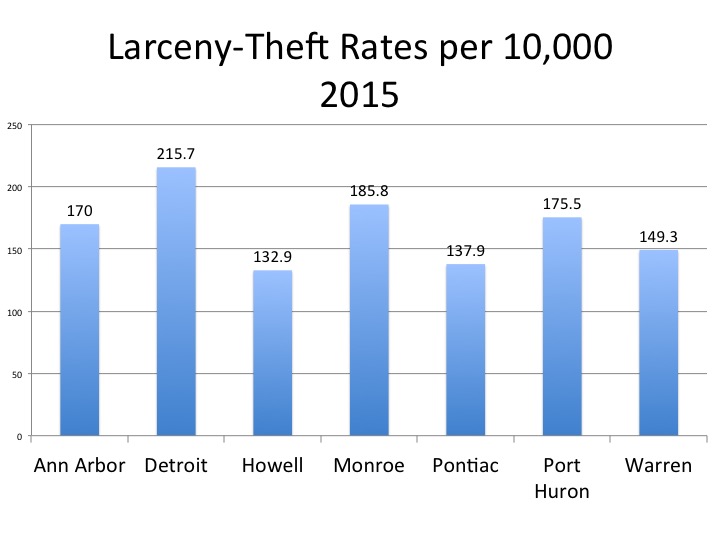
While portions of Warren also flipped from Democratic to Republican, it is categorized as having a median income below $45,000. But, as noted earlier, the city’s median income is $44,000.

Slide05

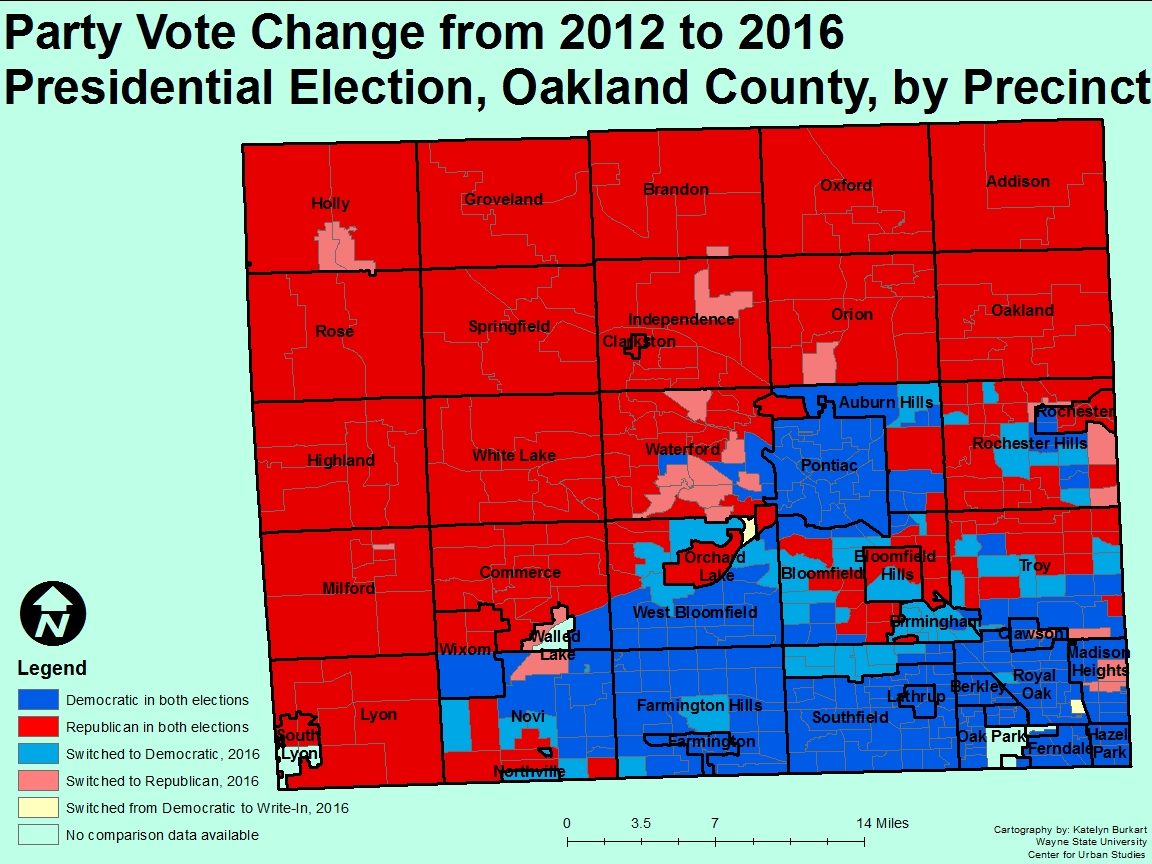
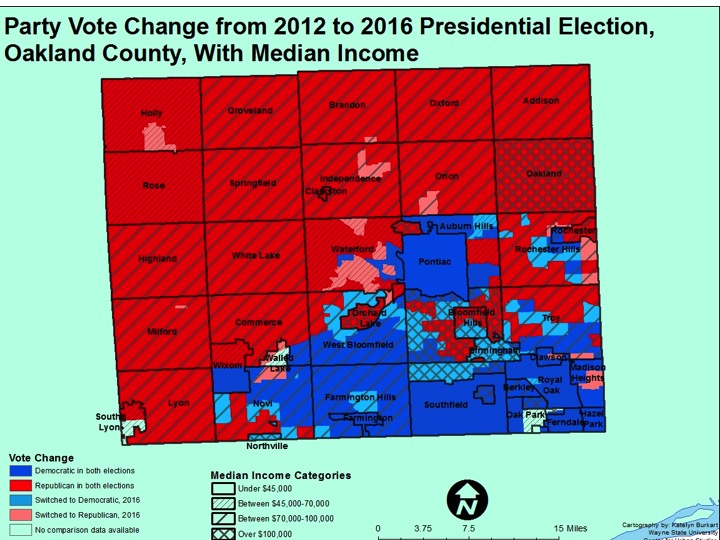
In Oakland County, there were some high income areas-Bloomfield Township, Bloomfield Hills and Birmingham-that flipped to Democratic. However, we see that majority of the County went Republican in 2012 and 2016, and majority of these communities have median incomes above $70,000. The communities in the southeastern portion of Oakland County (Ferndale, Royal Oak, Oak Park) have remained Democratic communities for both elections and their median incomes top out at $70,000. Pleasant Ridge and Huntington Woods are two higher income (above $70,000) communities in that portion of the County that have traditionally gone Democratic.

Slide07

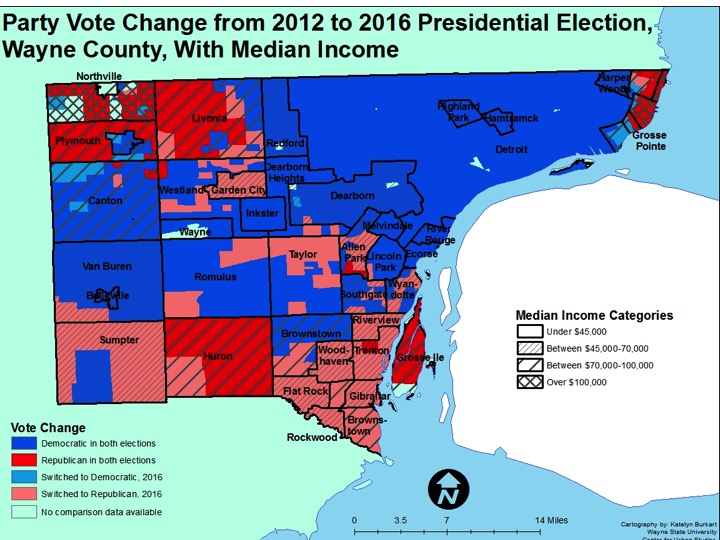
As noted earlier, it was the Downriver portion of Wayne County that flipped from Democratic to Republican for the 2016 election. In this portion of the County (Trenton, Woodhaven, Riverview, Flatrock, Gibraltar, Rockwood, etc.) 10 of the communities have a median income between $45,000 and $70,000. Parts of Taylor (median income below $45,000) and Brownstown (median income between $70,000 and $100,000) also switched.

Throughout Wayne County, median incomes vary greatly, with communities located on the County’s north eastside (Detroit, Hamtramck, Highland Park and Ecorse, etc.) having a median incomes below $45,000 and communities on the northwest side (Northville, Canton, Livonia) having median incomes above $70,000. Communities with median incomes between the two extremes are also scattered throughout the county. In Wayne County, of the 14 communities with median incomes above $70,000, 10 had a large Republican turnout. Of that 10, four showed precincts that flipped from Democratic to Republican, while the rest remained Republican between 2012 and 2016.

Slide09

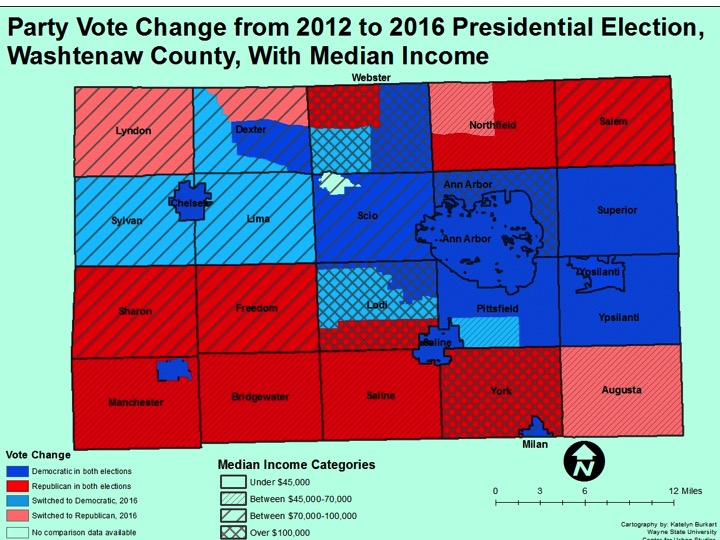
In Washtenaw County, there are no communities that have a median income less than $45,000. Of the four that had precincts flip from Democratic to Republican between the two elections, the median incomes range between $67,000 (Northfield) and $94,000 (Dexter).

Of the communities that with precincts that flipped from Republican to Democratic, five had median incomes above $70,000 and one had a median income at $69,000.

Slide11

By examining the election data alongside median income data, we are able to determine there were 32 communities with median incomes between $45,000 and $70,000 with at least one precinct that flipped from Democratic to Republican between the 2012 and 2016 elections. When the opposite occurred-an area flipped from Republican to Democratic-the median income of that area was above $70,000.

Next week we will look at the election outcomes while also looking at the racial makeup of Southeastern Michigan’s communities.

Washtenaw County’s Unemployment Rate Lowest in Region

  • The unemployment rate across the state remained stagnant while the rate in the city of Detroit decreased (monthly);
  • Regionally, Washtenaw County had the lowest unemployment rate;
  • The number of employed Detroit residents dipped, but increased on an annual basis, (monthly);
  • The Purchasing Manager’s Index for Southeastern Michigan remains strong, and is expected to grow in 2017(monthly);
  • The Commodity Price Index remained at 50 (monthly);
  • The Standard and Poor’s Case-Shiller Home Price Index for the Detroit Metropolitan Statistical Area shows home prices continue to increase monthly and annually.

Slide03

According to the most recent data provided by the Michigan Department of Technology, Management and Budget, the unemployment rate for the State of Michigan slightly increased to 5 in December of 2016 from 4.9 the previous month. Unemployment in the City of Detroit decreased though, from to 11.3 in October to 10.4 in November (December data was not yet available). The November unemployment rate for Detroit in 2016 was 0.2 points lower than it was in November of 2015.

Slide05

The chart above displays the unemployment rates for each of the seven counties in Southeastern Michigan for November of 2016. Wayne County had the highest rate at 6.1 while Washtenaw County had the lowest at 3. Not only did Washtenaw County have the lowest rate in the region, but it also had the lowest rate in the state (Ottawa County in Michigan also had a 3 point unemployment rate). Second to Wayne County, in the region, came St. Clair County with an unemployment rate of 5.5

Slide07

In November of 2016 the number of employed Detroit residents decrease to 219,867, a small drop from the 220,033 employment number in October. Between November of 2016 and November of 2015 there was a total increase of 7,759 employed Detroit residents, according to the Michigan Department of Technology, Management and Budget.

Between October and November the labor force in Detroit decreased by about 2,700. In October the labor force was reported to be 248,042 and in November it was reported to be 245,328.

Slide09

The Purchasing Manger’s Index (PMI) is a composite index derived from five indicators of economic activity: new orders, production, employment, supplier deliveries, and inventories. A PMI above 50 indicates the economy is expanding.

According to the most recent data released on Southeast Michigan’s Manager’s Index, the PMI for December 2016 was 61.9, an increase of 4.8 points from the prior month. The December 2016 PMI was an increase of 6.1 from the previous year. The PMI is considered to be strong, and expected to continue to grow into 2017, according to the Southeast Michigan’s Manager’s Index. This growth is expected, in part, because of an increased production index and growth in the labor market.

Slide11

The December 2016 Commodity Price Index remained unchanged at 50 points between November and December. However, it increased 2.8 points from December of 2015. The three month average for the Commodity Price Index was 49.

Slide13


Where Did the RTA Fail in Southeastern Michigan?

In November 2016 the concept of regional transportation in Southeastern Michigan lost again. On the Nov. 8 ballot was a question asking residents of Macomb, Oakland Wayne (including Detroit) and Washtenaw counties if they would fund a 1.2 mill tax (about $120 a year for a homes with a taxable value of $100,000) for 20 years.

If passed, the millage would have created main transportation routes along Woodward, Gratiot and Michigan avenues (some of which would have eventually used Bus Rapid Transit), along with connector lines going east to west throughout Wayne, Oakland, Macomb and Washtenaw counties. However, only Wayne and Washtenaw counties supported the millage overall. In Oakland County the millage fell short of approval by 1,109 votes (50.1 percent of voters voted against it) and in Macomb County the measure failed with 60 percent of voters voting against it.

Slide2

Currently in Southeastern Michigan, public transportation is fragmented, at best. Parts of Wayne, Oakland and Macomb counties are serviced by the Suburban Mobility Authority of Regional Transit (SMART), a transportation system that was created in 1967. However, in Oakland and Wayne counties communities can opt-out of the system, meaning they do not need to support its funding or have routes accessible in their community. Macomb County, through legislation passed by the County Board of Commissioners, is an entirely opt-in community. This means either the majority of the county supports SMART funding when it goes up for renewal and/or increases or it doesn’t; the county as a whole has historically supported SMART.

RTA Vote - Municipality Level - SMART Communities_Borders&Labels_JPEG

Despite Macomb County being completely opt-in for SMART, only one municipality supported the RTA millage in November; it was Mount Clemens-the county seat. According to the Macomb County Clerk’s Department 55 percent of voters in Mount Clemens supported the millage and 45 percent voted against it.

In Oakland County, 23 of the 51 municipalities in the region supported the RTA millage, with the inner-ring suburbs like Ferndale (72% yes), Pleasant Ridge (74% yes) and Huntington Woods (76% percent yes) showing the highest support. Unlike Macomb County, Oakland County is not an entirely “opt-in” community for SMART, meaning individual municipalities decide whether they want to fund/participate in the region’s current form of public transportation. Ferndale, Pleasant Ridge and Huntington Woods all opt-into SMART, as do some of the Oakland County communities that were just above 50 percent of voters supporting the RTA millage; these communities include Bloomfield Township and Birmingham. Troy and Bloomfield Hills are two communities in Oakland County though that participate in SMART but did not approve the RTA millage.

In Wayne County, where there are SMART routes and where the Detroit Department of Transportation (DDOT) operates, communities like Detroit, Hamtramck, Highland Park, Dearborn and Redford Township (which all participate in SMART) voted to approve the RTA millage. However, communities on the western side of the county and a majority of the downriver communities (despite some participating in SMART-like Trenton) did not approve of the transportation millage. Overall, 53 percent of Wayne County voters voted to approve the RTA millage.

Washtenaw County does not participate in SMART (the transit system is limited to Macomb, Oakland and Wayne counties) but it does have the Ann Arbor Transit Authority (AATA). Of those who voted on this measure, 53 percent supported the millage in the county. Overall, eight of the 27 communities in the county supported the millage. However, those with the highest populations (Ann Arbor and Ypsilanti) showed high support for the regional transportation tax.

Despite not having a long-term funding mechanism, the RTA currently operates RefleX, which is a supplemental ride system along Woodward and Gratiot avenues; these services did not eliminate any SMART or DDOT stops/lines. However, the RTA is only funded by the State through Sept. 30, 2017. After that though, its future is uncertain. With the regional transportation millage failing, the RTA is left without a solid funding source and cannot go to the voters with another tax proposal until 2018. According to Public Act 387 of 2012 (which created the RTA), the RTA can receive money through voter approved millage funding and/or an additional fee that may accompany state driver registration fees. Ballot initiatives can only be placed on ballots during presidential or gubernatorial elections.

Members of the RTA Board of Directors or Executive Staff have not publicly stated their future plans or ideas for funding mechanisms. While funding mechanisms would need to be identified, negotiating interlocal agreements between communities that want transit might be an incremental means of supplementing the fragmented systems currently in place. For example, there are no direct public transportation routes between Ann Arbor and Detroit[1] even though Ann Arbor, Detroit and DTW are the most desired routes, according to surveys. Both Wayne and Washtenaw Counties voted for the RTA, so it seems feasible that enterprising public officials in those two counties could negotiate an agreement to move forward on creating services, knowing both that their residents voted for services and that they want those routes.

[1] It might be possible for an ambitious soul to take a bus from Ann Arbor to the Detroit Metropolitan Airport (DTW) and then shift to a SMART bus and transfer to a DDOT bus into Detroit.
[1] It might be possible for an ambitious soul to take a bus from Ann Arbor to the Detroit Metropolitan Airport (DTW) and then shift to a SMART bus and transfer to a DDOT bus into Detroit.

Change Evident in Southeastern Michigan for Presidential Election

On Nov. 8, 2016 election results showed that then Republican nominee Donald Trump was elected to serve as the nation’s 45th President; Michigan was one of the states that went red for President-Elect Trump. In 2012 though President Barack Obama, the then Democratic candidate up for re-election, won Michigan, helping assure his second term in the White House. To show exactly what locations swung from Democratic to Republican or Republican to Democratic in the 2016 Presidential Election, voting results by precinct were taken from the Michigan Secretary of State and the County Elections offices and mapped. Even just a glance at the maps shows where significant change occurred-Macomb and Monroe Counties-but our deeper look at the precincts also shows precisely where change occurred throughout Oakland, Washtenaw and Wayne counties. In many cases, the change shown is of an area where residents voted Democratic in 2012 and Republican in 2016, but there were instances of the opposite as well.

november-8th-2016-presidential-election-reusts-by-precinct-in-southeast-michigan_01032017_jpeg

2012-election

In the 2016 map we see that Detroit and its inner-ring suburbs (Ferndale, Royal Oak, parts of Warren, etc.), along with Ann Arbor and its surrounding cities to the east and west, had Democratic Candidate Hillary Clinton as the winning candidate. There was also a pocket in the City of Monroe that went to Clinton. However, a large share of the region went to President-Elect Donald Trump, including all of Livingston and St. Clair counties and majority of Macomb and nearly all of Monroe counties.

semcogchangemap

The two counties in the region that had the largest number of precincts switching from Democratic to Republican from the 2012 to 2016 election were Macomb and Monroe counties. In 2016 53.6 percent of the votes went to the Republican nominee (President-Elect Trump) in Macomb County while in 2012 47.5 percent of the vote went to then Republican nominee Mitt Romney, according to the election results. In Monroe County in 2016 58.4 percent of the votes went to the Republican nominee (President-Elect Trump) in Monroe County and in 2012 that number was 48.9 percent for the Republican nominee, according to the election results.

When drilling down into Macomb County we see that the central portion of Sterling Heights, the northern portion of Warren, majority of St. Clair Shores and pockets of precincts in Lenox, Chesterfield, Clinton, Harrison, Richmond and Shelby townships and in the cities of Fraser, Utica and Roseville flipped from Democratic to Republican precincts between the 2012 and 2016 elections. There was not one precinct in Macomb County that switched from Republican to Democrat between the 2012 and 2016 elections, according to county election results.

macombmap

In Monroe County we see that the city of Monroe and Dundee, London, Erie, Exeter, Berlin and Rainsville townships switched from Democratic in 2012 to Republican in 2016. Similar to Macomb, there were no precincts in Monroe County that had the reverse switch, going from Republican in 2012 to Democratic in 2016.

While overall, Wayne County remained Democratic in the 2016 election, a drill down on the municipalities and precincts shows that nearly all of the Downriver region
(Trenton, Woodhaven, Flat Rock, Gibraltar, Rockwood, Brownstown, Riverview and portions of Wyandotte, Southgate, Taylor and Allen Park) switched from voting Democratic in the 2012 election to going for the Republican Presidential nominee in 2016. Additionally, all of Garden City made that switch, as did portions of Huron, Sumpter and Van Buren townships, along with areas in Westland, Romulus and Livonia. Overall in Wayne County in 2016, 66 percent of the vote went to Democratic nominee Clinton and 29 percent went to Trump, according to the official Wayne County election results. In 2012 though 73 percent of the vote went to the Democratic nominee (Obama) while 26 percent went to the Republican nominee (Romney), according to election results.

waynemap

Washtenaw County, unlike Macomb and Monroe, had several precincts in 2016 that switched from being Republican in 2012 to being Democratic in 2016. All precincts in Lima and Sylvan townships switched from Republican in 2012 to Democratic in 2016, and about half of the precincts in Dexter and Lodi townships did the same. Augusta and Lyndon townships did the opposite, switching from Democratic to Republican between the two elections.

In Oakland County, overall, 44 percent of the voters voted for the Republican nominee (Trump) and 52 percent voted for the Democratic nominee (Clinton) in 2016, according to county elections results. In 2012 though there was a higher percentage of votes cast for both the Republican and Democratic nominees. In 2012 the Republican nominee (Romney) received 45 percent of the vote and the Democratic nominee (Obama) received 54 percent of the vote, according to county election results. In 2016, there were pockets of precincts-primarily in the Bloomfield-Birmingham area-that switched from Republican to Democratic. Birmingham though was the only municipality that switched nearly in its entirety. There were also about a dozen precincts that made the opposite switch (from Democratic to Republican) between the two most recent Presidential elections; those switches primarily occurred in the municipalities that have remained Republican in both elections.

oaklandmap

With the evident change between the 2012 and 2016 Presidential elections in Southeastern Michigan, we will embark on a detailed series showing not only where the change occurred, as we did in this post, but also how it relates to socioeconomic data, voter turnout and third party votes. Stay tuned for another post related to the 2016 election in the coming weeks.

Detroit Tops List of Regional Crime Rates

The Federal Bureau of Investigation recently released data on known criminal offenses for the year 2015. For this post, these criminal offenses have been turned into rates per 10,000 residents to accurately show how reported crimes differ between the some of the most well known cities in each county in Southeastern Michigan.

The cities featured in this post are

  • Ann Arbor: Washtenaw County
  • Detroit: Wayne County
  • Howell: Livingston County
  • Monroe: Monroe County
  • Pontiac: Oakland County
  • Port Huron: St. Clair County
  • Warren: Macomb County

Of the nine crimes featured, Detroit had the highest rate of the seven featured cities for all but one. Conversely, of the nine featured crimes, Howell had the lowest rates for six of them.

Overall, property crimes had the overall highest rates of the crimes discussed in this post while murder and nonnegligent manslaughter had the lowest. Property crime rates also had the largest difference between the city with the highest rate (Detroit) and the city with the lowest rate (Howell).

slide03

According to the FBI, Detroit had the highest murder rate in 2015 of the seven cities examined in this post. This rate was calculated to be 4.4 per 10,000 residents; this was equivalent to 295 murders for a population of about 673,000. Howell, Monroe and Ann Arbor had zero reported murders while Port Huron had a rate of .7 and Pontiac and Warren had rates of .1

slide05

According to the FBI forcible rape is defined as “the carnal knowledge of a female forcibly and against her will.  Attempts or assaults to commit rape by force or threat of force are also included; however, statutory rape (without force) and other sex offenses are excluded.”

In 2015, of the cities highlighted in this post, Pontiac had the highest reported rape rate per 10,000 residents at 11.5; this was equivalent 69 reported rapes to law enforcement for a population of about 60,000. Ann Arbor had the lowest rate at 4.9, which was equivalent to 58 total rapes known to law enforcement. Detroit’s forcible rape rate per 10,000 residents was 7.8 in 2015, or 530 total rapes known to law enforcement.

slide07

According to the FBI robbery is defined as “the taking or attempting to take anything of value from the care, custody, or control of a person or persons by force or threat of force or violence and/or by putting the victim in fear.”

Of the featured cities, Detroit had the highest robbery rate per 10,000 at 51 and Ann Arbor had the second highest at 35. In total, Detroit had 3,457 reported robberies while Ann Arbor had 42. Howell had the lowest rate at 2 with two reported robberies.

slide09

According to the FBI, aggravated assault is defined as “an unlawful attack by one person upon another for the purpose of inflicting severe or aggravated bodily injury.”

In 2015 Detroit had the highest aggravated assault rate of the cities featured in this post. Detroit’s 2015 rate was about 112.5 per 10,000 residents, and Pontiac had the second highest rate at 90.5. Ann Arbor had the lowest aggravated assault rate of the seven cities featured at 10.8.

slide11

According to the FBI, property crime “includes the offenses of burglary, larceny-theft, motor vehicle theft, and arson.  The object of the theft-type offenses is the taking of money or property, but there is no force or threat of force against the victims.”

Detroit had the highest property crime rate of the seven cities featured at 409 per 10,000 residents. The city with the second highest property crime rate was Pontiac at 258 per 10,000. Howell had the lowest rate of the featured cities at 152.7. There was a 257 point difference between Howell and Detroit, making this the largest rate difference of the featured cities.

slide13

According to the FBI burglary is defined as, “the unlawful entry of a structure to commit a felony or theft.  To classify an offense as a burglary, the use of force to gain entry need not have occurred.”

Similar to the property crime rate standings, Detroit and Pontiac had the highest rates of the featured cities. Detroit’s property crime rate per 10,000 residents in 2015 was 116 while Pontiac’s was 93. Howell again had the lowest rate of the cities at 12.5 with Ann Arbor coming in just above it at 23.1.

slide15


According to the FBI, larceny theft is defined as “the unlawful taking, carrying, leading, or riding away of property from the possession or constructive possession of another.”

Detroit had the highest larceny-theft rates of the featured cities in 2015 at 215.7 and Monroe had the second highest rate at 185. Monroe’s rate was equivalent to 373 reported crimes for a population of 20,074 while Detroit’s rate was equivalent to 14,523 reported crimes for a population of about 673,000. Howell again had the lowest rate at 132.9; this was equivalent to 128 reported crimes for a population about about 9,600.

slide17

According to the FBI, motor vehicle theft is defined as “the theft or attempted theft of a motor vehicle.”

The highest motor vehicle theft rate of the featured cities was 77 per 10,000 residents for the city of Detroit. This rate was equivalent to 5,216 motor vehicle thefts for a population about 623,000. The city with the second highest motor vehicle theft rate was Warren with a rate of about 39. In 2015 Warren had 521 reported motor vehicle thefts for a population of about 135,000. Ann Arbor had the lowest motor vehicle theft rate of 6 per 10,000 residents in 2015 of the feature cities.

slide19

According to the FBI, arson is “any willful or malicious burning or attempting to burn, with or without intent to defraud, a dwelling house, public building, motor vehicle or aircraft, personal property of another, etc.”

Ann Arbor had five reported arsons in 2015, giving it the lowest rate at .5, while Detroit had 842 reported arsons for a rate of 12.5. Port Huron had the second highest rate at 5.2 with 12 reported arsons.