Southeastern Michigan Communities Working to Fund Pension Systems

In 2017 the Protecting Local Government Retirement and Benefits Act was passed, with the goal of identifying the systems that are underfunded. According to the State of Michigan, a retirement fund is underfunded if less than 60 percent of the fund is funded, and there is an annual required contribution that is over 10 percent of governmental fund revenues. While 60 percent is the current threshold, there are discussions that eventually that number will continue to increase to 100 percent to more accurately reflect the funded status of a retirement plan. There are also thresholds that determine if a local government entity has an underfunded retiree health care system, an issue we will explore next week.

Currently, in the State of Michigan local government entities are facing, in total, over $18 billion in unfunded liabilities for retirement and retiree healthcare funds, according to the Reason Foundation. This foundation worked with the State of Michigan to develop the Protecting Local Government Retirement and Benefits Act and the reporting system that goes along with it.

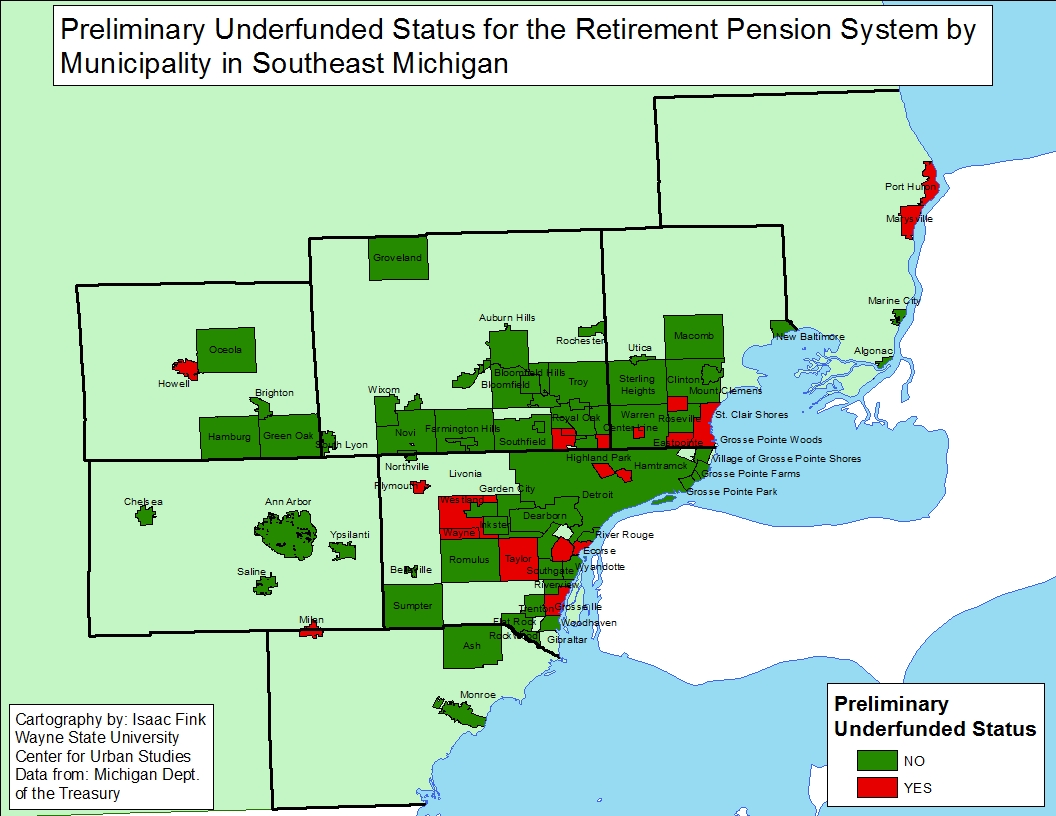
The maps below provide details on what local government retirement plans are preliminary funded or underfunded in Southeastern Michigan, as determined by the Michigan Department of Treasury through implementation of the Protecting Local Government Retirement and Benefits Act. These are deemed preliminary due to the fact the new oversight body for determining funded, unfunded and waiver status must still review information submitted. Note, information is not displayed for all local government units in the region because not all units had provided their funding as of June 9, 2018. Additionally, some local government units beyond cities and townships are included in the data provided by the State, such as public safety retirement funds.

Of the 183 local government entities (this includes multiple funds for one municipality) that submitted their retirement funding information to the State for the Southeastern Michigan region, 37 of them were reported as having an underfunded status, or less than 60 percent of the retirement fund being funded. Of those that were reported as being underfunded, the majority of them had 45 percent or more the entity’s retirement system funded. However, there were five entities with 25 percent or less of the retirement system funded. These entities were:

  • Capac (St. Clair County): 24.2%
  • Highland Park General Employee fund: 2%
  • Highland Park Public Safety Fund: 3.7%
  • Highland Park Police and Fire Fund: 6.8%
  • Taylor City Housing Commission Authority: 0%

It should be noted that while the City of Taylor’s Housing Commission Authority retirement fund is underfunded, the City of Taylor’s general employee and police and fire retirement funds met State guidelines to be determined funded.

As part of the newly adopted State legislation related to retirement and retiree health care plans a Municipal Stability Board was created to review the corrective plans that underfunded entities must create and submit to the State. This board is housed under the Michigan Department of Treasury is made up of three individuals appointed by the governor. Corrective plans must be developed and submitted within 180 days of the State determining an entity’s retirement system is underfunded.


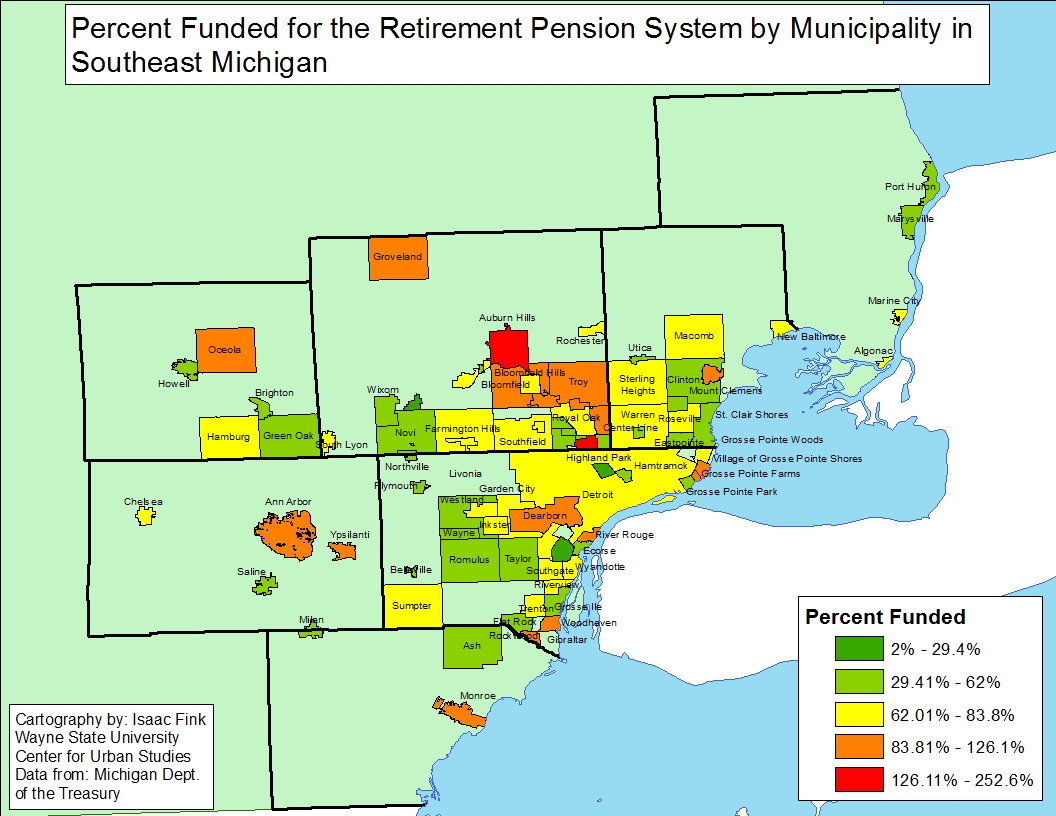
On the opposite side of the spectrum, while there were far more local government entities that were determined have funded retirement systems, than not, there were several that were more than 100 percent funded. The entities with the highest percentage of funding for their retirement funds were:

  • City of Ferndale (General Employees): 253%
  • City of Dearborn (Chapter 24): 239%
  • City of Pontiac (General Employees); 176%
  • City of Ypsilanti (General Employees) 126%
  • City of Grosse Pointe: 119%
  • City of Troy: 117%
  • Lima Township: 112%
  • City of Grosse Pointe Farms: 111%
  • City of Gibraltar (General Employees): 106%
  • City of Dearborn (General Employees): 104.3%
  • City of Mt. Clemens: 103%
  • Oakland County: 103%
  • City of Gibraltar (Public Safety): 102%
  • Groveland Township: 101%

Funding of retirement plans is vital for all local government entities as underfunded plans can lead to long-term financial troubles for a government entity, not excluding bankruptcy. Additionally, underfunded plans can also affect recruitment and retention of employees.
Unemployment Rates in Detroit,Region Take Recent Drop, Higher Than Previous Year

  • The unemployment rate decreased in Detroit and at the state level(monthly);
  • Regionally, April 2018 unemployment rates are higher than the prior year;
  • Housing prices continue to rise in Metro-Detroit.

In April of 2018 the unemployment rate for the State of Michigan was 4, a decrease from the March unemployment rate of 4.6, according to the most recent data provided by the Michigan Department of Technology, Management and Budget. The State unemployment rate for April was 0.3 point above what it was in April of 2017.

The Detroit rate was 1.3 points lower in April of 2018 than in March. In April of 2018 Detroit’s unemployment rate was reported to be 7.4, this was .3 points higher than in April of 2017.

The chart above displays the unemployment rates for each of the seven counties in Southeastern Michigan for April of 2017 and 2018. Monroe County was the only one in the seven county region to have a lower unemployment rate in 2018 than in 2017. In April of 2017 Monroe County’s unemployment rate was 3.7 and in 2018 in dropped slightly to 3.7.

In April of 2018 Wayne County had the highest unemployment rate at 4.3, St. Clair County was only slightly below at 4.2. These two counties were the only two in the region to have unemployment rates about 3.5 in April of 2018. Washtenaw County had the lowest unemployment rate in the region at 2.8. Oakland County and Livingston County were the only other two counties in the region with an unemployment rate below 3.

While Livingston County had among the lowest unemployment rate in the region in April of 2018 it also had the largest increase in its unemployment rate between April 2017 and April 2018. In April 2017 the unemployment rate for Livingston County was 2.4 and in 2018 it increased to 2.9.

The above chart shows the Standard and Poor’s Case-Shiller Home Price Index for the Detroit Metropolitan Statistical Area. The index includes the price for homes that have sold but does not include the price of new home construction, condos, or homes that have been remodeled.

According to the index, the average price of single-family dwellings sold in Metro Detroit was $120,020 in March 2018; this was $1,220 higher than the average family dwelling price in February. The March 2018 price was an increase of $16,240 from March of 2016 and an increase of $22,120 from March of 2015 and an increase of $26,240 from March of 2014.

Pedestrian Deaths Out Number Cyclist Deaths in Southeastern Michigan

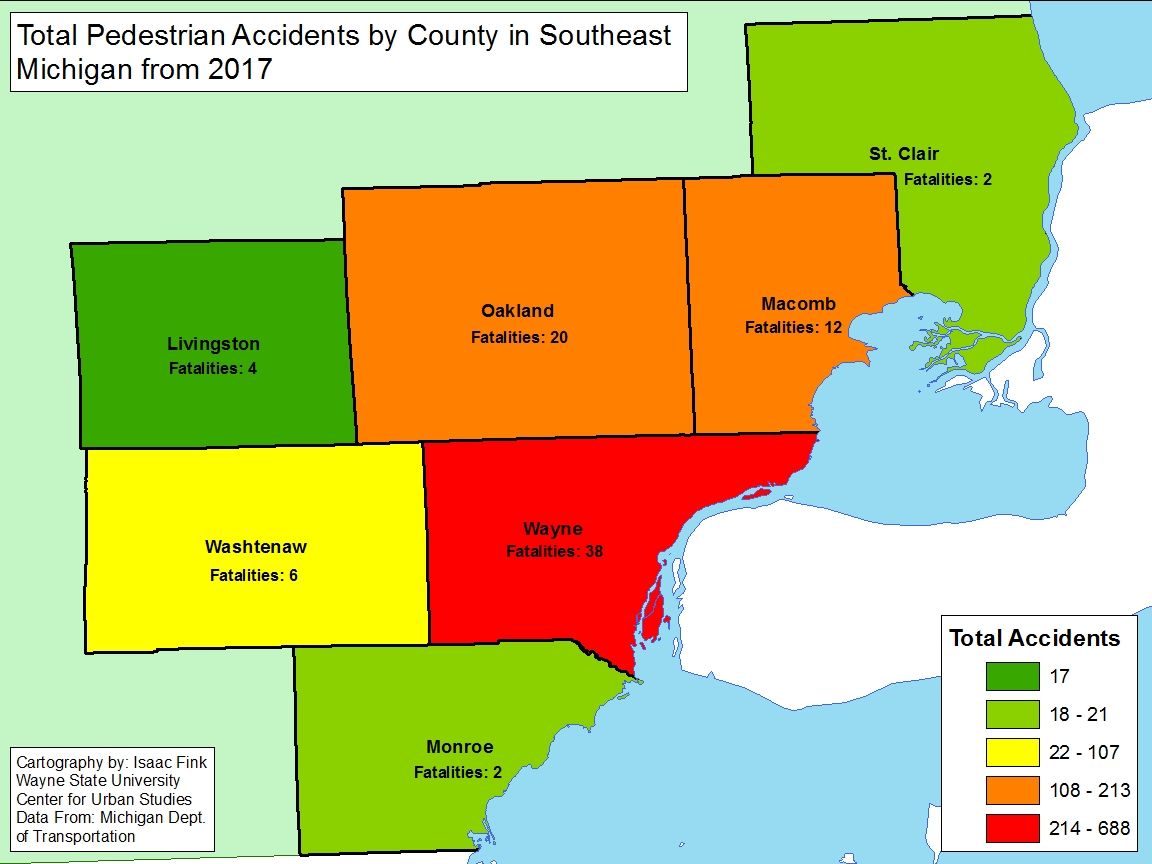
In 2017 there were more vehicle related crashes and fatalities involving pedestrians than there were ones involving bicycles in Southeastern Michigan. According to the data from the Michigan Department of Transportation, there were 1,226 crashes involving pedestrians in Southeastern Michigan in 2017 and 84 pedestrian fatalities. Regionally, Wayne County had the highest total number of pedestrian related crashes at 688. Oakland County had the second highest total number of pedestrian crashes at 213. Of the seven counties in the region, Wayne, Oakland, Washtenaw and Macomb counties all had more than 100 involved pedestrian related crashes. Livingston County had the lowest number of pedestrian crashes at 17.

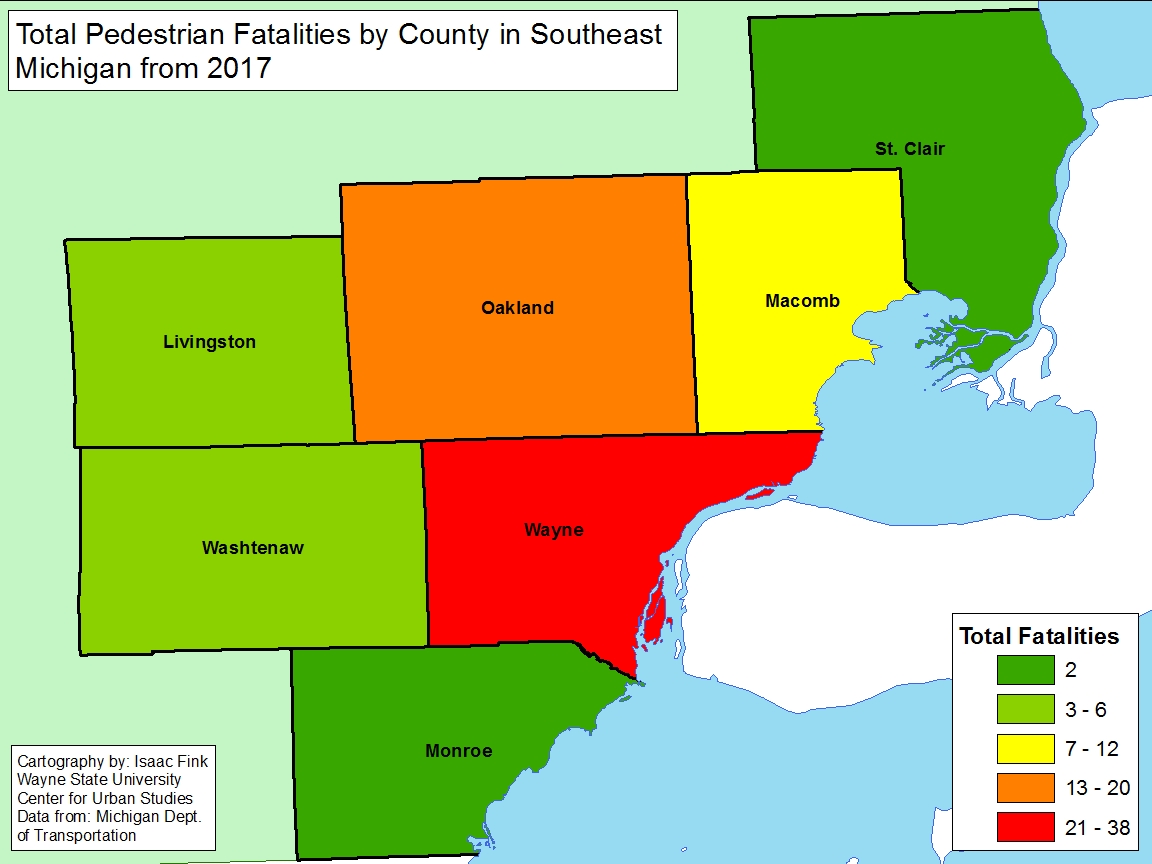
Just as Wayne County had the highest number of pedestrian crashes, it also had the highest number of pedestrian fatalities. In total, there were 38 pedestrian fatalities in Wayne County in 2017. Regionally, there were 84 pedestrian fatalities in 2017 and St. Clair County had the lowest at two. The map below shows the range of pedestrian accidents by color and presents the number of fatalities next to the county label.

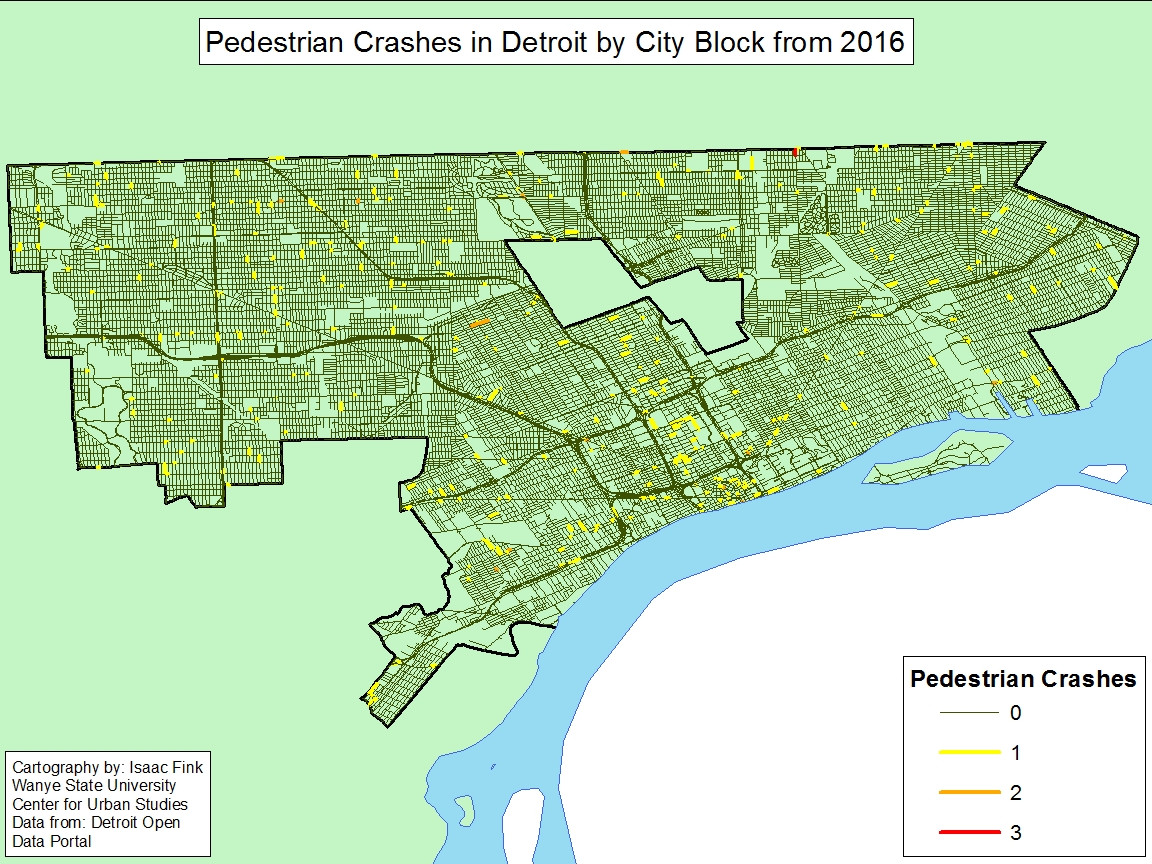
The Detroit map below shows the total number of pedestrian crashes by city block in 2016. This data was provided by the Detroit Open Data portal. The block with the highest number of pedestrian crashes is on the Eight Mile border on the more eastern side of the City. However, you will see the highest concentration of pedestrian crashes was located in the downtown up through Midtown area.

Just as Wayne County had the highest number of pedestrian crashes, it also had the highest number of pedestrian fatalities. In total, there were 38 pedestrian fatalities in Wayne County in 2017. Regionally, there were 84 pedestrian fatalities in 2017 and St. Clair County had the lowest at two.

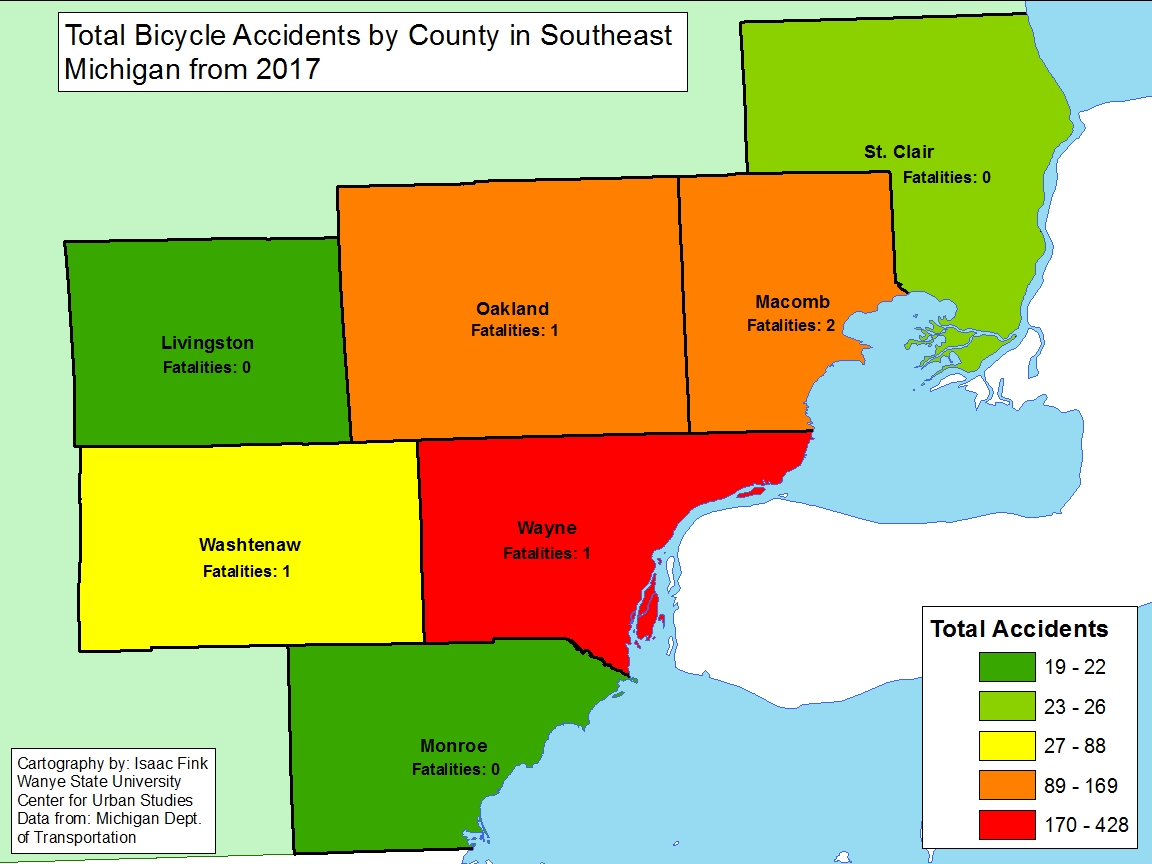
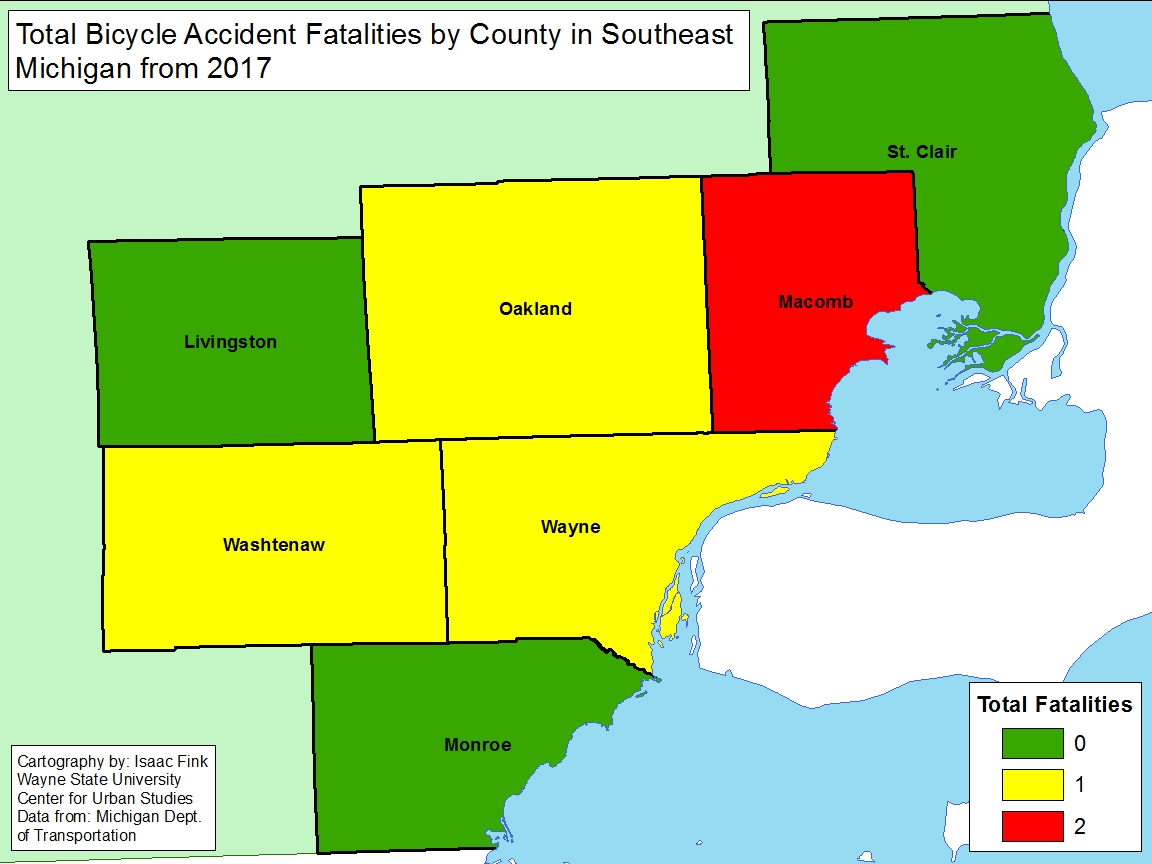
In 2017 there were 914 bicycle related crashes, with Wayne County having the highest total at 428. Wayne, Oakland and Macomb counties were the only three counties in the region with more than 100 bicycle related crashes. Livingston County had the lowest total at 19. When examining the total number of bicycle related fatalities there were five in the region, with Macomb County having the highest total at two.

While fatalities for cyclists were lower than pedestrian fatalities, in recent years there has been an increase, according to an MLive analysis of fatality numbers. While no specific reason for the increase has been identified, cyclists are encouraged to yield at appropriate intersections, wear bright clothing and utilize bike lanes when possible. Additionally, motorists are also expected to pay attention and provide appropriate distance between their vehicle and a cyclist.

Southeastern Michigan Net Out-of-State Net Migration Far Lower than County-to-County Migration

Just as our previous post showed all seven counties in the Metro-Detroit region were gaining residents from other Michigan counties, additional data shows that growth goes beyond Michigan residents. According to 2015 Census data (the most recent migration data available), all counties in the seven county region had an overall net growth of residents, with the exception of Washtenaw County. According to the data, Washtenaw County had a net migration loss of five residents; there were 523 new residents who moved to Washtenaw County from outside of Michigan and 528 Washtenaw County residents who left the state for another. According to the data, Oakland County had the largest net gain of out-of-state residents at 1,661; 3,825 out-of-state residents moved to Oakland County in 2015 and 2,164 left Oakland County for another state. The only other county that had a net gain of more than 1,000 new residents was Wayne County. In total, 6,542 out-of-state residents moved into Wayne County in 2015 and 5,154 Wayne County residents left the state, meaning there was a net growth of 1,388 residents.

In comparing migration patterns between county-to-county in Michigan (previous post) and those moving in and out of the state, the data clearly shows migration within the state is much more common. For comparison, in 2016 there were 33,148 people who moved to Wayne County from other areas in Michigan while there were 6,542 out-of-state residents moved into Wayne County in 2015. In-state migration appears to be much easier for residents, but, as this post highlights, out of state migration into the seven county region is higher than those leaving the area for outside of Michigan.