Work from Home Capabilities Continue to Drive Movement to the Metro-Detroit Suburbs

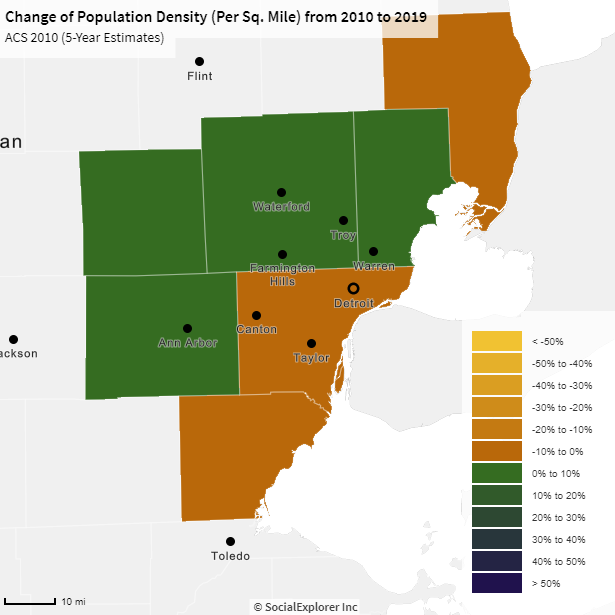
Suburbs are “in” again, according to recent research highlighted in the Wall Street Journal, after nearly a decade of increased migration to and interest in cities. However, while the pandemic has changed how many of us live, and plan to live, Census data shows that in Southeastern Michigan there has been a trend for some time of people leaving the more heavily populated areas and moving to the less dense areas, and increasing density there.

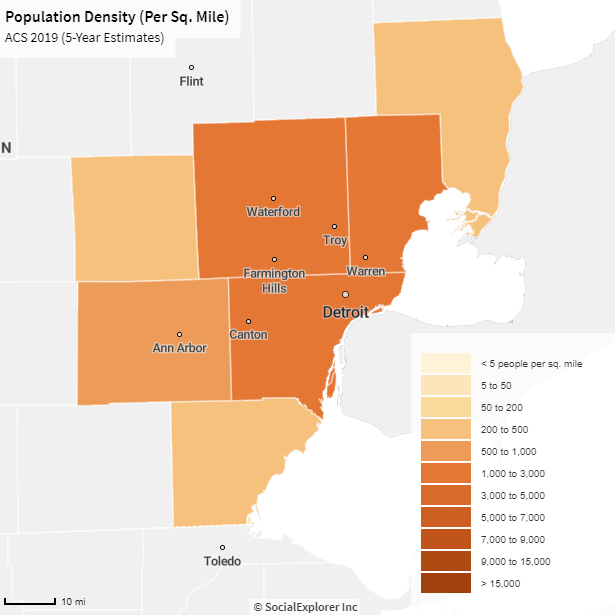
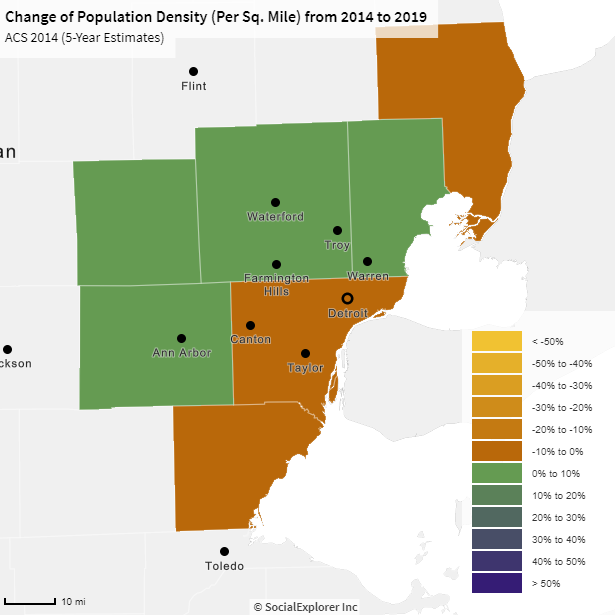
In 2019 Wayne County had the highest population density at 2,872 people per square mile. Detroit is located in Wayne County and in 2019 it had a population density of 4,689 per square mile, which remains the highest in the state despite decades of decline. As both the second and third map below show migration out of Wayne County has been the highest in the region since at least 2010. Between 2019 and 2014 there was a 1.8 percent decline in the population density of Wayne County and between 2010 and 2019 the total decline came in at 6 percent. Wayne County had a population of 1.75 million people in 2019 as compared to 1.77 million in 2014.

Washtenaw County, which had a population density of 520 people per square mile in 2019, experienced the highest percentage increase in population density between 2014-2019 and 2010-2019. According to Census data, between 2014-2019 there was a 4.3 percent increase in population density and between 2010-2019 there was a 6.7 percent increase. In 2019 Washtenaw County had a population of 367,601.

In Southeastern Michigan, Wayne, Macomb and Oakland counties all had the highest population densities at 2,872, 1,814 and 1,475, respectively. While Wayne County has lost population in recent years, Macomb and Oakland counties gained it, and with that came an increase in density. Between 2010-2019 Macomb County experienced a 3.9 percent increase in its population density and Oakland County experienced a 4.4 percent increase. Aside from Washtenaw County, Livingston County was the only other one to experience an increase; between 2010-2019 Livingston County experienced a 3.6 percent increase in population density. Monroe and St. Clair counties remain the least densely populated and have lost density since 2010 (a smaller decrease than Wayne County).

According to HomeSnacks.com, which ranks the fastest growing communities based on Census data, the following places have experienced the highest percentage of population growth since 2010 in Michigan:

  • Rockford
  • Novi
  • Coldwater
  • Auburn Hills
  • East Grand Rapids
  • Chelsea
  • New Baltimore
  • Milan
  • Kentwood
  • Rochester

Of these 10 communities, three are  in Oakland County (Novi, Rochester, Auburn Hills), one is in Macomb County (New Baltimore) and two are in Washtenaw County (Chelsea and Milan); none are in Wayne, Washtenaw or Monroe counties, all of which have been losing residents.

So, while Southeastern Michigan has been experiencing the migration of residents out of the Detroit for sometime, it is expected to continue. According to a recent Wall Street Journal article, the pandemic has caused the largest cities in the country to experience an exodus of residents, in part, due to an increased accessibility of remote work. According to the Wall Street Journal’s analysis of US Post Service data and Census data, the Midwest, Northeast and West all lost residents since the pandemic began while the South gained residents.

A shift in migration also means there will be, eventually, a shift in the fiscal health of cities and regions. In areas where people are leaving, tax revenue will also depart. What this could mean for places like Detroit and Michigan has yet to remain seen. However, with the continued out-migration of residents from Michigan over the last decade we do know that the State is losing another Congressional seat.

Certain Detroit Crime Incidents Decrease in 2020

The Detroit Police Department publishes public data on the number of crime incidents that occur by type of crime, precinct and year on its open data portal. The information provided below has been retrieved from this data portal and highlights the number of incidents, not victim counts, for each Detroit precinct in 2019 and 2020. The crimes reported on in this post are:

•Assault: attempt to cause physical injury to another person;

•Aggravated assault: assault, without a weapon, that results in a serious or aggravated injury;

•Homicide: the killing of another person, whether intentional or not;

•Sexual assault: forcing or coercing an individual to engage in any non-consensual sexual contact or sexual penetration.

The number of reported incidents for each type of crime varies across the precincts but one data piece stands out amongst all four types of crime: there was a decrease in reported incidents between 2019 and 2020. In both 2019 and 2020 the highest number of reported incidents was under the assault category, followed by the aggravated assault category and then sexual assaults and homicides.

In 2019 the Detroit Police Department reported 17,233 assault incidents and in 2020 it reported 12,534 assault incidents. Of the 11 precincts, Precinct 8 had the highest number of assault incidents in both 2019 and 2020. In 2019 there were 2,505 assault incidents reported in Precinct 8 and 1,660 in 2020. Precinct 4 had the lowest number of reported assault incidents in 2019 at 913 and Precinct 7 had the lowest number of assault incidents in 2020 at 657.

In 2019 the Detroit Police Department reported a total of 7,708 aggravated assault incidents and in 2020 a lower number of 7,311 incidents was reported. In both 2019 and 2020 Precinct 9 had the highest number of reported aggravated assault incidents at 1,210 and 1,107, respectively. Precinct 3 had the lowest number of reported incidents in 2019 and 2020 at 421 and 315, respectively. 

Between 2019 and 2020 there was a decrease in the number of reported homicides in the City of Detroit, according to the police department’s open data portal. In 2019 there were 276 reported homicides and in 2020 there were 244. Precinct 9 had the highest number of reported homicides in both 2019 and 2020 at 42 each year. Precinct 3 had the lowest number of reported homicides in 2019 and 2020 at 8 and 12, respectively.

In 2019 there were 817 reported sexual assault incidents in the City of Detroit, according to the police department’s open data portal. In 2020 467 sexual assault incidents were reported. Precinct 9 had the highest number of reported incidents in 2019 at 131; this was the only precinct in 2019 and 2020 with more than 100 sexual assault incident reports. In 2020 Precinct 8 had the highest number of incidents reported at 57. In 2019 Precinct 7 had the lowest number of reported sexual assault incidents at 40 and Precinct 4 had the lowest number of reported incidents at 27 in 2020.

Recent 2019 FBI data highlights how crime rates across the country continued to increase from 2018 to 2019. For example, in Detroit, shootings and homicides rose for the second-straight year, by 53 percent and 19 percent, respectively. And, while national FBI crime data helps paint a broad picture on crime trends, the 2020 data provided by Detroit’s open data portal shows that in 2020 there was a decrease in crime incidents. Of those reported on here—assault, aggravated assault, homicide and sexual assault—there was a decrease from 2019 to 2020 across the board.

According to the United Nations Office on Drugs and Crime the COVID-19 pandemic impacted crime statistics for several reasons. Certainly the initial lockdown, which kept many social interactions at bay, likely impacted the number of crimes that would have occurred early on. The drop in crime is correlated with the mobility of the population, so when restrictions were tighter there were fewer crimes reported, particularly property crimes (at homes, not businesses) and homicides. However, nationally, there was a spike in homicide rates in early summer, but it is unknown if that relates to the pandemic or other factors.

Additionally, while there was likely a decrease in the number of incidents there was also likely a decrease in reporting.

As we near the halfway mark of 2021, with vaccination rates increasing and restrictions loosening the question is whether crime rates increase from 2020 levels, remain the same or continue to decrease. As the pandemic continues to affect society, the changes in crime statistics helps us develop a deeper understanding of its affect on long-term crime rate trends.

Unemployment Rates Leveling Off, Consumer Consumption Increasing

In March of 2021 the unemployment rates for the State of Michigan and for the City of Detroit continued to a decline, which is a more recent trend. The State of Michigan reported an unemployment rate of 5.2 in March, which is the same at its February rate. However, since December of 2020 the State’s unemployment rate declined from 7.3 to 5.2.  For the City of Detroit, the unemployment rate for March of 2021 was 9.3, which is 0.3 points lower than the February unemployment rate and 11 points lower than the December 2020 rate. Both the Michigan and the Detroit rates were similar to the January 2020, pre-pandemic rates.

The chart above shows unemployment rates beginning to level off and the chart below reflects a similar message for some counties. Livingston, Macomb, Oakland and Wayne counties all reported higher unemployment rates in March of 2020 than March of 2021. In March of 2020 St. Clair County had the highest unemployment rate of 5.9, followed by Wayne County with an unemployment rate of 5.7.  Washtenaw County had the lowest unemployment rate in March 2020 at 2.7, but by March of 2021 that increased to 4.3. Washtenaw and Monroe counties were the only two in the region with higher unemployment rates in March of 2021 than March 2020. Both Monroe and Wayne counties had the highest unemployment rates in March of 2021 at 5.6. Livingston County had the lowest unemployment rate in March of 2021 at 3.2.

Just as the unemployment rate in the region is declining, so is the number of continued unemployment claims. These claims, also referred to as insured unemployment, are the number of people who have already filed an initial claim and who have experienced a week of unemployment and then filed a continued claim to claim benefits for that week of unemployment. Continued claims data are based on the week of unemployment, not the week when the initial claim was filed, according to the Southeastern Michigan Council of Governments.

The chart below shows a spike in April and May of 2020, when COVID restrictions tightened throughout the State. Since then though there has been a steady decline in the number of continued claims. The largest declines occurred between May and June of 2020 and September and November of 2020. Although there have been some increases in the number of continued unemployment claims since November of 2020, the April 10, 2021 number of 102,721 unemployed claims is the lowest number of claims in over a year.

Although unemployment numbers have been on the decline, there has been a recent increase in the number of small business closures, according to the Opportunity Insights Economic Tracker. This source uses credit card transaction data from 500,000 small businesses, Opportunity Insights estimates closures from the number of small businesses not having at least one transaction in the previous three days. The data cover many industries, including healthcare services, leisure and hospitality, and retail and transportation. The date source does says it has less coverage in manufacturing, construction, and finance.

According to the data, 31 percent of small businesses closed as of May 1, 2021. This number was an increase from the 26 percent of small business that were estimated to be closed on April 23, 2021. 

Since April of 2020 the percentage of small business closures has increased, but those numbers are not as high as when the pandemic began.

Below shows the consumption expenditures of goods in the U.S. between 2019 and 2021. According to the U.S. Bureau of Economic Analysis, durable goods have an average useful life of at least 3 years (e.g. motor vehicles) while nondurable goods have an average useful life of less than 3 years (e.g. food) and services are commodities that cannot be stored or inventoried and are consumed at the time of purchase (e.g., dining out). The chart below shows how consumption of services continues to remain steady, but not back to pre-COVID levels. On March 1, 2021 it was estimated that there was $8,182 billion in consumption of services, a slight increase from the month prior but below the January 1, 2020 levels.

The expenditures on durable and non-durable goods are now increasing above pre-COVID levels with the amount spent on durable goods being $2,314 billion as of March 1, 2021 and the amount spent on non-durable goods being $3,342 billion.

According to the Case-Shiller Home Price Index, the average price of single-family dwellings sold in Metro Detroit was $148,500 in February of 2021; this was $1,500 higher than the average family dwelling price in January. The February 2021 price was an increase of $14,070 from February of 2020 and $49,430 from February of 2014. Home prices have continued to increase year-after-year but the recent average price of single-family dwellings sold in the Metro-Detroit area has increased at a higher rate than in previous years.