Wayne and Macomb counties have highest percentage of students eligible for free and reduced lunch

Just as individuals in Michigan are eligible for the U.S. Department of Agriculture’s Supplemental Nutritional Assessment Program (SNAP) program, children in economically disadvantaged families are eligible for nutritional assistance while attending school. Based on the annual income of a child’s family, he or she is eligible for such nutritional assistance through the free and reduced lunch program. In this post, we examine the percentage of students who are eligible for this program in each district and the percentage of students who actually receive the benefit.

First though, we outline what those eligibility standards were in the state of Michigan for the 2013-14 school year. According to the Michigan Department of Education, economically disadvantaged students are those who are eligible, according to the chart shown below, to receive free and reduced lunch benefits through the U.S. Department of Agriculture.

Scale for Free Meals or Free Milk Scale for Reduced Price Meals
Total Family Size Annual Monthly Annual Monthly
1 $14,937 $1,245 $21,257 $1,772
2 $20,163 $1,681 $28,694 $2,392
3 $25,389 $2,116 $36,131 $3,011
4 $30,615 $2,552 $43,568 $3,631
5 $35,841 $2,987 $51,005 $4,251
6 $41,067 $3,423 $58,442 $4,871
7 $46,293 $3,858 $65,879 $5,490
8 $51,519 $4,294 $73,316 $6,110
For each additional family member add:
$5,226 $436 $7,437 $620

Slide03 Slide04

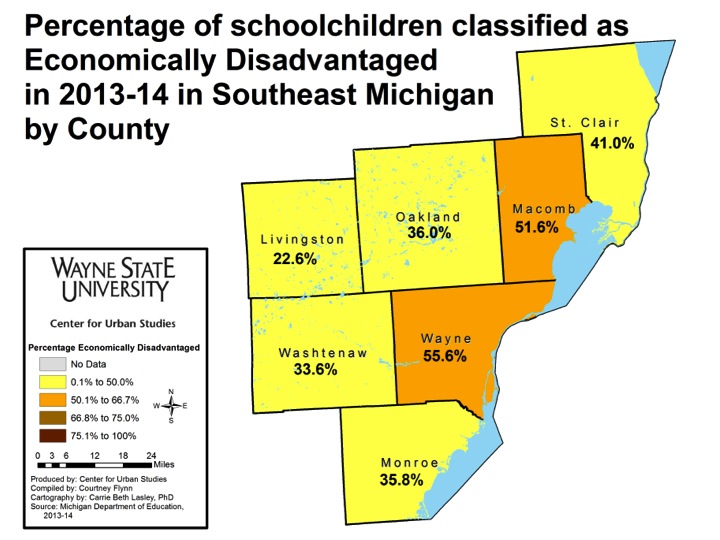
In the region, Wayne County had the highest percentage of students eligible for free and reduced lunch at 55.6 percent.

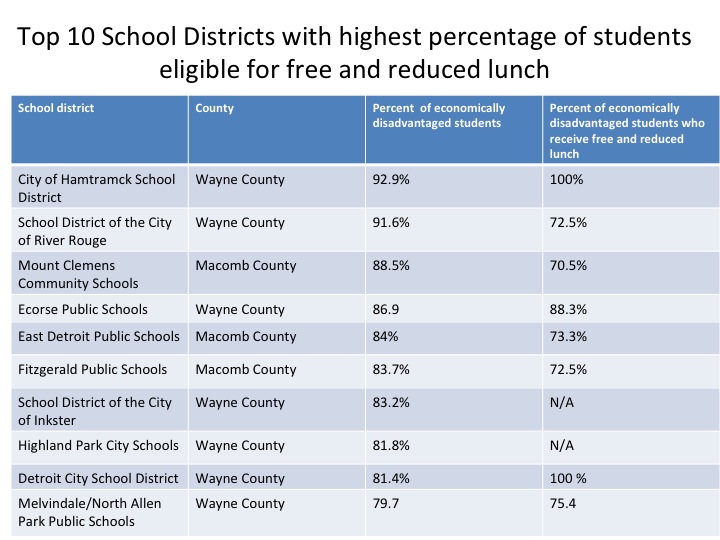
Within Wayne County, the School District of the City of Hamtramck had the highest percent of eligible students at 92.9 percent.

Overall, 19 of the 34 public school districts in Wayne County had 55.6 percent or more of their student populations eligible for free and reduced lunch during the 2013-14 school year. Of those 19, eight of the school districts had 80 percent or more of the students eligible for free and reduced lunch benefits and of those eight, two districts had 90 percent or more of the students eligible.

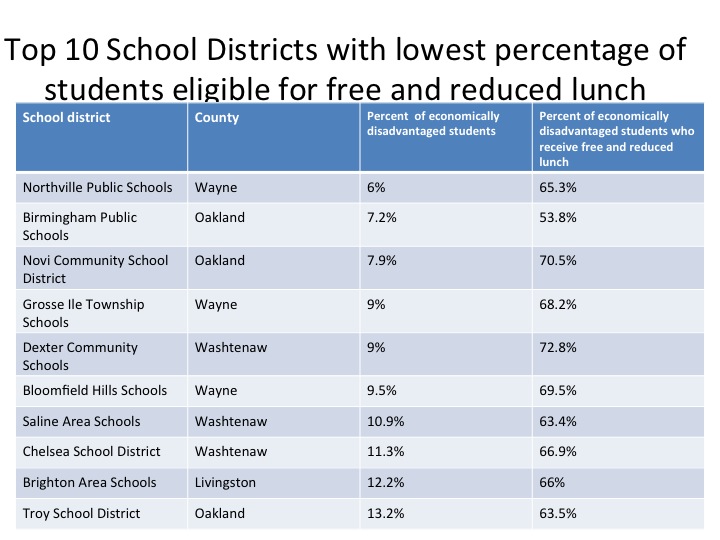
On the opposite end of the spectrum, Northville Public Schools had the lowest percent of students eligible at 6 percent, followed by Grosse Ile Township Schools at 9 percent. There were only four school districts in Wayne County where 20 percent of less of the student population was deemed economically disadvantaged.

In Macomb County, which had the second highest percentage of free and reduced lunch eligible students in the region at 51.6 percent, there was not one district where 20 percent or less of the student population was eligible for free and reduced lunch. Ten of the 21 school districts were above 51.6 percent county average though, with Mount Clemens Community Schools having the highest percentage at 88.5 percent.

Livingston County had the lowest county average of eligible students at 22. 6 percent. With only five public school districts, Howell Public Schools had the highest percentage of eligible students at 29.6 percent and Brighton Area Schools had the lowest at 12.2 percent.

Overall, Wayne County had the most number of school districts in the top 10 with the highest percent of students eligible for free and reduced lunch while Wayne, Oakland and Washtenaw counties each had three districts in the top 10 with the lowest percent of eligible students. It is notable that among those districts with lowest percentages of eligible students, a substantially lower percent of those eligible actually received benefits.

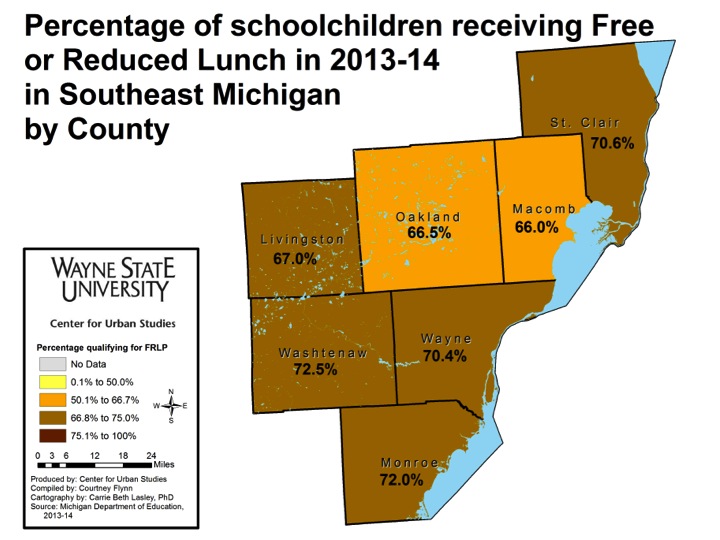
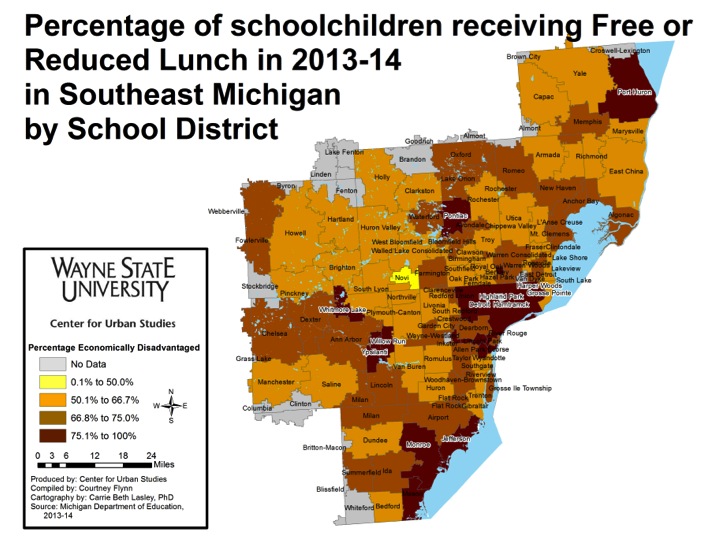
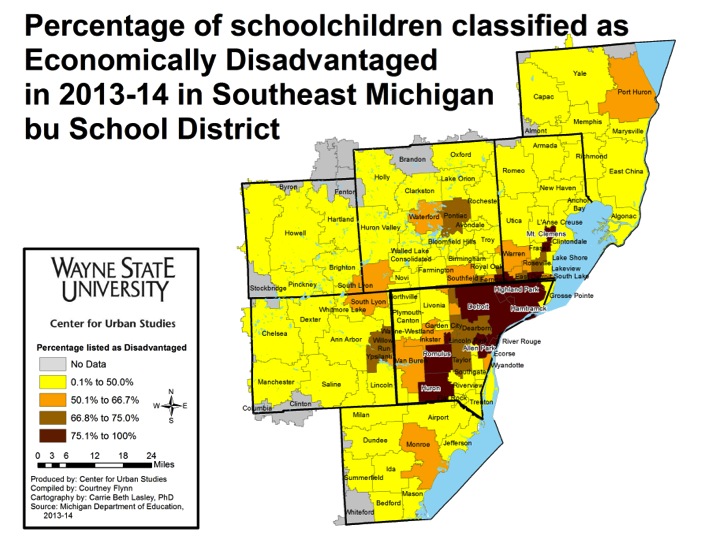
Although a student may be eligible for free and reduced lunch benefits, it does not mean they receive them. The two maps above show the percentage of eligible students who collected these benefits.

For this, Washtenaw County had the highest percentage of students who collected these benefits. In Washtenaw County, 33.6 percent of the student population was considered economically disadvantaged and of that, 72.5 percent of the students collected the benefits they were eligible for. Students in Ypsilanti Public Schools had the highest percentage of eligibility in the county at 68.9 percent and the second highest collection rate at 78.9 percent. In Willow Run Community Schools 100 percent of the eligible students (68.3 percent of the student population) received free and reduced lunch.

In Macomb County, although it had the second highest percentage of students eligible for free and reduced lunch benefits, it had the lowest percentage of students who received the benefit (66 percent). Armada Area Schools, which had the lowest percentage of students eligible for such benefits in the county (21.4 percent) also had the lowest percentage of students who received them (54.9 percent). East Detroit Public Schools had the highest percent of students who collected free and reduced lunch benefits at 73.3 percent although 84 percent of the student population was eligible for such benefits.

The School District of the City of Hamtramck, which had the highest percentage of eligible students in the region at 92.9 percent, had 100 percent of those students receive benefits. In Wayne County, the only other district where 100 percent of the eligible students collected free and reduced lunch benefits was Westwood Community School District; 69.9 percent of these students were eligible.


MLIVE: Michigan residents poised for SNAP funding cuts

According to MLive, some Michigan residents who receive Supplemental Nutrition Assistance Program benefits are likely to lose an average of $76 a month in funding because of federal cuts that the State of Michigan didn’t take action to avoid. Under the new farm bill, there is a provision that states in order for a person to be eligible for additional SNAP benefits they must receive at least $21 in heating assistance. A Michigan Department of Human Services spokesperson told MLive that the State can’t “justify spending $21 per household for people that didn’t have any energy expenses.” Many people who rent don’t have utility bills and in the past the State only had to pay $1 in heating assistance for a family to be eligible for more SNAP benefits. To learn more click here.

Highland Park has highest percent of residents collecting SNAP benefits

The U.S. Department of Agriculture’s Supplemental Nutritional Assessment Program (SNAP) provides nutritional assistance to millions of people nationwide. In order to be eligible for SNAP benefits in the State of Michigan, the Department of Human Services examines an individual’s or family’s income, shelter expenses, medical expenses and assets.

In this post, we will examine the percent of residents in each municipality in southeast Michigan who received SNAP benefits in 2012.

Slide03Slide04Slide05

There were 100 municipalities, out of 191, in the region where 8 percent of residents or less collected SNAP benefits in 2012. There were, however, eight municipalities where 32 percent or more of the population collected SNAP benefits.

Slide07

According to the American Community Survey, in 2012, 48.1 percent of Highland Park residents, 44.4 percent of Hamtramck residents, 38.8 percent of Inkster residents, 37.7 percent of Detroit residents, 34.7 percent of River Rouge residents, and 33.7 percent of Ecorse residents collected SNAP benefits.

The other municipalities where more than 32 percent or more of the population collected SNAP benefits in 2012 were Pontiac and Rose Township, both in Oakland County. In Pontiac, 34.8 percent of the residents collected these benefits and in Rose Township 39.2 percent collected them.

 The inner-ring suburbs of Detroit, such as Warren (25%) and the city of Dearborn (18.1%), had a higher percentage of residents collecting SNAP benefits in 2012 than outer-ring suburbs, like Royal Oak (5.5%) and Livonia (4.8%). The two municipalities throughout the region with the lowest percentage of residents collecting SNAP benefits were Webstertown in Washtenaw County and Grosse Pointe Farms in Wayne County; each had .7 percent of residents collecting such benefits.

As noted, one’s eligibility for SNAP benefits is partially based on income. In November of 2013, Drawing Detroit, published a post on median income for the region using data from 2009 and 2011. In 2009, the median income for Hamtramck was about $30,000 and the median income in Detroit was $33,754. In Oakland County though there were 11 communities where the average median income was above $100,000. An example is below, showing the 11 communities in Oakland County where the average household income is above $100,000 and the percentage of residents that collected SNAP benefits. Given this, it appears income is actually a larger factor when being considered for SNAP benefits.


Slide11


Wayne State, UofM and MSU draw most students from local regional

There are three universities in the state of Michigan that make up the University Research Corridor, an alliance committed to transforming and diversifying the state’s economy. These three universities are the only public universities in the state to have their governing bodies appointed by the voters of the State of Michigan. These universities are Wayne State University (WSU), the University of Michigan (UofM) and Michigan State University (MSU). This post aims to show where students who attend these universities come from within the state, country and across the nation.

Slide03Slide04Slide05

In looking at all three maps, it becomes obvious that WSU’s population is largely representative of residents from the tri-county area (Wayne, Oakland and Macomb Counties). As WSU is historically a commuter school centered in Detroit, this reflects what one would expect. In fall of 2013, about 7,900 of the students who enrolled at WSU lived within Wayne County. During that same time, there were about 6,000 students from Oakland County and about 4,900 from Macomb County. Although Washtenaw County is still within the Southeastern Michigan region, only 507 students were from there; Washtenaw County residents represented the fourth largest population in the state.

Just as geographic representation decreased the farther away one got from Wayne County within the state, the same continued for states outside of Michigan. Ohio and California were the two states mostly highly represented in fall of 2013 with 107 and 97 students, respectively, coming from each. These two states, individually, had more representation at WSU than some counties in Michigan, such as Jackson and Ionia to name a few.

When looking at the geographic makeup of WSU on a global scale, aside from the United States, Canada had the largest population with 576 students and China had the second largest representation with 332 students. There are 26,020 students, including both graduate and undergraduate students, who attended Wayne State in fall of 2013 who were from the U.S.

Overall, enrollment in fall of 2013 was recorded at 27,897 students. Of that, 25,043 (89%) were from within the state of Michigan, 977 (4%) were from another state and 1,877 (7%) were from another country.

Slide07Slide08Slide09

Similar to Wayne State University, much of the University of Michigan’s student population came from Wayne, Oakland, Washtenaw or Macomb Counties. For UofM, however, the representation of Washtenaw County residents, where UofM is located, was five times higher than those who attend WSU. Conversely, WSU had more than twice the number of Wayne County residents than UofM.

Although both universities largely drew from the same geographic locations in state, UofM had a much greater overall representation of students from across the state. At WSU, there were some counties with no representation, but at UofM, every Michigan county was represented. Keeweenaw and Oscoda Counties had the lowest in-state representation at 1 student.

When looking at the representation from across the country, UofM out-did both WSU, and as you will see below, Michigan State University. In fall of 2013, UofM enrolled 15,704 students from across the country (not including Michigan); this represented 36 percent of the student population. Illinois was the state with the largest representation; 1,918 students from there attended UofM in fall of 2013. Only nine students from the state of North Dakota enrolled in UofM at the state time, making it the state with the least representation.

On an international scale, China was the most represented with 2,334 students enrolled at UofM for fall of 2013. The international population at UofM during this time represented about 14 percent of the student body.

Overall enrollment at UofM during this time was 43,710; 37,651 of those students were from the U.S.

Slide11Slide12Slide13

Unlike UofM and WSU, where the largest geographic representation comes from the universities’ home counties, Michigan State University drew the majority of students from outside of the region it is located in (Ingham County). Like its sister schools, Wayne, Oakland, Macomb and Washtenaw counties were heavily represented. From in-state, Oakland County was the most represented with 8,558 students. There were 4,937 students from Wayne County who attended MSU in fall of 2013, 2,764 from Macomb County and 1,364 from Washtenaw County. There were 3,130 students from Ingham County, where MSU is located, who attended the university; this was more than those sent from Macomb and Washtenaw Counties. Kent County was also highly represented with 2,348 students attending MSU in fall of 2013.

When looking at enrollment from out-of-state residents, Illinois again had the highest representation with 1,308 students. West Virginia had the lowest with one student. Overall, the out-of-state student population at MSU in fall of 2013 represented 11.6 percent of the student body.

In 2013, 4,419 students from China attended MSU, making it the country with the highest representation, aside from the U.S. The international population at MSU during fall of 2013 represented about 15 percent of the student body.

Overall, in fall of 2013 enrollment at MSU was 49,292; the number of full-time students from the U.S. was 41,950.

For this data set, MSU only counted all full-time students.

Slide15Slide16

In comparison, above is a map that shows where students who attended Temple University in Philadelphia, Pennsylvania in fall of 2013 originally resided. This university was chosen because it is located in a similar environment as WSU and typically has similar enrollment numbers.

Temple University had 38,148 students enrolled in fall of 2013, of whom 22,318 were from Pennsylvania. The state of New York had the highest out-of-state representation with 564 students.

Overall, the Temple student population of only undergraduate students was 26,454 and the overall student undergraduate population was 27,514.

For the purpose of this post, Temple was the only school to only count undergraduates for its student population.

Detroit’s unemployment experiences two month increase

    • From June 2014 to July 2014, the unemployment rate across the state and the city of Detroit increased (monthly);
    • The Purchasing Manager’s Index for Southeast Michigan decreased from June 2014 to July 2014 (monthly), but increased over the last month;
    • The Commodity Price Index increased from June 2014 to July 2014 for Southeast Michigan (monthly);Standard and Poor’s Case-Shiller Index declined for June.
    • Data also indicate a decline in the rate of year-to-year increases in the prices of homes in the Detroit Metropolitan Statistical Area;
    • Wayne and Macomb counties experienced increases in the number of monthly building permits pulled.

    Slide02According to the most recent data provided by the Michigan Department of Technology, Management and Budget, from June to July the unemployment rate for the state of Michigan increased from 7.9 to 8.6 percent. The city of Detroit experienced a more severe unemployment rate increase — from 16.4 percent in June to 17.7 percent in July. The unemployment rate in Detroit has decreased 1.2 points since July of 2013.

    Slide04

    From June to July the number of people employed in the City of Detroit decreased by about 250, leading to a total of to 284,497 people employed.

    Slide06

    The above chart shows the number of people employed in the auto manufacturing industry in the Detroit Metropolitan Statistical Area (MSA) (Detroit-Warren-Livonia) from July 2013 to July 2014. During the period under consideration, the highest employment levels in the auto manufacturing and auto parts manufacturing industries occurred in June 2014, when there were 99,100 people employed in the Detroit MSA. That number dropped by 7,500 people to a total of 91,600 people employed in July.

    Slide08

    The Purchasing Manger’s Index (PMI) is a composite index derived from five indicators of economic activity: new orders, production, employment, supplier deliveries, and inventories. A PMI above 50 means the economy is expanding.

    According to the most recent data released on Southeast Michigan’s Purchasing Manager’s Index, the PMI for July was 60, a positive increase of 12.9 points from the prior month and 16.9 points from a year ago.

    Slide10

    The Commodity Price Index, which is a weighted average of selected commodity prices, was recorded at 59.1 points in July, which was 2.6 points higher than the previous month.

    Slide12Slide13

    The above charts show the Standard and Poor’s Case-Shiller Home Price Index for the Detroit Metropolitan Statistical Area. The index includes the price for homes that have sold but does not include the price of new home construction, condos, or homes that have been remodeled.

    According to the index, the average price of single-family dwellings sold in Metro Detroit was $97,260 in June 2014. This was an increase of approximately $8,790 from the average price in June 2013.

    The percent changes in price from the year prior decreased from 18.2 percent in June of 2013 to 10.2 percent in June of 2014. This shows that the prices of area dwellings are not increasing as much as they were at this time last year.

    Slide15Slide16Slide17

    The above charts show the number of residential building permits obtained each month in Wayne, Oakland, and Macomb counties from January 2013 until July 2014. These numbers are reported by local municipalities to the Southeastern Michigan Council of Governments and include single-family units, two-family units, attached condos, and multi-family units.

    Oakland County showed a slight increase from June 2014 to July 2014, while the other two showed more substantial increases. Oakland saw 201 permits pulled in June, while in July 205 were pulled. Macomb County experienced the largest increase; in June 153 permits were pulled and in July 274 were pulled.

African Americans most likely to leave Wayne County

This post breaks down the top locations of out-migrants and in-migrants by race, age, educational attainment and income from years 2006-2010 and 2007-2011 (depending on the data). As you will see, there are certain groups that are much more likely to leave Wayne County.Slide03Wayne County has lost a large share of its residents to out-migration. The high out-migration is reinforced by the chart above, which shows the ratios per category for those coming into Wayne County, compared to those leaving. African Americans had the largest disparity; for every one African American who moved into Wayne County, 27 left. The age group of 60-69 had the smallest disparity; for every one person that age who moved in, two left.

Slide05

Slide06  Of the top 10 destination counties for out-migrants, seven of them were in Michigan. In total, 13,417 residents left Wayne County to move elsewhere. For White in-migrants to Wayne County, only four of the top sources were other Michigan counties. In total, 897 White in-migrants moved to Wayne County between 2006 and 2010.Slide09Slide08  Five of the top 10 destinations for Latino out-migrants were other Michigan counties, with Kent County ranking first with a total of 273 people; in total there were 682 Latinos that left Wayne County between 2006 and 2010. Only three of the top 10 sources of in-migrants were in Michigan. The county that provided the most in-migrants (238) was Cook County, Illinois. Cook County is the home of Chicago, which is a major entry point for Latinos into the Midwest. The Cook County numbers were 41.5 percent of the Latino population that entered Wayne County between 2006 and 2010.Slide11Slide12  A large number of African Americans left Wayne County for areas immediately around it—Oakland, Macomb and Washtenaw Counties. Far fewer African Americans moved into Wayne County. This is consistent with the substantial increases in African Americans throughout the inner suburbs of Detroit, which commentators suggest is driven by the search for better schools and safer communities. Of the top 10 locations African American in-migrants left to move to Wayne County from, only three counties were in Michigan (St. Clair, Alger, and Ottawa counties) from 2006 to 2010. In total there were seven counties in Michigan in which African Americans migrated to Wayne County from. There was a total of 197 African American residents who moved from Dakota County, Minnesota, to Wayne County; this location had the most African American in-migrants come from one place during this period. This location represented 22 percent of the total African American population that moved into Wayne County between 2006 and 2010.Slide14Slide15
  For the three charts above and the three below, only certain age groups were examined to show the movement of families, young people and the elderly. We wanted to see if the assumption that the elderly would have a higher rate of out-migration, as they typically move to retirement communities, was true. It was not. For all age groups represented above, Oakland and Macomb counties had the highest number of Wayne County residents move within their boundaries. Of the three groups, children were the largest (5,375), followed by young adults (1,309). Only a total of 258 Wayne County residents from the 60-69 year old age group moved to those two counties.Slide18

Slide15

Slide19Slide20  Few children between the ages of 5 and 17 moved to Wayne County from elsewhere in the state. There were 32 in-migrants from Ottawa County and 30 children from Ingham County. Those between the ages of 25 and 30 from within the state of Michigan represented larger in-migration numbers. For example, 326 residents moved from Washtenaw County to Wayne County, 91 from Genesee County, 82 from Ingham County and 53 from Kent County.Slide22Slide23Slide24  Wayne County is losing many residents of all education levels to the out counties and beyond. Of those with bachelor’s degrees, from 2007 to 2011, 1,566 went to Oakland County and 256 went to Macomb County; in total 3,417 residents with bachelor’s degrees left Wayne County. Oakland and Macomb counties also received the highest number of Wayne County residents with less than a high school degree and a graduate or professional degree.Slide26Slide27Slide28  At each educational level, immigrants represented just a fraction of out-migrants. There were 424 residents with a bachelor’s degree from outside Wayne County that moved in. There was a net total of 272 people with a graduate or a professional degree who moved to Wayne County and 499 people without a high school diploma who moved in. A Michigan county ranked number one for each education level represented here, in terms of residents leaving to move to Wayne County.Slide30Slide31  Three times as many residents who made $150,000 a year moved out of Wayne County than moved to it. Of those who left between 2007 and 2011, 253 residents went to Oakland County and another 209 went to Wake County, North Carolina. In total there were 1,869 residents who earned $150,000 or more and left Wayne County between 2007 and 2011. When examining the in-migrants, more (228) moved from Washtenaw County than any other county. Clark County, Nevada ranked second on that list with a total of 105 residents leaving there for Wayne County. Overall, 644 people who earned $150,000 a year or more moved to Wayne County.