Environmental Injustices Continue in Detroit

Environmental injustice occurs when certain populations, typically those who are marginalized, and the environment are both harmed from certain actions. We have seen this occur with the Flint water crisis and we continue to witness it right here in Detroit. While pollution can come in many forms, it is air pollution that we are focusing on in this post and what is at least one factor in Detroit’s environmental injustice.

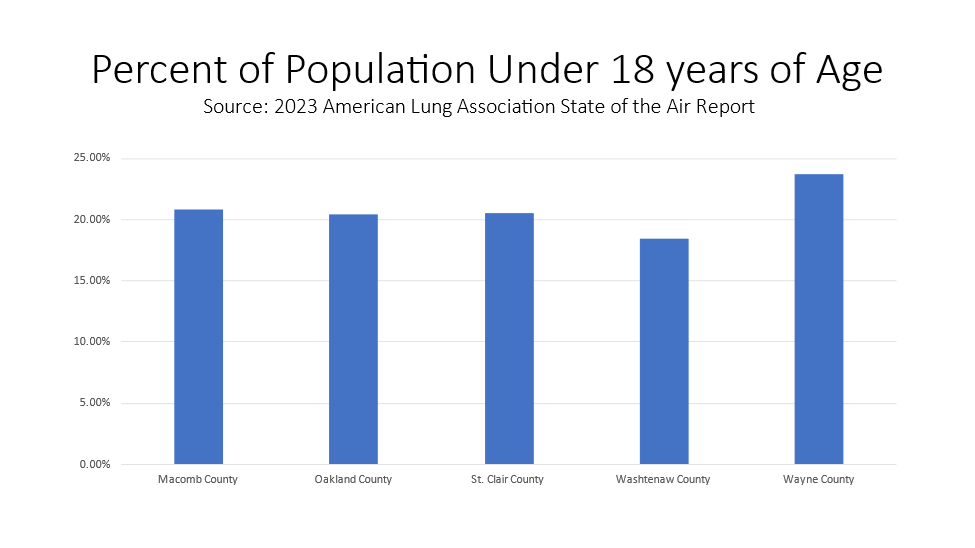
Before we dive into some of the sources of Detroit’s air pollution it is important to understand Detroit’s socioeconomic makeup. With a population of about 620,000 residents, 78 percent of the population is black, nearly 25 percent of the population is under the age of 18 and 32 percent of the population lives in poverty, according to the US Census Bureau.

Furthermore, according to the University of Michigan School of Public Health it is estimated that air pollution kills more than 650 Detroiters a year, with thousands more being hospitalized and children missing a disproportionate number of days at school because of illnesses and asthma.

According to the 2021 update on the State of Michigan’s “Detroit: The Current Status of Asthma Burden,” the asthma rate of the in the City of Detroit in 2019 was four times higher than the State of Michigan’s rate. Additionally, there were 1,458 asthma hospitalizations of Detroit residents in 2019.

Between 2017 and 2019, 71 Detroit residents died due to asthma. The rate of asthma mortality among Detroit residents was 31.4 per 1,000,000 population. The rate of asthma mortality in Detroit in 2017-2019 was about three times the rate for Michigan as a whole.

Now, when further digging into asthma rates el, the “Detroit: The Current Status of Asthma Burden,” states that in 2019, the rate of asthma hospitalization among Detroit’s Black population was 31 per 10,000 while the rate among Detroit’s white population was 7.9 per 10,000.  Asthma hospitalization among Detroit Blacks were over three times that of Detroit whites. Michigan Blacks had over five times the hospitalization rate of Michigan whites.

According to the American Lung Association, the exact cause of asthma remains unknown, but there are certain factors that play a role in developing the disease. These factors include family history, allergies, viral respiratory infections, obesity, smoking, certain jobs and air pollution, especially including dust and mold.

As noted in our last post, there are several secondary particle pollution sources that have a negative impact on the area’s air quality in Metro-Detroit. According to climatetrace.org, a global non-profit organization that independently traces greenhouse gas emissions, some of the area’s highest emitters are an oil refinery, two steel plants, an airport and a powerplant. These emitters are:

Marathon Petroleum CO Detroit:

Ranked 378/80,188 Worldwide: for Carbon Dioxide emissions (CO2E)

Cleveland-Cliffs Dearborn Steel Plant

Ranked 296/80,188: for Carbon Dioxide emissions (CO2E)

Detroit Metropolitan Wayne County Airport

Ranked 917/80,188 for Carbon Dioxide emissions (CO2E)

Gerdau Monroe Steel Plant

Ranked 1,450/80,188 for Carbon Dioxide emissions (CO2E)

Monroe Michigan Power Plant (DTE)

Ranked 37/80,188 for Carbon Dioxide emissions (CO2E)

Other secondary sources that contribute to particle pollutants in the Metro-Detroit are the the Mistersky and River Rouge power plants, highways, the Ambassador Bridge and Stellantis manufacturing plants in Warren and on Detroit’s eastside.

The media has long reported the history of the Detroit’s 48217 ZIP code, which is located in Southwest Detroit. With the Marathon plant and the DTE Delray and Mistersky powerplants, along with nearby highways and international trucking routes (Ambassador Bridge and soon to be Gordie Hower International Bridge), the amount of air pollution in this area is at concerning levels.

According to a recent released by the University of Michigan School of Public Health, between 2016-2021 the major source of PM2.5 ( which is fine inhalable particles, with diameters that are generally 2.5 micrometers and smaller) in the area was “mobile sources of emissions,” or vehicle exhaust and construction equipment, at 40 percent. Industrial sources of emissions also contributed a “sizable” amount to the PM2.5 levels, but were on the decline due to recent closures of coal-burning power plants and other facilities in the area.

Another area of growing concern is Detroit’s eastside, where the Stellantis production plant has not only grown to two production lines, but the amount of traffic has also increased due to the addition of a logistics warehouse that services the Stellantis plant. As has been noted in this and previous air quality posts, high traffic and industrial areas are major factors in both environmental pollution and an individual’s health.

So, what we know thus far is that Detroit is a primarily a city composed of minorities, particularly African-Americans and Hiuspanics with a lower median income than neighboring communities in Southeast Michigan. We also know that in Detroit there are pockets of dedicated space for industry, whether it be manufacturing plants, power plants or other forms that push PM2.5 into the air. Poor air quality is not only a major concern for many Detroit residents, but also a reality. This type of environmental injustice has led to severe health problems for thousands of residents, both children and adults.

With strong regulations, from zoning to emission standards and even traffic regulations, we can work toward alleviating environmental injustices. However, as we continue to see at an increasing rate, pollution and other negative impacts on the environment have a long-lasting impact. Advocating for and taking steps to implement equitable solutions when it comes to housing, education and access to jobs is crucial.

Various Populations At-Risk By Continued Poor Air Quality in Michigan

Ozone action season is upon us here in Southeast Michigan; it began March 1 and continues through the end of September. Ozone Action Days are declared when hot temperatures are expected to combine with pollution, creating high amounts of ground-level ozone. Ground level ozone, especially in excess, can cause a human health threat, particularly to vulnerable population. These vulnerable populations include children, those 65 years of age or older, those with asthma, COPD, cardiovascular disease, lung cancer and those who are pregnant.

In 2022 in Southeast Michigan there were five Ozone Action Days, according to the Southeast Michigan Council of Governments, or days when the public is asked to do less strenuous activities and to reduce the ways in which they may contribute to air pollution. While we were certainly hoping for zero Ozone Action Days in 2023, we have already had 14, due in large part to the smoke that has drifted to Southeast Michigan from the Canadian and Northern Michigan wildfires. The most recent Ozone Action Day in Southeast Michigan was declared on July 5, 2023 and the first of the season was declared on April 15, 2023.

With nearly triple the number of Ozone Action Days in 2023 compared to 2022, concerns of air quality remain a constant worry throughout Michigan, as does the population’s health, particularly our most vulnerable populations’. Each year the American Lung Association releases a State of the Air Report that examines air quality at the county, state and national levels and how it impacts certain populations. For the 2023 State of the Air Report, The American Lung Association had data on the vulnerable populations of Macomb, Oakland, St. Clair, Washtenaw and Wayne counties.

As the data shows, children (those under the age of 18) are the category with the highest percentage of individuals at risk. Of the five counties with such data available from the American Lung Association, between 18 and 24 percent of the populations are children, with Wayne County having the highest percentage and Washtenaw County having the lowest percent. The category of those 65 years of age or above had the second highest percentage of individuals at risk, with between 15 (Washtenaw County) and 19 percent (St. Clair County) of the population being at risk of health complications from high ground ozone levels.

Of the diseases/conditions that can contribute to health problems during Ozone Action Days, adult asthma was the most common among the counties in Southeast Michigan (between 9-10 percent of the populations in the counties had adult asthma). Of the child population in the region, each of the five counties discussed in this post had 7 percent of that population with childhood asthma.

For COPD, less than 7 percent of the populations in Macomb, Oakland, St. Clair, Washtenaw and Wayne counties had the disease, except for Wayne County where the American Lung Association reported 11.5 percent of the population had COPD.  Heart disease, lung cancer and being pregnant also cause increased health risks during high ozone days, and of those three categories heart disease had the highest percentage of individuals who could be impacted.

While we can’t control how and when wildfire smoke will drift through our region there are actions we can take to help lower the amount of particles in the air, in general, and especially during Ozone Action Days.

According to the Southeast Michigan Council of Governments, to help lower the amount of ground level ozone in the air we can:

  • Delay mowing your lawn until evening or the next day. Exhaust from a lawn mower and other gas-powered lawn and garden equipment help form ozone.
  • Drive less, telecommute, bike, or walk. This helps reduce traffic congestion and air pollution.
  • Avoid refueling vehicles during daylight hours. Fumes released at the gas pump contribute to ozone formation.
  • Delay or combine errands. This will reduce traffic congestion and air pollution.
  • Reduce electricity use.

With wildfires still burning in Canada, temperatures continuing to rise and air pollution still occurring in Southeast Michigan, it is likely the number of Ozone Action Days in Southeast Michigan will rise from 13. For some of our most vulnerable populations, summer days may be spent inside more often than expected, now and in the future. As noted in our previous post, the wildfires causing our most recent Ozone Action Days are related to climate change, which is creating hotter and dryer seasons.

And, while wildfires are impacting our air quality, so is pollution, which also is a driving factor in climate change. Two of the vulnerable populations we did not discuss in this post are those in poverty and certain minorities. We will further examine how these populations are impacted by not only air quality, but also pollution, in future posts as we have a larger conversation on environmental racism.

Michigan Air Quality Remains Poor, State at Risk of Increased Fires

As of 10 p.m. on Monday June 26, some places in Michigan had Air Quality Index (AQI) levels above 150, a level that is serious for even healthy people and can be dangerous for people with serious health conditions, according to PurpleAir.com. This website tracks hyperlocal quality throughout the country on a daily basis; to view current information click here.

The poor air quality in Michigan, currently, is a result of massive fires in Canada, particularly Quebec, with smoke drifting down into Michigan.

But Michigan is also facing a substantial increase in wildfires of its own. And it could get worse.

The average number of fires per year in Michigan is 337, according the Michigan DNR, and halfway through 2023 the state is on pace to exceed that average with 238 fires having already been reported. According to the Michigan Department of Natural Resources there have been 205 total fires in Michigan’s lower peninsula in 2023, as of June 26, 2023, and 33 in the upper peninsula.

There are several reasons for fires, which include everything from lightening (279 since 2006) to fireworks (53 since 2006) to debris burning (1553 since 2006) and more. But one common factor amongst many fires is a dry environment that allows sparks to turn into flames and flames, in some cases, into raging fires. As of June 26 of this year, 2,532 acres of land had been burned by fires in Michigan; the average number of acres burned by fires in Michigan in June is 270. The Wilderness Fire Trail in Crawford County, which was started by a bonfire, burned more than 2,000 acres of land in June, according to the Associated Press. This wildfire contributed to the above average number of acres burned by fire in 2023. Michigan wildfires also drew attention in May, with more than three dozen being reported, according to Bridge Magazine. The cause? Drier than usual weather. According to the National Integrated Drought Information System, May of 2023 was the ninth-driest May in Michigan since the federal government began keeping records in 1895.

With summer just beginning, we are nowhere near being out of fire season. According to the US Drought Monitor, created by the University of Nebraska-Lincoln, much of Michigan is at least abnormally dry, as of June 22, 2023. The western portion of the Upper Peninsula and about a third of the Lower Peninsula (the thumb and the top of the “mitten”) have been deemed “abnormally dry,” and nearly all the remaining portion of the “mitten” (including Wayne County) have been deemed “moderately dry.” There is also an area in mid-Michigan that has been deemed to be in a severe drought; the eastern portion of the Lower Peninsula has no drought conditions.

With drier conditions being a factor in increased fires across the state of Michigan, we must also touch on what is behind the drier conditions. Climate change, driven by increased emissions, pollution and more, can be dubbed as the main culprit behind increased drought conditions in certain areas (and increased drought in other areas, but that is for another day).

In Michigan, average temperatures have already risen 2.5 degrees, with summers being hotter and heatwaves being stronger. Fast forward to 2100, summers in Isle Royale National Park, for example, are expected to be 11 degrees hotter, according to statesatrisk.org.

The chart below shows just how Michigan’s annual daily temperatures have changed since 1900 and how they are expected to change up to 2100, depending on the amount of emissions we continue to pump into the environment (Southeast Michigan has several high emission emitters, as will be discussed in detail in a future post). The observed data is through 2020 and shows that Michigan’s average temperature has increased by nearly 3 degrees (Fahrenheit) over time. According to the data set from The Cooperative Institute for Satellite Earth System Studies and the National Oceanic and Atmospheric Administration (NOAA), even with lower emissions temperatures are expected to increase in Michigan by a minimum of 3 degrees through 2100. That number could increase to at least 12 degrees though if the emissions we produce increase.

With climate change having a direct impact on our environment, it is also having a direct impact on our lives. We know drought can be catastrophic to crops, our food systems and the economy and we know fires cause destruction. It should also be known that fires also have a direct impact on air quality, which affects the lives of all of us.

Next week we will dig into how Michigan’s air quality ranks and how the fires in Michigan, and beyond, have making it much worse in recent weeks.

Southeast Michigan’s Poor Air Quality a Result of Climate Change

Air quality in Southeast Michigan has been notably poor in recent weeks, with three Ozone Action Days occurring in June thus far. According to the Southeast Michigan Council of Governments, Ozone Action season began on May 1 in Southeast Michigan. This year is the 30th year of the voluntary program that helps keep Southeast Michigan’s air clean. In 2022, there were five Ozone Action days.

As we’ve discussed in previous posts, clean air is vital to healthy populations, and in Southeast Michigan clean air has been hard to come in recent weeks. The Canadian wildfires have been the easy culprit to blame for the poor air quality, the real root of the problem goes much deeper….climate change.

Wayne State University Center for Urban Studies Director Lyke Thompson further dives into what is causing poor quality in Southeast Michigan in this recent opinion piece published by the Detroit Free Press.

Synthetic Opioid Overdose Deaths in Michigan Continue to Rise, Outpace Other Opioid Related Deaths

Michigan’s opioid epidemic is no secret, and it is not just prescription pills that are contributing to the rise in overdoses. Opioids include prescription pain relievers such as oxycodone (Oxycontin), hydrocodone (Vicodin), codeine, morphine, fentanyl, methadone, and the illegal drug heroin. However, pain killers that are not prescribed or are used outside of the prescription are considered illegal. Furthermore, pain killers such as fentanyl are being illegally manufactured and distributed at an increasing rate. As the first chart below shows, the number of overdose deaths for all opioids has increased since 2000, but synthetic opioid overdose deaths have risen the most over the last several years, according to data from the Michigan Department of Health and Human Services.

In 2000 there were 17 synthetic opioid overdose deaths (not including methadone) in the State of Michigan. Comparably there were 60 prescription opioid overdose deaths in Michigan in 2000 and 89 heroin overdose deaths. In 2021 there were 2,287 synthetic opioid overdose deaths, 512 prescription opioid overdose deaths and 145 heroin overdose deaths. In Michigan, synthetic opioid overdose deaths increased the most between 2014 and 2015 and 2019 and 2020. Between 2014 and 2015 synthetic opioid overdose deaths increased by 465 deaths, from 175 overdose deaths to 465 overdose deaths. Between 2019 and 2020 opioid overdose deaths increased by 466, from 1,445 to 1,911. Although heroin and prescription overdose deaths have also increased since 2000, the number of overdose deaths for both categories have not grown by the amounts that synthetic opioid overdoses have, nor have they reached (individually) as high an overdose death number as synthetic opioid overdose deaths.

The yellow line in the chart represents the total number of opioid overdose deaths between 2000 and 2021, as reported by the Michigan Department of Health and Human Services. The yellow line often falls below the total number of opioid overdose deaths calculated when combining prescription and synthetic opioids and heroin. According to the Michigan Department of Health and Human Services, the summing of categories will not always result in more than the number of all opioid drug overdoses and the categories of death are not exclusive as deaths might involve more than one drug.

It is also important to note that prescription overdoses includes both prescription opioid pain relievers (e.g., hydrocodone, oxycodone, and morphine) and opioids used to treat addiction (e.g., methadone)

The first chart shows the sheer number of opioid overdose deaths by category, and the chart below shows the rate of opioid overdoses by category, again highlighting the increase in synthetic opioid overdoses. The rates below are calculated per 100,000 people. Prescription opioids regularly had the highest overdose mortality rate up until 2015. In 2015 the overdose mortality rate for prescription opioids was 4.5 overdoses per 100,000 people and for synthetic opioids the rate was 4.7. From there, the overdose rate for synthetic opioids grew to a rate of 23.9 overdose deaths per 100,000 in 2021. Prescription opioid overdose rates and heroin overdose rates also grew for a few years beyond 2015, both peaking after then. The prescription opioid overdose rate peaked in 2016 at 7.7 and the heroin overdose rate peaked at a rate of 8.2 overdoses per 100,000 in 2017. Overdose rates for prescription opioid overdoses and heroin overdoses have decreased since then.

The data clearly shows opioid overdoses continue to increase in Michigan, and synthetic opioid (such as fentanyl) overdoses are playing a large role in that. An obvious question may be, why fentanyl? Well, fentanyl is a highly potent opioid that only requires people to ingest a tiny amount to overdose.

According to Rutgers University, in many areas, fentanyl has nearly completely replaced heroin and can be found in many counterfeit prescription opioid and benzodiazepine pills bought on the street. Methamphetamine and cocaine may also contain undeclared fentanyl.

As shown, Michigan is not immune to its population gaining access to this highly dangerous drug. And while it is still found on the streets, law enforcement agents are working to stop production and distribution. According to the US Department of Justice, more than 65 kilograms of fentanyl powder and 88,000 fentanyl laced pills were seized by federal agents during May 23 and Sept. 8, 2022. The USDOJ said this was enough to provide 4.7 million deadly dosages.

According to the USDOJ,  fentanyl is 50 times more potent than heroin. Just two milligrams of fentanyl, or the amount that could fit on the tip of a pencil, is considered a potentially lethal dose.

The risk of overdose remains high with opioid use, as do other negative consequences from using opioids. So, while law enforcement officials work to eliminate illegal production, distribution and use of opioids there are also organizations working to help those with an opioid addiction. As we have noted throughout this series, to end the opioid epidemic we need a multi-faceted approach and treating addiction is part of that approach. In our next post we will discuss these programs and their impacts.

Rate of Alcohol-Induced Deaths Increasing in Southeast Michigan; White Males Have Highest Rates

Statewide, across genders and across racial groups, the rate of alcohol-induced deaths is increasing, according to the Michigan Department of Health and Human Services. This trend is also true for majority of the counties in Southeast Michigan, with the exception of two. Why alcohol-induced deaths are increasing remains unknown, but the data does show that Michigan men had higher rates of alcohol-induced death than women, and White Michiganders have had higher alcohol-induced death rates over the last decade, as compared to their Black counterparts.

Digging further into the data, we know that the rate of alcohol-induced deaths for men in Michigan in 2000 was 10.6 deaths per 100,000 people; by 2021 that increased to 21.7 deaths per 100,000 people. The largest increase for male alcohol-induced deaths took place between 2018 and 2021. Nationally, the New York Times sites a sharp increase in alcohol-related deaths for women. However, as data from the Michigan Department of Health and Human Service shows, while the trend has been steadily increasing since 2000 (rates increased from 3.3 per 100,000 people to 8.8 per 100,000 people), the males in Michigan have experienced the sharpest increase.

The trends amongst the White and Black populations in Michigan is not as straightforward. As noted, the White population in Michigan had the highest alcohol-induced death rate in 2021 at 15.5 deaths per 100,000 people. Since 2000 the alcohol-induced death rate amongst the White population in Michigan steadily increased from 6.3 alcohol-induced deaths per 100,000 people to 15.5. The alcohol-induced death for the Black population has not been as linear. Between 2000 and 2007 the alcohol-induced death rate decreased from 10.5 alcohol-induced deaths per 100,000 to 5.2. Then, between 2007 and 2018, there were both increases and decreases in the alcohol-induced death rates for the Black population, with the 2018 rate being reported at 6.6. Since 2018, the alcohol-induced death rate for the Black population increased from 6.6 to 14.4 in 2021.

Up until 2010, according to the data, Black males had the highest alcohol-induced death rate among Black males and females and White males and females. But, beginning in 2010 and through 2021, White men had the highest rate at 22.2 per 100,000 people in 2021. When examining the female population, it was often a trade-off from year-to-year whether it was the Black or White female population with the highest alcohol-induced death rate. In 2021, Black women had the highest rate at 9.4 deaths per 100,000 people.

When digging into the more local data, it is St. Clair County that regularly had the highest alcohol-induced death rate since at least 2007, despite Livingston County having the highest local rate in 2021. In 2021, the alcohol-induced death rate for Livingston County was 18.2 alcohol-induced deaths per 100,000 people. In 2018, Livingston County had an alcohol-induced death rate of 3.3 and by 2021 it had spiked to 18.2.

St. Clair County had the second-highest rate at 16.9. Wayne County, with Detroit data removed, had the lowest alcohol-induced death rate at 12; Detroit’s alcohol-induced death rate in 2021 was 13.3.

Despite St. Clair County regularly having the highest alcohol-induced death rate over the last decade, there was a decrease between 2020 and 2021. Monroe County also experienced a decrease in the alcohol-induced death rate between 2020 and 2021.

Overall, the trend of alcohol induced death rates increasing is evident. Exact reasons for it remain unknown, but publications touch on mental health, the pandemic and genetics as reasons. While trying to better understand the “why,” policies can also be put in place to help curb increasing rates. Some policy recommendations from the American Public Health Association include increasing alcohol taxes at the federal, state and local levels, limiting the number of stores that can sell alcohol in a community (and limiting clustering of such stores), lowering the Blood Alcohol Content level for drunk driving, increasing public awareness campaigns (similar to what has been done in the tobacco industry).  Strategies need to simultaneously occur at the individual-community-population level to ensure a holistic approach that is long-term and impactful.

Michigan’s Energy Consumption Declined in 2020

In 2020, Michigan’s primary energy consumption was 2,610.6 trillion British Thermal Units (BTU), the lowest it has been since 1984 when it was at 2,597.4 trillion. This total consumption number is based on all categories of energy, including (but not limited to) coal, petroleum, natural gas and renewable energy sources. Between 1984 and 1999 energy consumption in Michigan continued to regularly increase; in 1999 Michigan’s total energy consumption was 3,227.4 trillion BTU. Since then, Michigan’s energy consumption decreased to 2,610.6 trillion BTU in 2020. In 2020 Michigan ranked 10th in total energy consumption out of the 50 states and the District of Columbia (this includes residential, commercial, industrial and transportation).

The decrease can be linked to several factors including, Michigan’s population decrease, the commercial sector becoming more energy savvy, the implementation and use of Utility Waste Reduction Programs and an overall awareness on energy consumption and its environmental and financial impacts. 

However, while energy consumption is declining in Michigan, energy use is still a key factor in everyday life. The chart below highlights some of the key energy sources consumed in Michigan in 2020.

**The data provided in this post is from the to the U.S. Energy Information Administration (EIA) and can be found here.***

In the State of Michigan, petroleum is the most highly consumed form of energy, according EIA.  In 2020, 1,010.9 trillion (BTU)s of petroleum were consumed in the State of Michigan with natural gas being the second highest consumed energy source at 1,003.4 trillion BTUs. For context, , petroleum represents the use of motor gasoline, distillate fuel oil, residual fuel and jet fuel and natural gas is used for heating, electricity and industrial use. One of the largest energy sources produced in Michigan is natural gas.

Coal was the third largest type of energy consumed in Michigan in 2020 at 334.4 trillion BTUs. Although coal is the third largest type of energy consumed in Michigan, coal fired-power plants provide the largest share of the electricity generated in Michigan. However, Michigan has no active coal mines, most of the coal consumed in the state is brought in by rail from the west.

Renewable energy consumption in Michigan is not even half of the consumption of petroleum, natural gas or coal, but there are continuous strides to utilize it as a reliable energy source. Biomass, all together, was the largest consumed renewable energy source in Michigan at 157.7 trillion BTUs in 2020. Biomass includes organic matter such as wood or crop waste. Wind energy is the second largest consumed renewable energy source in Michigan at 59.1 trillion BTUs.

While petroleum has long been an energy source that has been heavily consumed in Michigan, there has been shifts in its consumption numbers, along with the consumption of other energy sources. The charts below show how energy source consumption habits have changed in Michigan between 2000 and 2020.
Some key takeaways include:

Petroleum: There has been an overall increase of usage since 2012, when it was reported that 787.2 trillion BTUs were consumed. Prior to 2012, use of petroleum remained steady between 2000 and 2005. Consumption then began to drop to the 2012 low point. This pattern of decline, then resurgence, is one that follows economic activity related to the Great Recession. We will likely see a decline in consumption for 2021, and even 2022, in reflection of the pandemic and its economic impacts.
Natural Gas: Consumption of natural gas hit a low point in 2009 at 750.8 trillion BTUs. Since then though, consumption steadily increased through 2019. In 2020 there was a slight decrease, with consumption dropping from 1,055 trillion BTUs in 2019 to 1,003.5 trillion BTUs in 2020.
Biomass: Consumption of biomass as an energy source steadily increased between 2002 and 2018. In 2002 81 trillion BTUs of biomass was consumed and by 2018 that number increased to 175.7 trillion BTUs. Since 2018 consumption has been slowly declining. A decrease in consumption of wood and waste and fuel ethanol were the largest contributors to that decline.
Geothermal: The consumption of geothermal as an energy source steadily increased from 2000 to 2011, (from 1.2 trillion BTUs to 5.1 trillion BTUs) and has since leveled off, with 5.2 trillion BTUs being consumed each year between 2012 and 2020.
Wind: Consumption of wind power energy in Michigan truly took off in 2009 and has only increased since then, with the 2020 consumption number being 59.1 trillion BTUs.
Solar and hydroelectric: Solar and hydroelectric are the lowest consumed renewable energy sources in Michigan. According to the EIA, 3.2 trillion BTUs of solar energy was consumed in Michigan in 2020; this is an increase from the 0.2 trillion BTUs consumed in 2000. This was also the highest amount consumed to date.
Consumption of hydroelectric energy has been erratic, with consumption of this energy source fairly consistently increasing since 2012.

While fossil fuels are still a large part of Michigan’s energy consumption, the data shows there is a shift, albeit somewhat slow, toward renewable energy. In 2008 Michigan enacted a renewable energy standard that required the state retail electricity providers, such as DTE, to generate at least 10 percent of their energy sources from renewable energy; that requirement increased to 12.5 percent to be met in both 2019 and 2020 and 15 percent in 2020.

Even with renewable energy policies in place, the data presented here indicates that carbon dioxide producing fossil fuels are likely to continue to dominate energy consumption for many decades. Policy makers must take stronger, more immediate approaches to address the dangers of climate change, which directly impacts our environment, economy and children.

Life Expectancy Declines in Michigan, US

The average life expectancy for Americans decreased in 2020, according to the National Center for Health Statistics, and the same goes for Michiganders.

According to the National Center for Health Statistics, which is run by the Centers for Disease Control, the average life expectancy of an American in 2019 was 79 years of age and by 2020 that decreased 77 years of age. In 2021, the National Center for Health Statistics reported the average life expectancy of an American decreased to 76 years of age. For Michigan, the Michigan Department of Community Health did not have data for 2021, but for 2020 the average life expectancy of males and females, both white and black, declined.

The first chart below shows that between 2019 and 2020 the life expectancy for females declined from 80.6 years of age to 79.2; for males the average life expectancy declined from 75.7 years of age to 73.6. Prior to the reported 2022 average life expectancy ages, the last times they were as low was in 2002 for females (79 years of age) and 1999 for males (73.4 years of age).

According to the Centers for Disease Control, the top 10 contributing factors to death for those who live in Michigan in 2020 were:

•Heart Disease (117,087 deaths)

•Cancer (21,118)

•COVID-19 (11,362)

•Accidents (6,044)

•Stroke (5,873)

•Chronic Lower Respiratory Disease (5,644)

•Alzheimer’s Disease (4,860)

•Diabetes (3,408)

•Kidney Disease (1,940)

•And Influenza, Pneumonia (1,880)

While we know the leading causes of death, it is believed by the CDC that the pandemic likely drove the recent decline in the average life expectancy for Americans, across the board. In Michigan, COVID-19 itself attributed to 11,362 deaths in 2020. We also know that the number of deaths related to heart disease, accidents, influenza/pneumonia, kidney disease, diabetes and stroke increased between 2019 and 2020, as did the drug overdose rates.

So, while the numbers above help frame the story as to why Michigan’s average life expectancy is decreasing, digging into the data another way also tells another story.

The Michigan Department of Community Health publicly presents data on the average life expectancy broken down by both sex and race. As shown above, overall, females have long had a higher life expectancy over males. However, when further breaking down the data, we see that black females and white males in Michigan have had nearly the same life expectancy since 1910. In 2020, the average life expectancy for black females in Michigan was 73.3 years of age, a decrease of 3.3 years from 2019. The average life expectancy of white men in Michigan was 75.3 years of age in 2020, a decrease of 1.3 years from 2019. White females in Michigan experienced a 0.9 decrease in average life expectancy, which was the smallest decrease of the four groups. It was black males who had the largest decrease in life expectancy between 2019 and 2020 in Michigan at 4.8 years; in 2020 the average life expectancy for black males in Michigan was reported at 64.9 years of age. The last time the average life expectancy for black males was that low, or lower, was in 1995 when it was reported to be 64.4 years of age.

According to the Michigan Department of Community Health, the top leading causes of death for black males in Michigan in 2020 were:

•Heart Disease (2,430 deaths)

•COVID-19 (1,610)

•Malignant neoplasms (1,272)

•Accidents (799)

•Assault ( 512)

Note that assault is not even among the overall the top 10 causes for Michigan citizens overall.

While we mentioned the effect COVID-19 has had on life expectancy, as well as drug overdoses and the increase mortality rates related to other diseases, it should also be noted that number of individuals with access to health care has increased in recent years. So, as the average life expectancy is decreasing, more individuals are receiving greater access to health care, an odd result, but probably the effect of COVID has overtaken the benefits of better care.

Overall, decline in life expectancy for all sexes and races is concerning as it means people are dying earlier than they should be.

Inflation Puts Strain on Food Banks, Families in Southeastern Michigan

Rising inflation is hitting people all over the metropolitan area. For example, food banks are experiencing increased use, according to local media outlets. In the Metro-Detroit area major food banks include Gleaners Community Bank and Forgotten Harvest; these organizations not only supply food to those in need via their mobile food pantries and sponsored distribution events; they also provide food to soup kitchens, other organizations’ food pantries and other programs. According to MichiganRadio.org, in March of 2022 Gleaners Community Food Bank had about 13,000 visits to its mobile food pantries; the average number of visits in the six months prior to that was about 9,000. Feeding America West Michigan experienced a 34 percent increase in visits between February and March of 2022, according to the April 2022 Michigan Radio. A recent Model D article states that the Capuchin Soup Kitchen experienced a 25 percent increase in visits in the last year. Additionally, the same Model D Media article reports that Forgotten Harvest recorded a 30 percent increase month-to-month between April, May and June of this year. According to the article, Forgotten Harvest served 16,000 individuals in the month of June— 10,400 more than in the same month last year.

The charts below show just what inflation means to the average person. For example, in the first chart below, according to the Bureau of Labor Statistics,  the cost of meat, poultry, fish and eggs has increased by 8.4 percent in the Metro-Detroit area between July of 2021 and July of 2022. Dairy has increased by about 20 percent in that time frame and cereal and bakery goods have increased by about 19.3 percent. As we know, not only are food prices increasing but so is the cost of housing, utilities and gas. Gasoline has experienced the largest consumer price index increase in the last year at 63.9 percent.

Another way to view inflation is to understand how the value of a dollar, or $100, has changed. The chart below uses $100 in June of 2000 as a reference point to show inflation over the last 22 years. So, for example, $171.46 today would be the same as $100 in June of 2000. In other words, the purchasing power of the dollar has continually decreased, except between 2008 and 2009. Between 2020 and 2022 the purchasing power of the dollar has had the largest decrease since 2000. Between 2020 and 2022 there was a $21.52 difference in the power of the dollar. What you could buy for $149.74 in 2020 increased to $171.46. And again, these dollar figures are comparable to what $100 would be worth in 2000.

The data and anecdotal stories show just how inflation, coupled with supply chain issues, are impacting families throughout Michigan, Metro-Detroit and beyond. Seeing the writing on the wall, the Food Bank Council of Michigan received a $50 million one-time allocation in the 2022-23 State Budget to support ensuring families across Michigan could access food. These funds will increase infrastructure to better serve Michigan’s northern counties and Upper Peninsula through decreasing transportation expenses. The funding will also be used to conduct a Hunger Study, providing data to align federal, state and commodity programs to meet residents’ needs. According to the Food Bank Council, it is paying 40 percent more to keep up with food pantry demands across the state.
Additional allocations to food banks will certainly help with the increased use in food pantries, but the State Budget funding was a one-time allocation and the duration of the increased use in food pantries is unknown. The state, and federal government, though are working toward food security through other avenues as well. For example, about 1.3 million people from about 700,000 households in Michigan receive federal Supplemental Nutrition Assistance Program (SNAP) benefits through the state’s Food Assistance Program. Since the COVID pandemic began, all household have received the maximum benefits allowed for their size, and this practice continues. Following the May 2021 SNAP benefit amount increase, households of the following sizes are receiving the corresponding max benefit amount:

·One Person: $250  
·Two Persons: $459  
·Three Persons: $658  
·Four Persons: $835  
·Five Persons: $992  
·Six Persons: $1,190  
·Seven Persons: $1,316  
·Eight Persons: $1,504  
In August, households receiving SNAP benefits had an additional $95 added to their Bridge card to help further combat the affect inflation is having on food costs. How long this will last is unknown as federal approval of the increased SNAP benefits is necessary every month.
Schools are also working to create greater food security for students but either adopting a universal free lunch policy for all students, or at least sending free and reduced lunch applications to all households in the district. According to the Kids Count Data Center, 715,000 of Michigan public K-12 students qualified for free or reduced lunches’ income bracket in 2021. During that time though, all students—nationwide—received free lunches as part of a federal program implemented in the height of the COVID pandemic. This school year though, that policy does not exist and Michigan does not have a universal school lunch policy. Detroit Public Schools implemented one though, as have some others throughout the story. For the many districts that do not have such a policy, free and reduced lunch applications are being sent to all homes so eligible students can receive the service. For reduced meals, breakfast is $0.30 and lunch is $0.40. Income eligibility information can be found here.

We know that food banks are meeting, and serving, just some of the thousands upon thousands of individuals being impacted by the affects of inflation. However, long-term assistance to such food banks remains unknown, as direct long-term funding from state entities isn’t certain, and with economic concerns growing, donations may decrease. Food pantries serve a vital role in our community, as do programs such as SNAP and the Free and Reduced School Lunch Program. Food insecurity is an issue hundreds of thousands Americans face daily and long-term strategies to create food security need stronger framework and better funding.

To find a food bank in Michigan click here.

Park Land is Plentiful in Southeastern Michigan

In Southeastern Michigan there are more than 2,300 parks which are owned and operated by either the federal government, State of Michigan, a local municipality, the Huron Clinton Metroparks Authority or a private entity. The footprint of these parks covers more than 214,000 acres and much of these parks are concentrated in the more heavily populated areas of Southeastern Michigan, such as Wayne, Oakland and Macomb counties. For example, in the City of Detroit there are 359 total parks, which range in size, type (passive, active, trails, etc.) and ownership (city, state, private).  Parks are viewed as an essential service because they increase economic value, provide health and environmental benefits and create an aspect of community, allowing for greater socialization. Furthermore, understanding how accessible parks and recreation amenities are can help communities prioritize improvements that serve more people.

In Southeastern Michigan 1,847 of the parks in the region, or 80 percent, are owned and operated by local municipalities. For example, of the 359 parks in Detroit about 350 are owned and operated by the City itself, the others are owned and operated by the Michigan Department of Natural Resources or private entities. Private entities in the region own and operate the second highest number of parks in the region, followed by counties. The way in which counties prioritize parks in the region varies greatly. For example, in Macomb County there are only two county parks—Freedom Hill, which serves as an entertainment center, and the Macomb Orchard Trail, which is a 26 mile long multiuse path that is overseen by a board comprised of a county representative and one person from each community that also pays into the system. In Oakland County there are 13 parks and in Washtenaw County there are well over 20 different parks, many of which are nature preserves.

Public parks are largely funded by public monies and each municipality’s priorities are reflected in how their dollars are spent. So, in the case of Washtenaw and Oakland counties, for example, we see that the counties themselves place a higher priority on access to parks. The emphasis on parks and recreation opportunities in communities can not only be seen by how the general fund dollars are allocated to such amenities, but also by if there are additional taxes voted on by residents to further increase parks and recreation amenities and access to them.

While funding allocations to parks differ from one county, and community, to the next, we do know that access to parks in the region is easily attainable for most. As noted, majority of the parks are concentrated in more heavily populated areas, but according to the Southeastern Michigan Council of Government’s (SEMCOG) 2019 Parks and Recreation Master Plan, parks and recreation opportunities are accessible within a 10-minute drive for nearly every household in the region. Additionally, according to the study, a 10-minute bike ride provides access to parks for 89 percent of households in the region. The study does show that for 42 percent of households in the region access to parks within 10 minutes of walking or use public transportation is not attaintable, posing a barrier of access to those who may not have a reliable use of their transportation. The lack of a strong public transportation system in the region does prove to be problematic for those who want/need reliable access to parks, especially the region’s largest parks. Since larger parks are located in less populated areas those without reliable transportation of their own, who may rely on public transportation, will have greater difficulty in reaching the larger parks. SEMCOG’s Access to Core Services report state that 7 percent of all households and 13 percent of transit-dependent households are within a 30-minute transit trip to a park greater than 200 acres in size.

The maps below highlight where parks are located in the region.

As noted, parks are viewed as an essential amenity within a community. However, funding to maintain and improve parks and recreation amenities is also vital to ensure such access. While we know majority of the region can access parks and recreation opportunities currently, we will further look into some of the funding structures that allow for such access in a later post and evaluate their long-term viability. We will also look deeper into the access of parks as it relates to the socioeconomic makeups of communities in Southeastern Michigan.