Broadband Not Accessible for All in Metro-Detroit

Even in the age of the internet, accessibility is limited for many, including in Southeastern Michigan.

According to the Southeastern Michigan Council of Governments (SEMCOG), there are about 1.6 billion homes in the seven county region with broadband and about 250,000 without it. In other words about 87 percent of homes in the region have internet and 13 percent are without it.

Access to broadband connectivity is two-fold though.

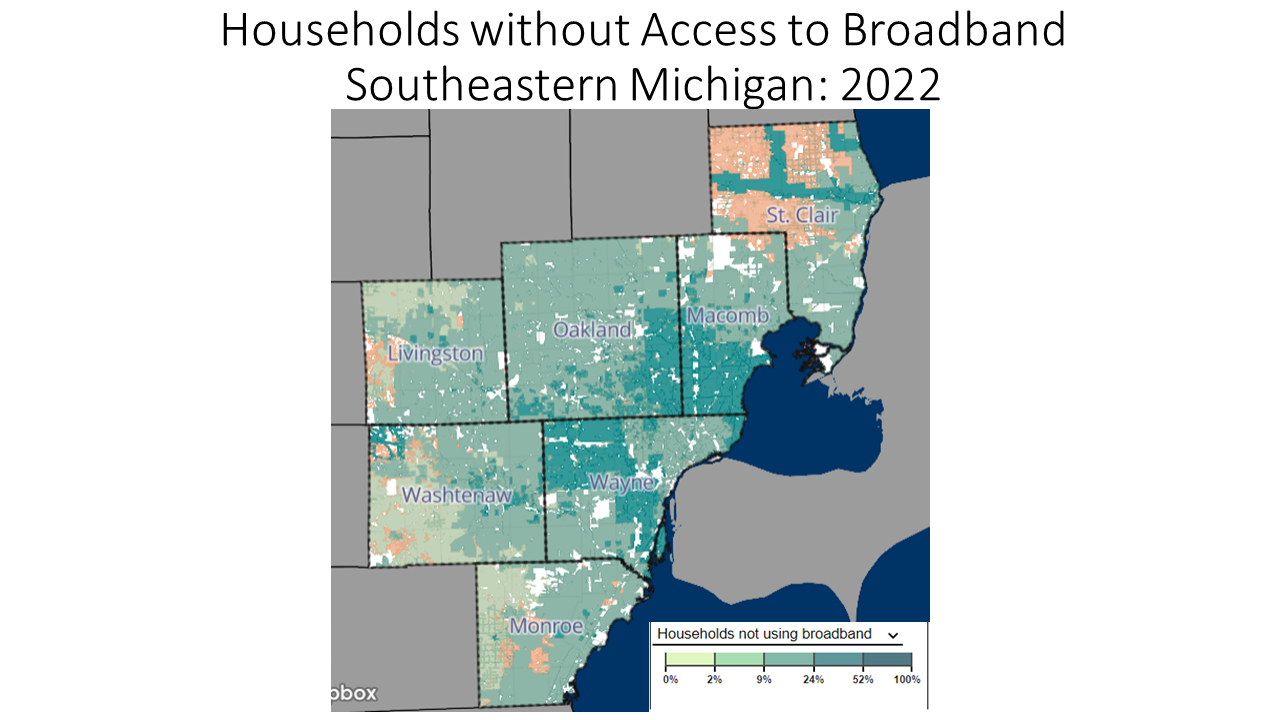
In a small percentage of the region there is no connectivity. In Southeastern Michigan, 99 percent of homes have access to broadband and 1 percent do not; this equals to out about 1.9 homes having access to broadband and about 10,000 not having access. The first map below highlights where any kind of access to the internet lacks. Each county in the region is affected, with very small neighborhoods in even some of the most populated areas (Detroit, Canton, West Bloomfield, etc.) experiencing some dead zones. However, the more rural areas in the region (north Macomb County, western Livingston and western Washtenaw counties) and several areas throughout St. Clair and Macomb counties) have much larger areas where access to broadband does not exist. While the land area where access is lacking looks large, the population that lives in these areas must also be considered. As noted, overall, there are about 10,000 people who do not have access to the internet due to service not existing where they live.

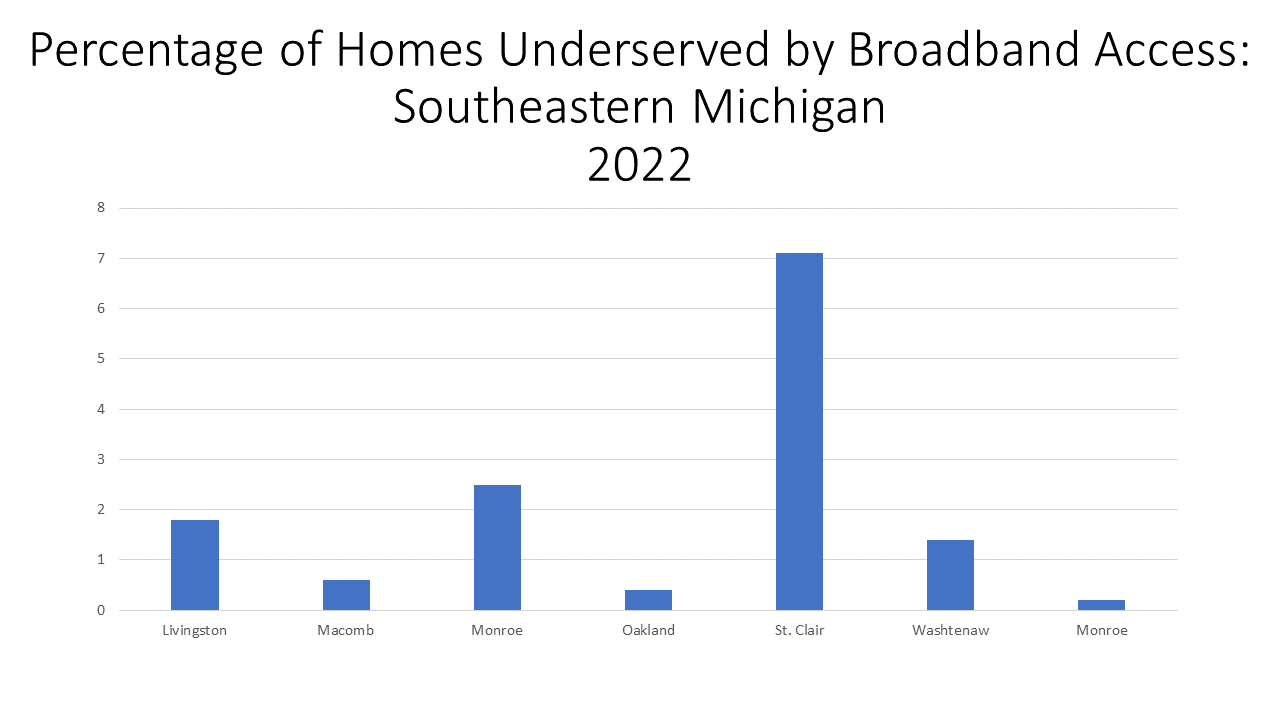
The first chart below highlights those who are underserved by broadband, which not only includes those who do not have access to broadband at all but also those who do not have access to highspeed internet (meaning they may have access to slower internet that does not allow for extensive streaming, downloading, etc.). St. Clair County has the highest percentage of homes that are underserved at  7.1 percent, followed by Monroe County where 2.5 percent of homes are underserved. Oakland County has the lowest percentage of homes that are underserved at 0.4 percent.

***All data in this post is provided by SEMCOG***

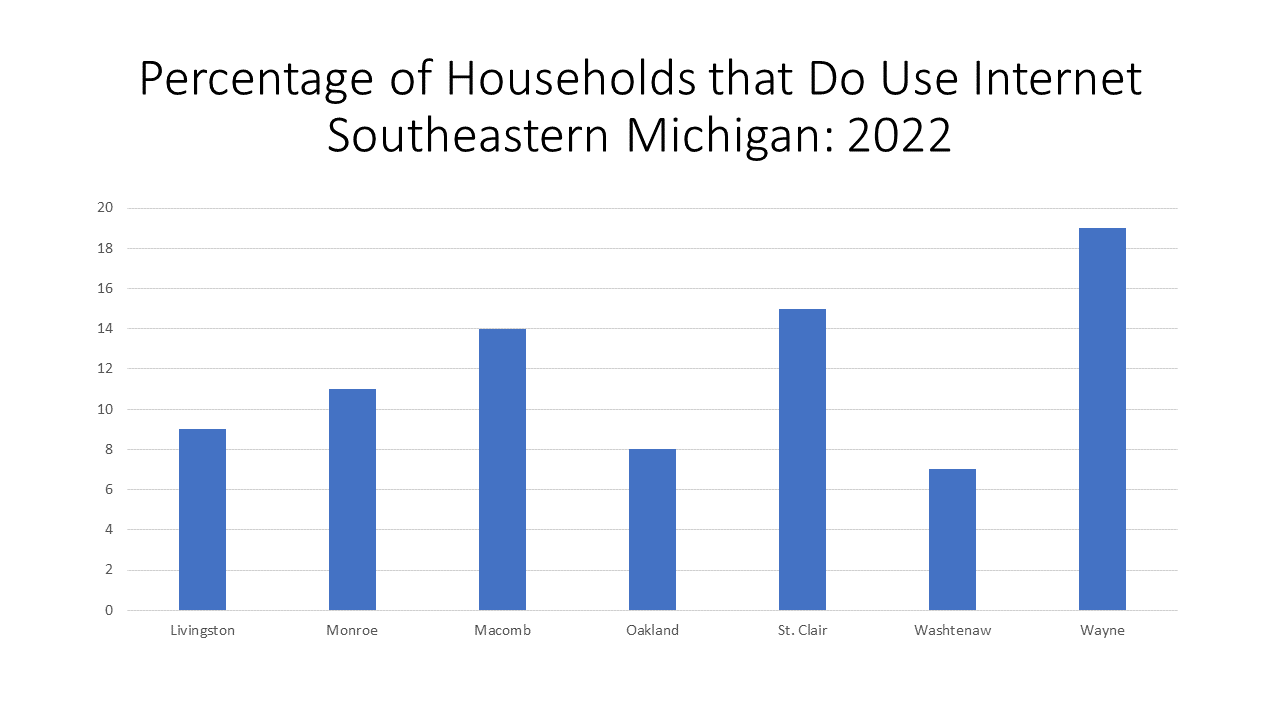
While the existence of broadband infrastructure is a concern, so is overall access, especially for those who have limited access to the infrastructure. The chart below shows the percentage of homes that do not use the internet. Wayne County has the highest percentage of homes that do not use the internet at 19 percent and, conversely, Washtenaw County has the lowest percentage of homes that do not use the internet at 7 percent.

Factors that play into a home being able to obtain broadband include income, age and race. For example, in Wayne County, 49 percent of households with an average income of $20,000 a year or less do not have the internet. This income bracket has the highest percentage of homes without internet across the region. When examining aging groups that data shows that 33 percent of the 65-years-of-age and older population does not have the internet; this is the age bracket with the highest percentage of individuals without access. And, finally, 13 percentage of the black population in Wayne County does not use the internet. Blacks have  the highest percentage of non-usage in Wayne County, and in every other county in the region.

Access to the internet is vital for many. This was fully demonstratated when COVID made remote work and school a necessity. As our society continues to evolve, access to this lifeline must become more accessibility to the population despite their location, income, race and age. As the data shows, race, income and age certainly play a factor in accessibility so breaking down those barriers must be a priority, as should developing stronger infrastructure in more rural areas. 

Locally, Washtenaw County has committed more than $13 million in American Rescue Act Funding to expand affordable and equitable high-speed broadband infrastructure to unserved and underserved communities. This is part of a larger investment by Washtenaw County which is focused on connecting every to high-speed broadband infrastructure.

Additionally, the City of Detroit is creating a test fiber-to-the-home connectivity project in Hope Village. This project will connect about 2,000 homes to affordable service. This project is also being funded by the American Rescue Act.

With millions of dollars dispersed to every county in American Rescue Act Funding, this should certainly become a priority for more places than just Washtenaw County.

Inflation Continues to Impact Standard of Living

Michigan’s unemployment continues to decrease, for the tenth straight month, and the labor force in the state continues to grow. This year is looking much rosier than in 2020 when great uncertainty riddled the state, and the country. With job recovery following the peak of the pandemic, and an increase in revenues from the sales and use tax and federal funding the state is predicting about a $5 million surplus. While such a surplus can viewed as a sign of improved economic times, we must also recognize inflation is on the rise, and uncertainty still looms with COVID and the war in Ukraine. Recognizing that inflation is hitting the homes of most, if not all, Gov. Gretchen Whitmer was proposed sending $500 to working Michigan families in attempt to help ease the strain on our pockets. The Republic led majority legislature is discussing a $2.5 billion plan that would cut taxes. What will happen remains unknown, especially as the project surplus is just an estimate.

But the data below does tell that story that Michigan’s economy is on the rise while the costs of goods and services is also on the rise.

Unemployment rates in Michigan and the City of Detroit remain lower than they were during the peak of the pandemic, and recent data shows a continued trend of them remaining fairly stable.

In March of 2022 the unemployment rate for the State of Michigan declined to 4.4 percent from the 5.3 percent it was reported at for February of 2022. In March of 2021 the unemployment rate was reported at 5.2 percent, which was only slightly higher than it was reported at a year later.

For the City of Detroit, the unemployment rate for March of 2022 was 10 percent, an decrease from the 12.2 percent it was reported at the month prior. When comparing it to the March of 2021 unemployment rate (9.3 percent) we see that the rate was slightly lower last year than this year.

As noted above, unemployment rates, typically, remain lower now than a year ago, and certainly two years ago. When examining the data at the county level for March 2022 and March 2021 we see that each county in Southeastern Michigan had a lower unemployment rate in 2022. Wayne County experienced the largest decline between 2021 and 2021; in March of 2021 Wayne County’s unemployment rate was 8.5 and by 2022 it declined to 5.8. Wayne County also had the highest unemployment rates in both March of 2021 and 2022.
The charts below show the percent changes in the Consumer Price Index (CPI) on a month-to-month basis and a year-to-year basis for each month in years 2019, 2020, 2021 and 2022 in the Midwest Region. The CPI is a measure that examines the weighted average of prices of consumer goods and services, such as transportation, food, energy, housing and medical care. It is calculated by taking price changes for each item in the predetermined group of goods and averaging them.

The first  chart below highlights how the CPI changed on a month-to-month basis between 2019 and 2022. Currently in 2021, the region’s prices were  up 0.8 percent in April, with higher prices for:
•Public transportation and shelter (up 0.2 percent)
•New vehicles  (up 1 percent)
•The increased price was partially offset by lower prices for used cars and trucks and apparel
•Overall, prices without considering food and energy prices, rose by 0.4 percent from the month prior.
The energy prices did not increase overall from the month prior due to a 1.3 percent decline in gasoline prices of 1.3 percent, but there was a 3.1 percent increase in the index for natural gas and a 0.5 percent increase for the energy index.

Overall food prices did increase between March and April though at 1.3 percent, with food prices at home increasing 1.5 percent and food away from home increasing at 1.1 percent.

When examining the second chart, which shows how prices changed on a year-to-year basis,  we see how prices continue to increase in 2022, with the April year-to-year CPI being the among highest increase shown below. In fact, all of 2022 CPI changes have been the highest reported in several years.
In April of 2022 the CPI was reported to be 8.2 percent above what it was the year prior. Contributing factors to the continued increase in the CPI include
•Food prices increasing 11.2 percent over the last year
•Energy prices increasing 26.8 percent over the last year.
•New and used motor vehicles increasing 18.4 percent
•Shelter increasing 4.9 percent
•And household furnishings and operations increasing 10.8 percent.
Just as inflation continues to increase, so does the price of homes in the Metro Detroit area. According to the Case-Shiller Home Price Index, the average price of single-family dwellings sold was $166,060 in February of 2022; this was $2,720 higher than the average family dwelling price in January. The February 2022 price was an increase of $21,210 from February of 2021 and $72,640 from February of 2014.