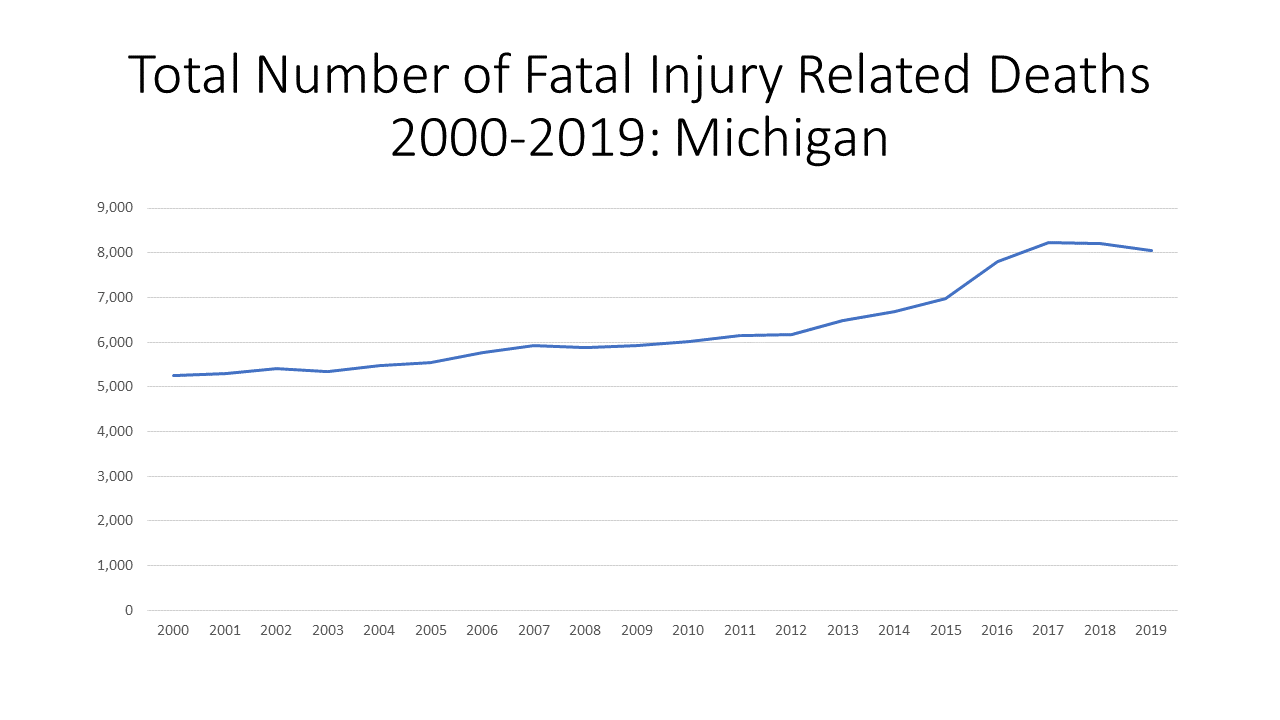
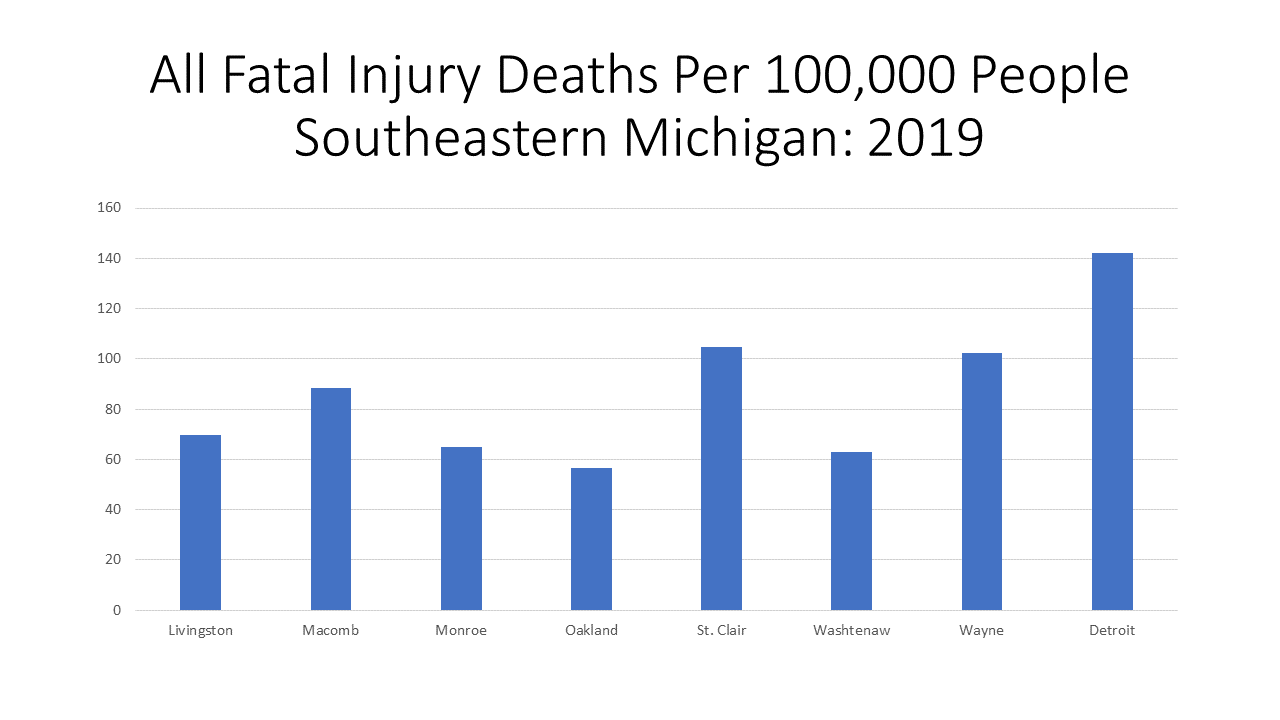
According to the Michigan Department of Health and Human Services, the total number of fatal injury related deaths have, generally, continued to increase since 2000. In 2000 there were 5,263 total fatal injury related deaths and in 2019 that number increased to 8,059. The number of fatal injury related deaths report in 2019 was a slight decrease from the total reported in 2017 and 2018, but overall the total numbers have increased by about 3,000 since 2000. When digging into the most recent data at the local level, the Michigan Department of Health and Human Services reported that the City of Detroit had the highest rate per 100,000 people of all fatal injury related deaths at 142.2; St. Clair County had the second highest rate at 104.9.
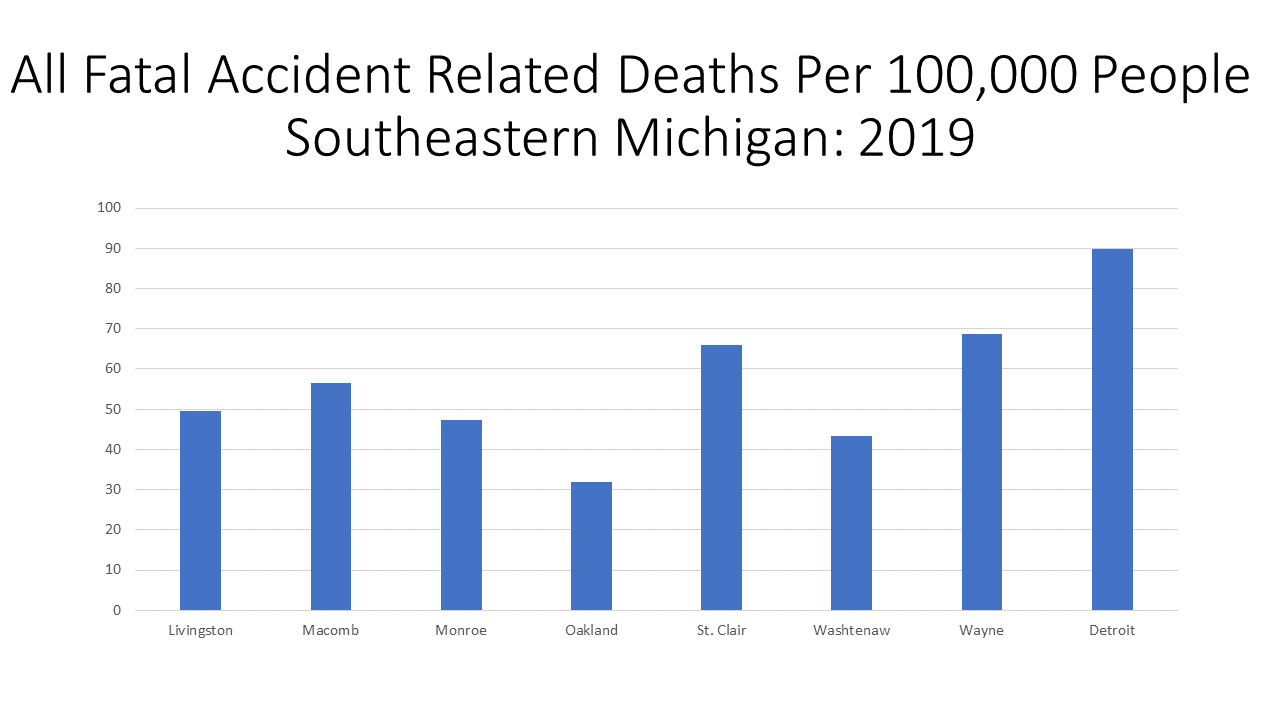
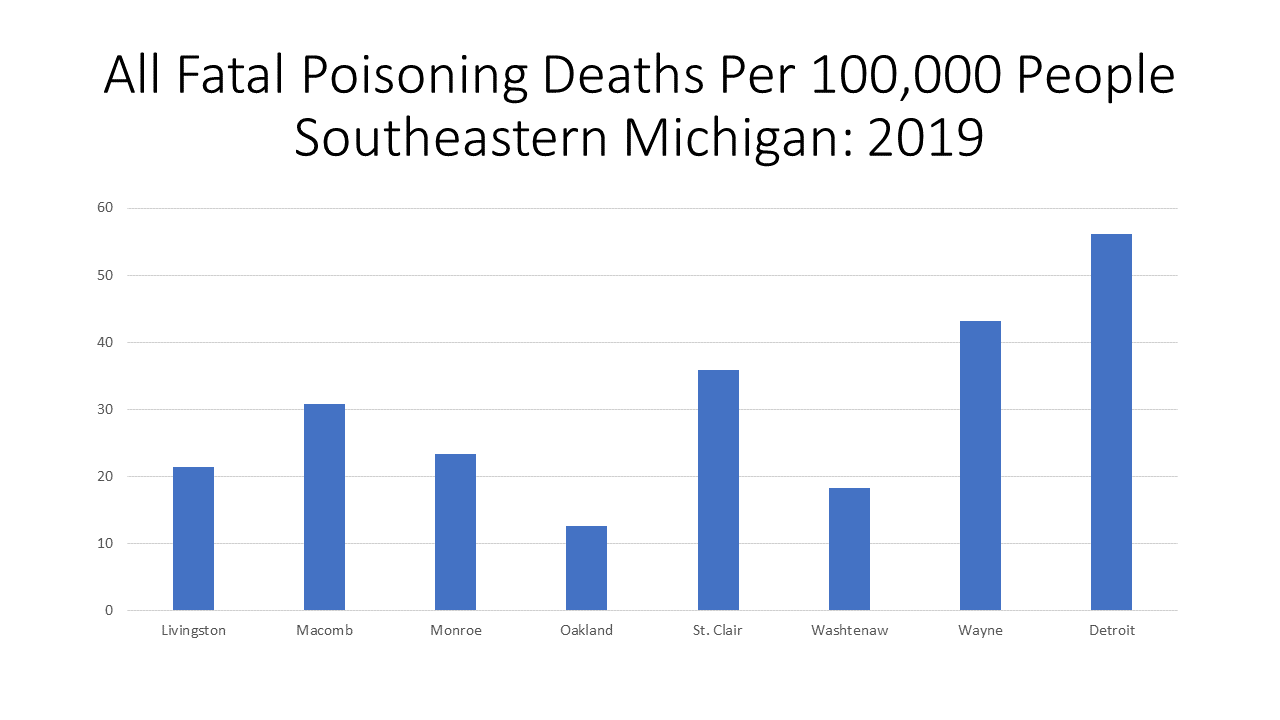
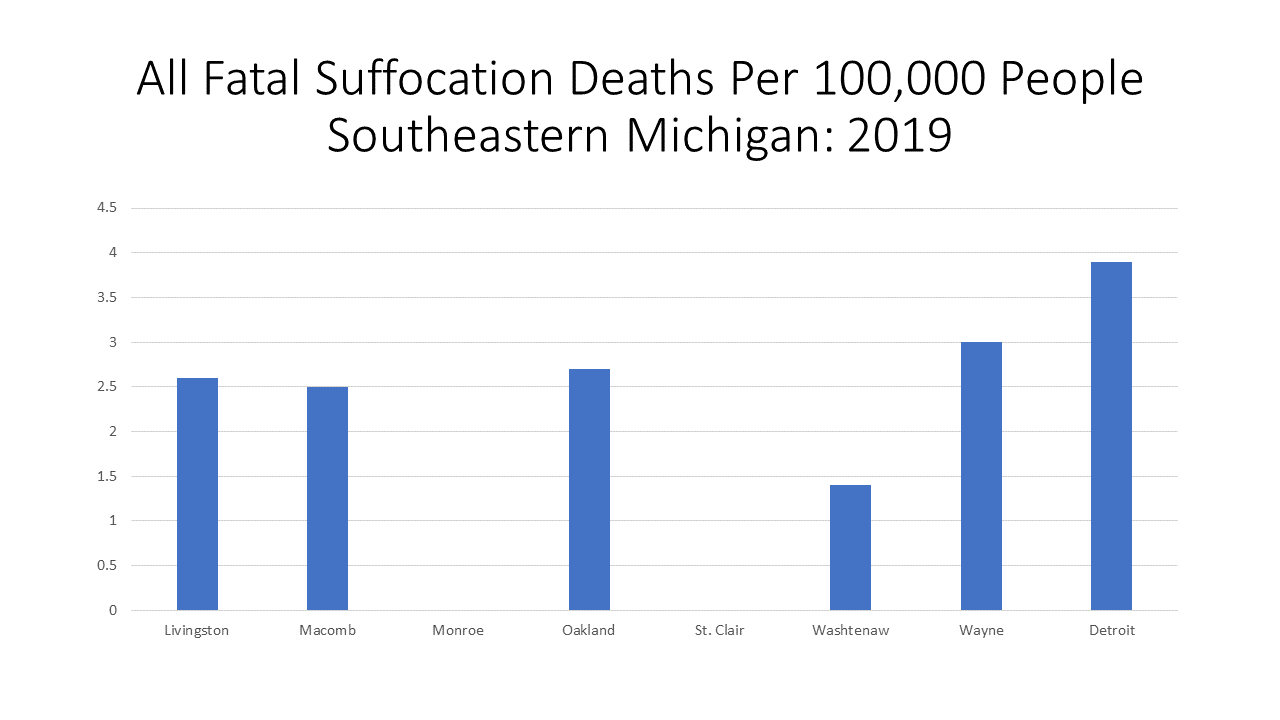
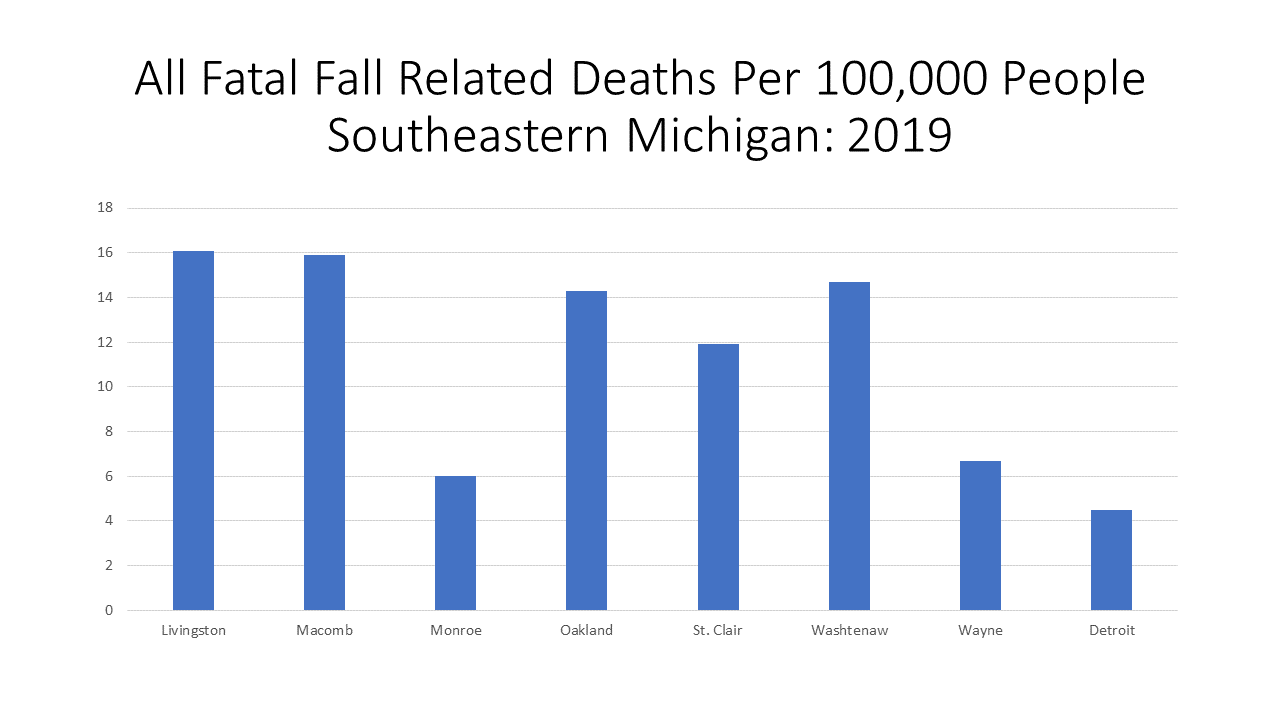
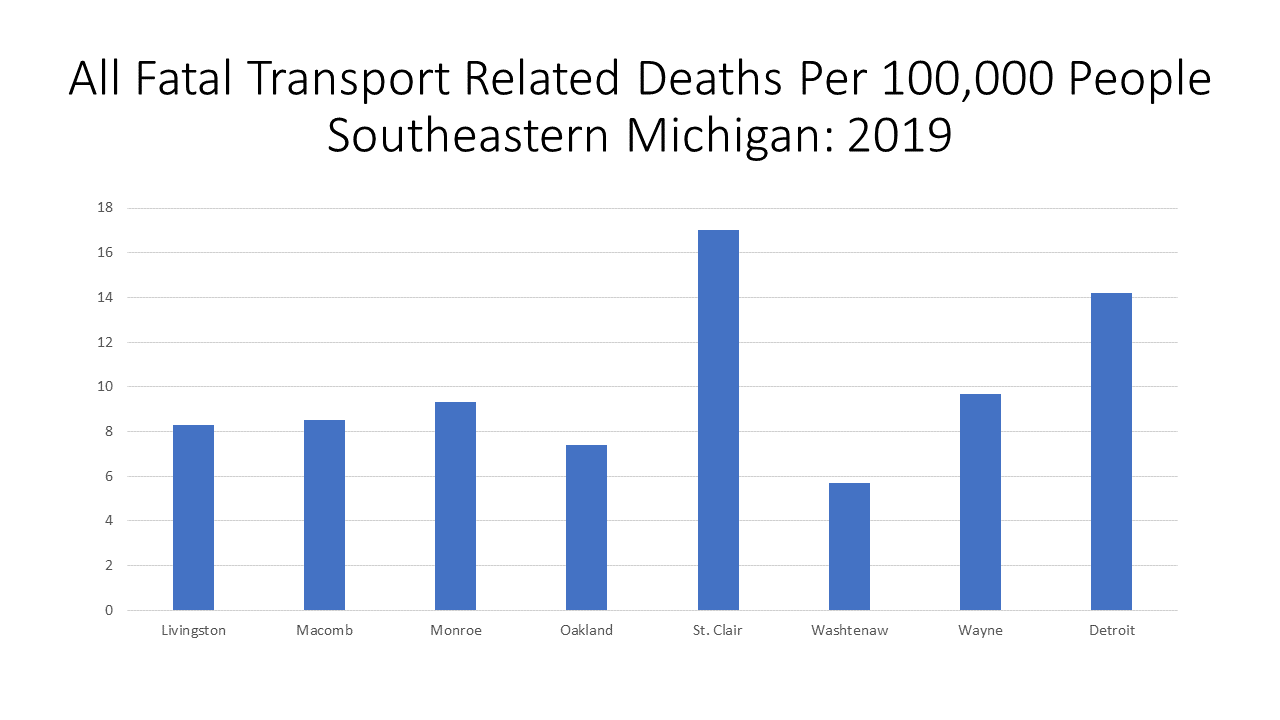
Fatal injury related deaths account for several different types of death, including general accidents, poisonings, suffocations, falls and injuries related to guns. Deaths from car crashes, slips, choking, drowning, machinery and other uncontrollable situations are deemed accidental. According to the data, Detroit had the highest rater per 100,000 people of all accident related deaths at 89.9 in 2019.Poisoning deaths are also considered a fatal injury related death and Detroit again had the highest rate per 100,000 people for this type of death at 56.2; Wayne County had the second highest rate at 43.1.Suffocation deaths had the lowest rates in the region, with Monroe and St. Clair counties not even reporting enough data for a rate to be determined. Detroit’s suffocation death rate was 3.9 per 100,000 people and Wayne County’s rate was 3. While Livingston County had amongst the lowest accidental death rates for the other types already discussed, it had the highest fatal fall related death rates in the region in 2019 at 16.1 deaths per 100,000 people followed by Macomb County with 15.9 deaths per 100,000 people.St. Clair County had the highest rate of fatal transport deaths at 17 per 100,000 people followed by Detroit at 14.2. A transport accident related death is any death that happens during road, rail, marine and/or air transport. These type of deaths can involve machines and pedestrians. Overall, aside from all accident related deaths, poisoning deaths had the highest rates in 2019 in Southeastern Michigan. Poisoning is one of the top three leading causes of preventable injury-related death. The other top two preventable injury-related deaths are falls and car accidents, which would be included in transport deaths.
Flooding in Southeastern Michigan continues to grow more common as weather patterns shift. In the summer of 2021 alone there have been at least three major flooding events, leaving hundreds of people with waterlogged basements, furniture and more. While the amount of rain certainly has an impact on the frequency of flooding, so does aging water infrastructure and various other household and neighborhood factors.
According to the June 2021 report “Household Flooding in Detroit” by Healthy Urban Waters, in partnership with the Wayne State Center for Urban Studies and others, 43 percent of 4,667 Detroit households surveyed between 2012-2020 reported household flooding. Furthermore, in an online Detroit Office of Sustainability survey published in 2018, 13 percent of those survey reported they experienced flooding very often; 23 percent reported they experienced flooding somewhat often and 32 percent reported they experienced it occasionally. Additionally, a cross-sectional study published in 2016 of 164 homes in Detroit’s Warrendale neighborhood indicated that 64 percent of homes experienced at least one flooding event in during that, with many experiencing three or four events, according to the report.
While we have the data on Detroit flooding, recent anecdotal tales tell us how cities throughout Southeastern Michigan—the Grosse Pointes, Dearborn and more—also continue to be affected by the surge of rain during storm events. Old infrastructure certainly impacts how a rain event affects a community, but so do other factors, such as the age of a home and if it is a rental versus being an owner-occupied unit.
According to the “Household Flooding in Detroit” study, Detroit renters were 1.7 times more likely to report household flooding than homeowners. In a different study, the 2021 Detroit Citizen Survey, individuals were provided a list of home problems and asked to identify which ones apply to their house or apartment. There were 570 respondents to this question and of those a total of 1,111 problems were recorded; four of the five top problems (mentioned by 83% of householders) concerned water in the home (from plumbing to flooding).
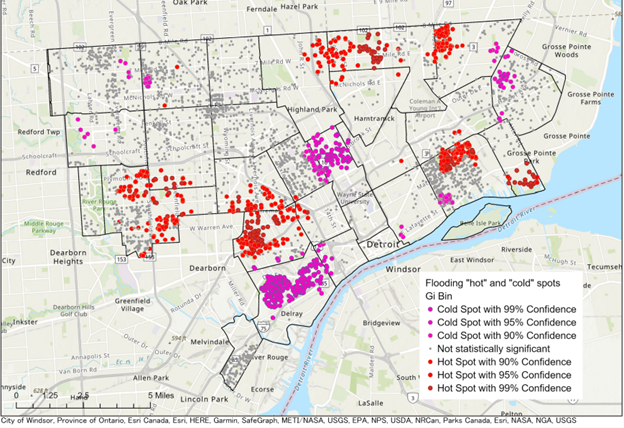
The first map above shows the hot and cold spots of flooding in Detroit using the Getis-Ord Gi* statistic. Red dots represent “hot” spots of statistically significant clusters of homes that have experienced flooding. Purple dots represent clusters of homes that have not report flooding. The map reflects responses from a sample of 4,667 Detroit households who participated in the Center for Urban Studies’ Home Safety Assessment survey between 2012 and 2020. Among these households, 2,546 (42.75%) reported household flooding. As shown in the first map, the “hot” spots for household flooding in the City are located in clusters in the north end of the City, in the Jefferson Chalmers area near the river and Grosse Pointe Park, the East Village/Indian Village areas and in the Warrendale/Rosedale Park/Michigan Marin areas. Also note, some of these “hot” spot flooding areas in Detroit border other areas that have experienced flooding during recent rain storms, such as Dearborn and Grosse Pointe Park.
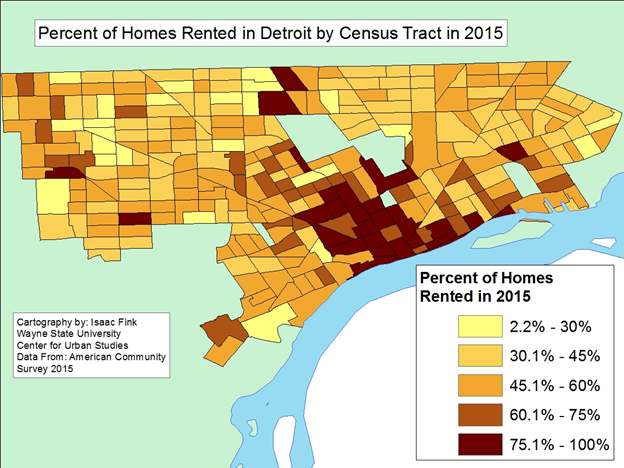
The second map shows 2015 data of the percent of renters, by Census tract, in Detroit. Those Census tracts with “hot” flooding spots also have at least 30 percent of the population renting and data shows that neighborhoods with a larger proportion of renters (compared to owners) and homes built before 1939 are more likely to experience household flooding. According to the Census Bureau, about 33 percent of the City’s housing stock was built before 1939.
The flooding study also found that primarily Black communities were found to be at high risk for household flooding; according to the Census Bureau, 78 percent of Detroit’s population is Black.
So, while we know that flooding affects some communities in Southeastern Michigan more than others and that the risk for the region will only increase as the effects of climate change grow, there actions that can be taken to mitigate flood damage. Updating water and sewer infrastructure to increase its reliability is a high, yet expensive, priority to help decrease the risk of in-home flood events for communities at-large. Investment in green infrastructure, such as rain gardens, is another option as is identifying parts of communities most prone to flooding and further investigating the specifics behind it. But again, these require time and money and municipalities regularly struggle to maintain their infrastructure, let alone allow for major upgrades.
Infrastructure investment is necessary, but so are larger actions to help slow the affects of climate change.
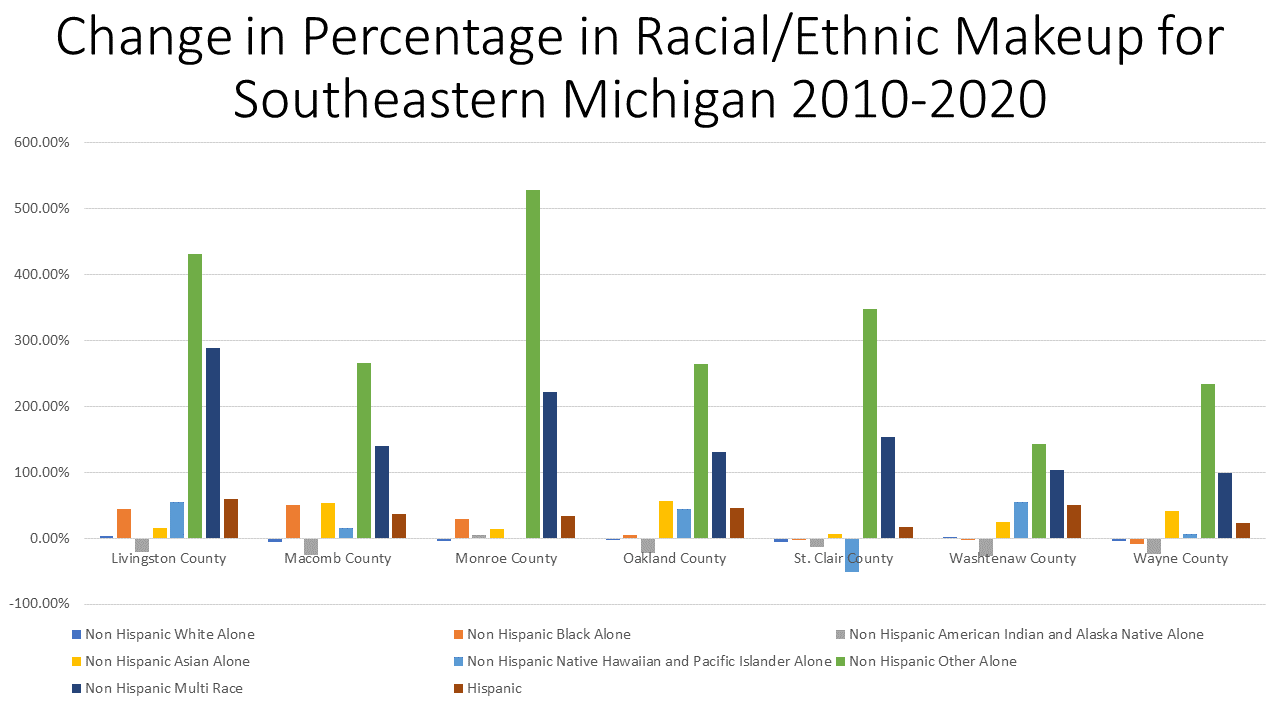
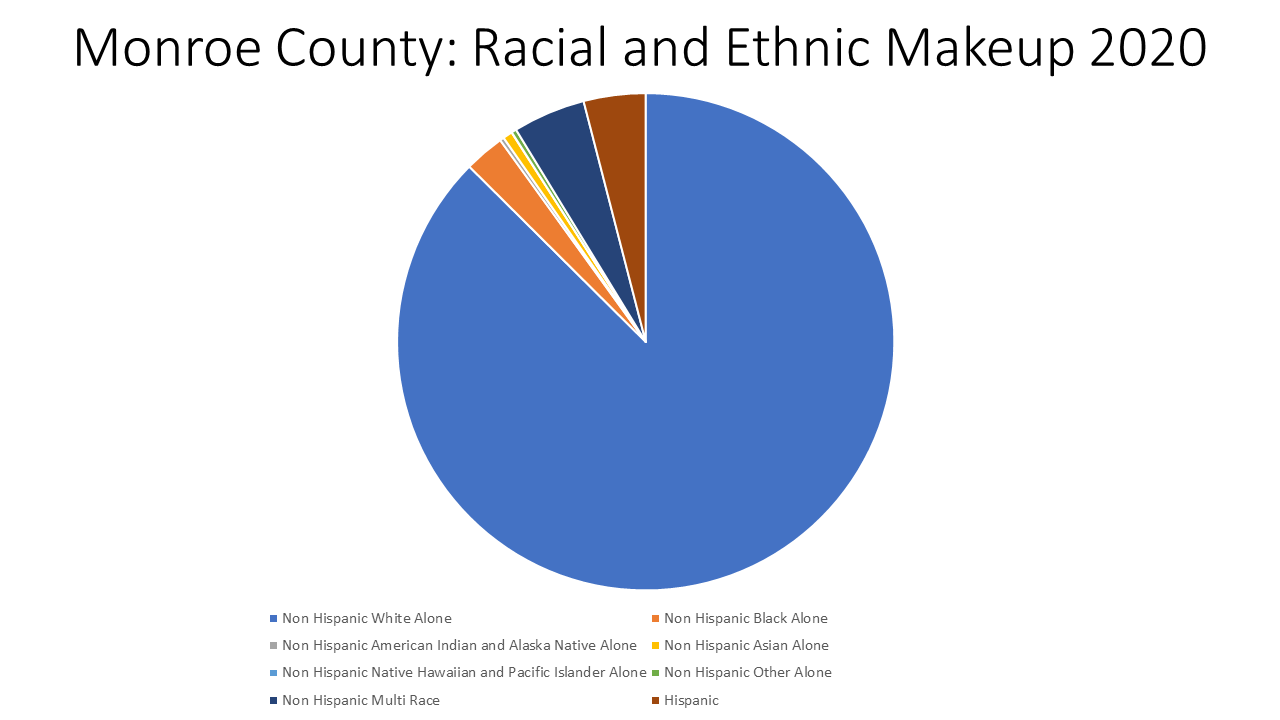
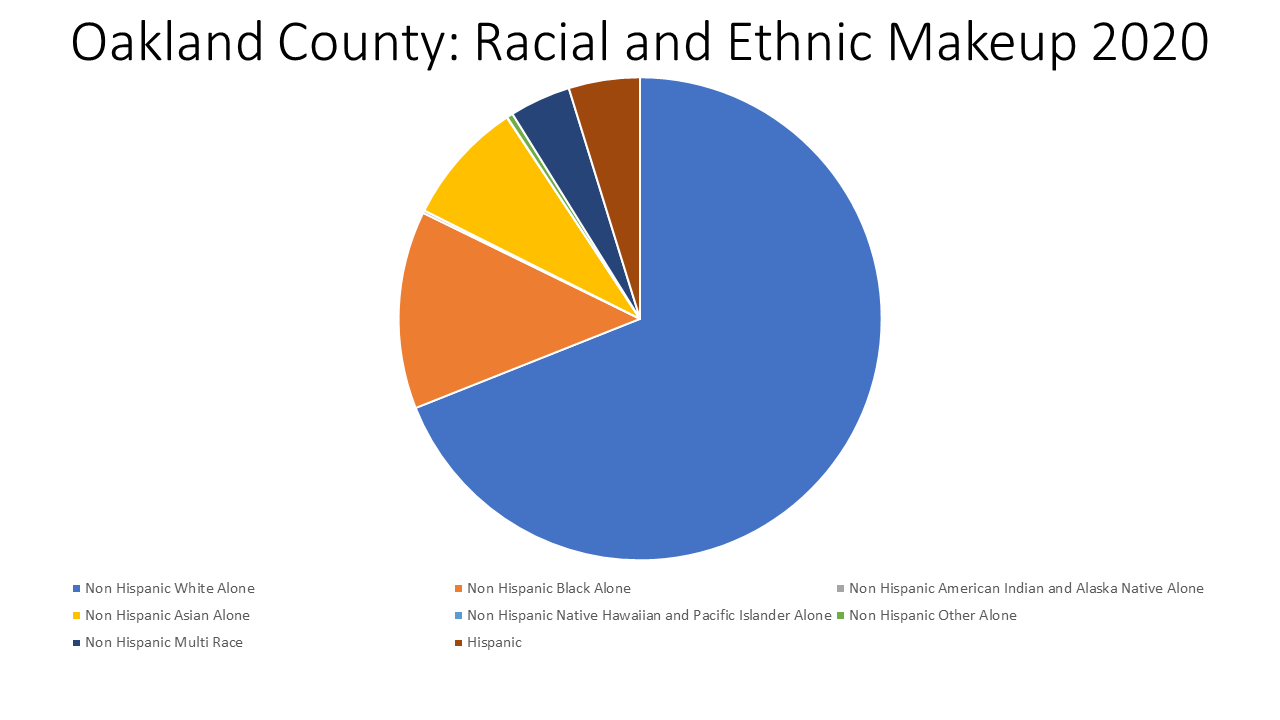
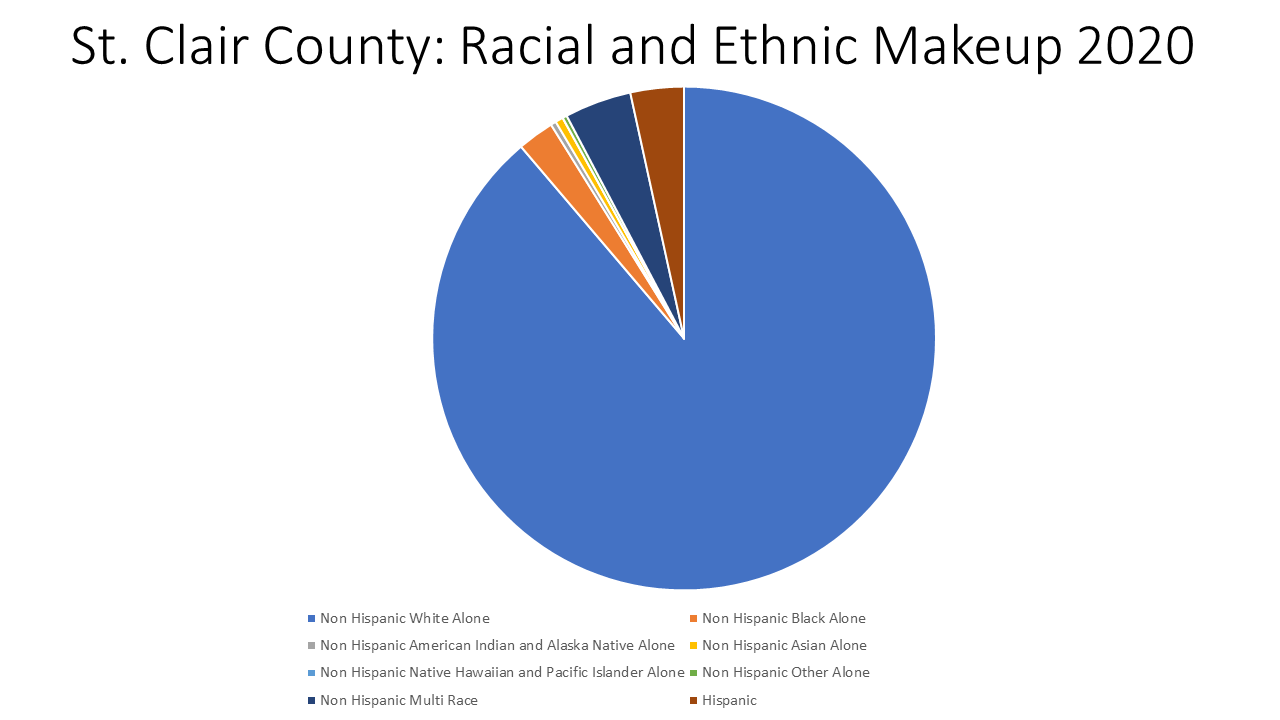
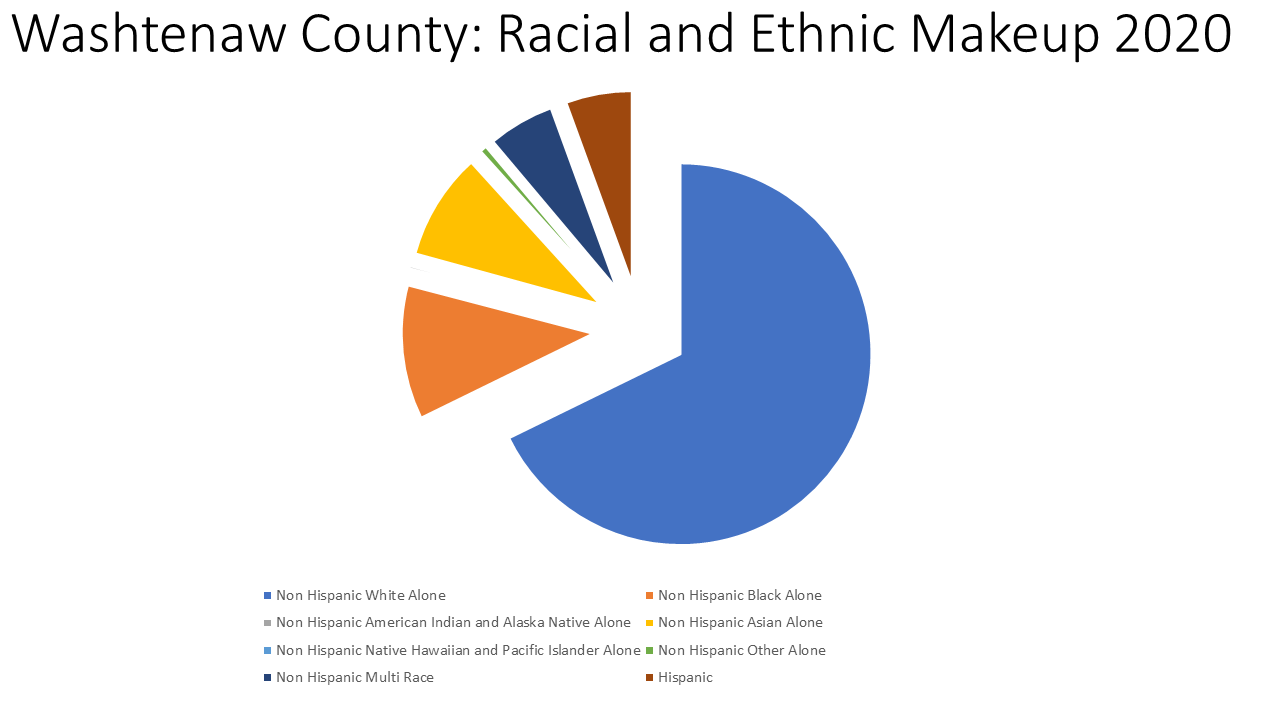
Preliminary data from the 2020 Decennial Census was recently released, including population and race and ethnicity data. Below we explore the racial makeup of each county in Southeastern Michigan according to the 2020 Census and how those numbers changed between 2010 and 2020. Overall, the charts below show that the Non-Hispanic white population makes up the highest percentage of each county’s population in the region. However, five of the seven counties lost a percentage of that population (Washtenaw and Livingston counties gained) yet gained other racial and ethnic populations.
Overall, Monroe County had the highest percentage of a certain population gain between 2010 and 2020 for any racial or ethnic background at 528 percent for the “Non-Hispanic Other” designation by the 2020 Census. This racial/ethnic group also had the highest percentage gain for each county in the region. Other data points to note are how St. Clair, Washtenaw and Wayne counties all lost a percentage of their black populations while the other four counties in the region (Livingston, Macomb, Monroe and Oakland counties) all gained a percentage of that population between 2010 and 2020. Macomb County had the highest percentage increase in its black population between 2010 and 2020 percent at 50 percent, followed by Livingston County with a 44 percent increase and Monroe County with a 28 percent increase.
Another racial group each county in Southeastern Michigan gained was the Asian population between 2010 and 2020. Oakland County gained the highest percentage at 56 percent, followed by Macomb County which experienced a 53 percent increase in its Asian population between 2010 and 2020, according to the 2020 Census.
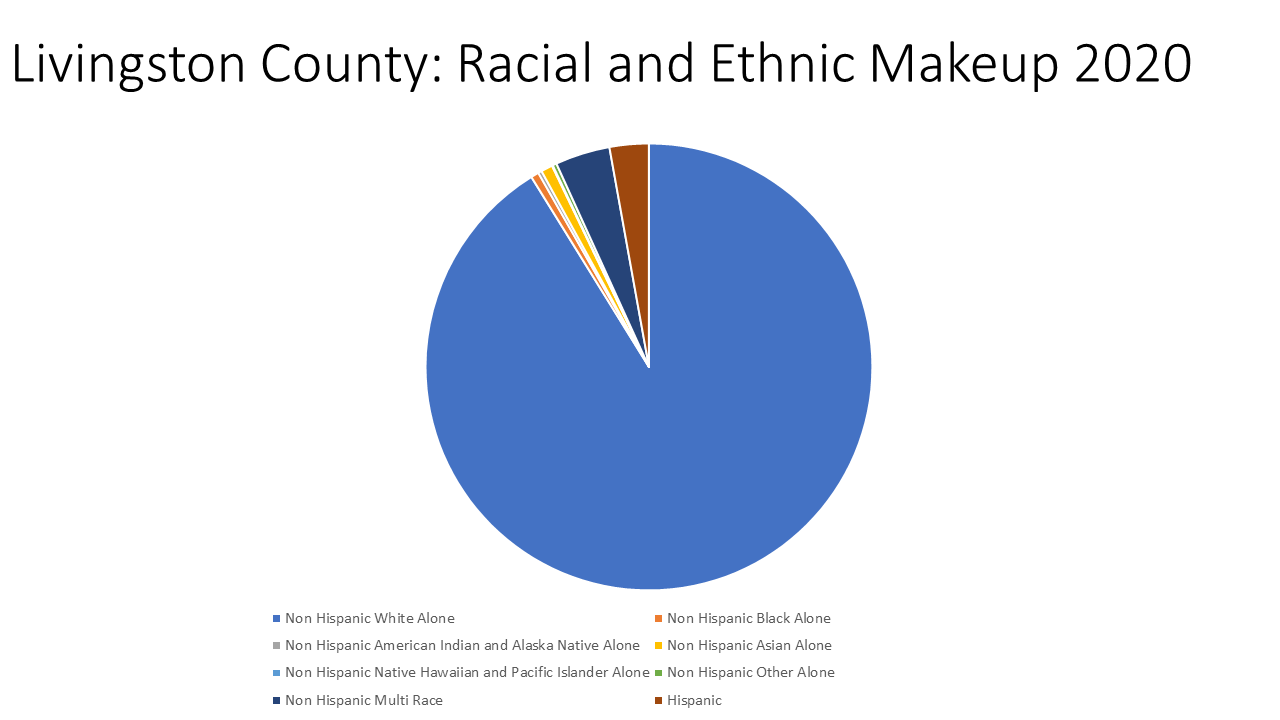
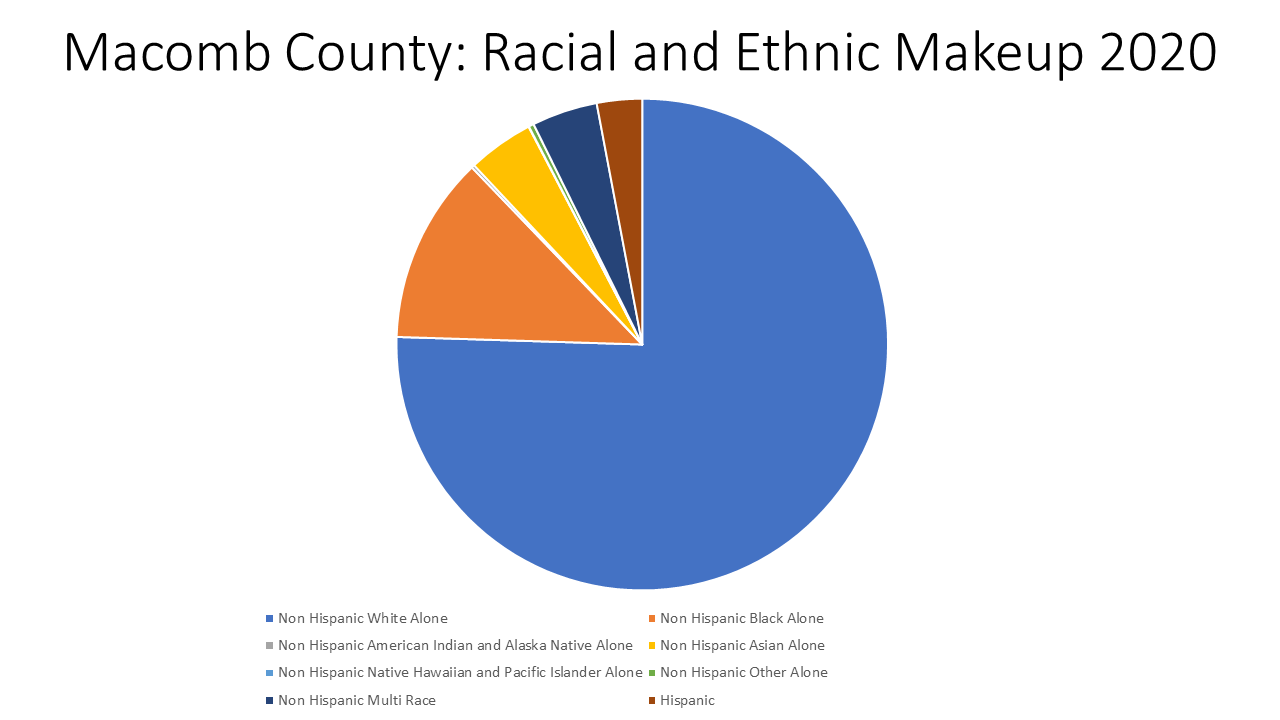
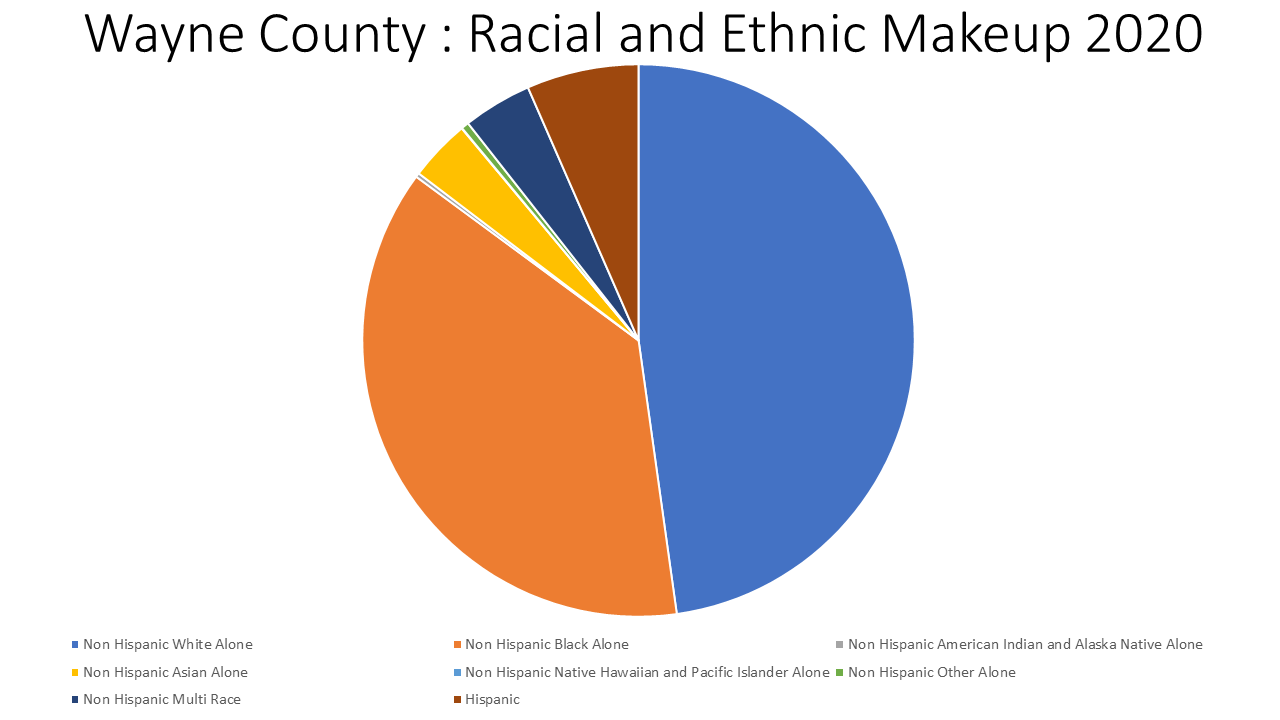
Each pie chart below shows what the 2020 racial makeup of each county in Southeastern Michigan was, according to the 2020 Census. As noted, the Non-Hispanic white population made up the highest percentage of each county’s population in the region, however some counties in the region were, and remain to be, more diverse than others. Wayne County had the highest percentage of a black population, despite a population loss of that racial group between 2010 and 2020, at 37 percent. As mentioned, Macomb County had the highest percentage increase in its black population between 2010 and 2020 percent at 50 percent, followed by Livingston County with a 44 percent increase and Monroe County with a 28 percent increase. Of those counties, the percentage of black residents in Macomb County in 2020 was 12 percent; in Livingston County that percentage was 1 percent and in Monroe County that percentage was 3 percent.
Conversely, Livingston County had the highest percentage of the Non-Hispanic white population at 91 percent, in which there was a 2.5 percent population increase of between 2010 and 2020.
So, overall while some of these counties did experience notable gains in certain populations, such as the black and Non-Hispanic “other” and “multi” populations, the overall percentage some racial ethnic groups gained still did not bring them even close to making up the majority of a county’s overall population group.
As 2020 Census data continues to become more available, we will further explore what population changes have occurred over the last 10 years in Southeastern Michigan. We do know, as shown above, that there have been overall population gains and losses in each county and racial and ethnic population gains and losses. Being able to dig deeper into where these gains and losses occurred at the municipal and Census tract level will further help us understand how the region is changing.