911 Fees the Norm in Michigan

The way in which funding for 9-1-1 services changed in Michigan in 2018 with Public Act 51. On a quarterly basis, the state provides funding to the counties. This funding comes from the $0.25 state 9-1-1 fee on postpaid devices and a 5 percent fee on pre-paid phone cards and minutes. From there, 65 percent of these pooled funds are paid to the counties in Michigan. Of this 65 percent, 40 percent of the funds are distributed to each county and the other 60 percent are distributed on a per capita basis to the counties. Counties also have the option to levy additional 9-1-1 fees through levying a local surcharge. If levied, the surcharges must be used to fund personnel, facilities and training related to the delivery of 9-1-1 services. These surcharges can be levied by one of three ways, which are:

  • The County Commission passes a resolution to collect a maximum of $0.42 per month on the cell phone bills of county residents;
  • The County Commission places a surcharge (which can be above $0.42 but cannot exceed $3) as a county-wide proposal;
  • Collecting a local surcharge by the rate authorized to that specific county pursuant to the Michigan Public Service Commission Case No. U-15489.

As noted, funding is made available to all counties in Michigan for 9-1-1 services through the provisions of Public Act 51. With the option to levy additional funds to support 9-1-1 services, most counties in Michigan have decided to utilize the opportunities offered to them to do so. Of the 83 counties in Michigan, only 11 do not currently bring in additional funds through a 9-1-1 surcharge, with Macomb County being the largest county not do so. Regionally, Wayne County levies the additional $0.42 (the most a County Commission can charge by not placing a measure on the ballot) through a surcharge, Oakland County levies $0.91, Monroe County levies $0.42, St. Clair County levies $0.60, Washtenaw County levies $0.43 and Livingston County levies $1.85, which is the highest regionally.

Of Michigan’s 83 counties there are six that levy $3, which is the maximum amount a county can levy and must be approved by voters.

Wayne County Hosts Highest Number of Contaminated Sites in Michigan

The federal Superfund Program was created in 1980 to respond to releases of hazardous substances in the environment. The Superfund Program protects the public and the environment, making communities safer, healthier, and more economically viable.

Superfund sites are some of the most significant and expensive sites of environmental contamination. Superfund sites include all sites in the United States where the Environmental Protection Agency (EPA) has identified contamination with hazardous waste. When the EPA determines that a site requires cleanup, the site is placed on the National Priorities List (NPL). As of 2017, Michigan has 65 sites listed on the NPL. An additional 19 sites that were previously on the NPL have been deleted because all necessary response actions were completed.

NPL sites fit within three categories:

  1. Proposed NPL site,
  2. Current NPL site, and
  3. Deleted NPL site.

A proposed NPL site means that hazardous substances have been identified at the site, and it has been recommended to the federal Superfund Program for clean-up. Current NPL sites are those that have been accepted by the Superfund Program and are undergoing clean-up. The deleted NPL sites are those that have completed the process of clean-up, and they have been deemed protective of public health, and the environment.

Sites in the Superfund Program may be managed in a variety of ways. The EPA, the state, or private parties may implement the cleanup. The Superfund law allows for enforcement actions which make private parties conduct the cleanup if they were responsible for the contamination. Where there are responsible parties, the EPA may take the enforcement lead with the state providing support (36 sites in Michigan). In some cases, the state may take the enforcement lead on particular sites (10 sites in Michigan).

The Michigan Department of Environmental Quality also has sites for remediation called Baseline Environmental Assessments (BEA). BEA sites are facilities with a history of use of chemicals. The sites may be classified into several categories, including Part 201 (i.e., having one or more contaminants) and Part 213 (i.e., having leaking underground storage tanks). Remediation of these sites includes activities to manage and reduce risks of environmental contamination. This may be achieved through activities such as: initial evaluation, interim response, remedial investigation, land and resource use restrictions, and monitoring.

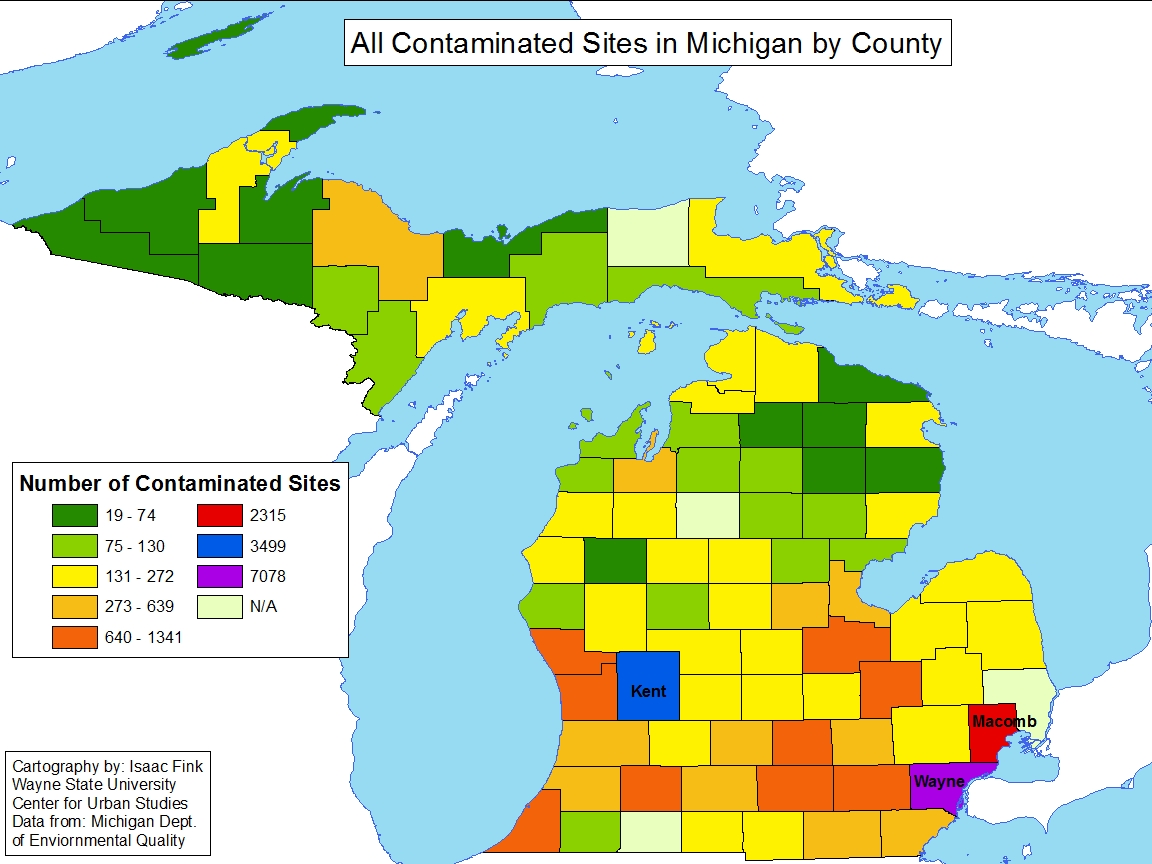
All Contaminated Sites in Michigan by County: BEA, Part 201, Part 213, and Superfund NPL Sites

The map below of the state of Michigan includes BEA, 201, and 213 contaminated sites, as well as Superfund NPL sites. Each color on the map represents the range of BEA, 201, and 213 contaminated sites per county or the actual total. For example, many of the counties with a smaller total number of contaminated sites are designated with a color that is also associated with a range. However, Kent, Macomb and Wayne counties are designated with a color that directly associates to the total number of contaminated sites in that county. The map shows that Wayne County contains the largest number of contaminated sites 7,078 sites. Kent County has 3,499 contaminated sites and Macomb County has 2,315.

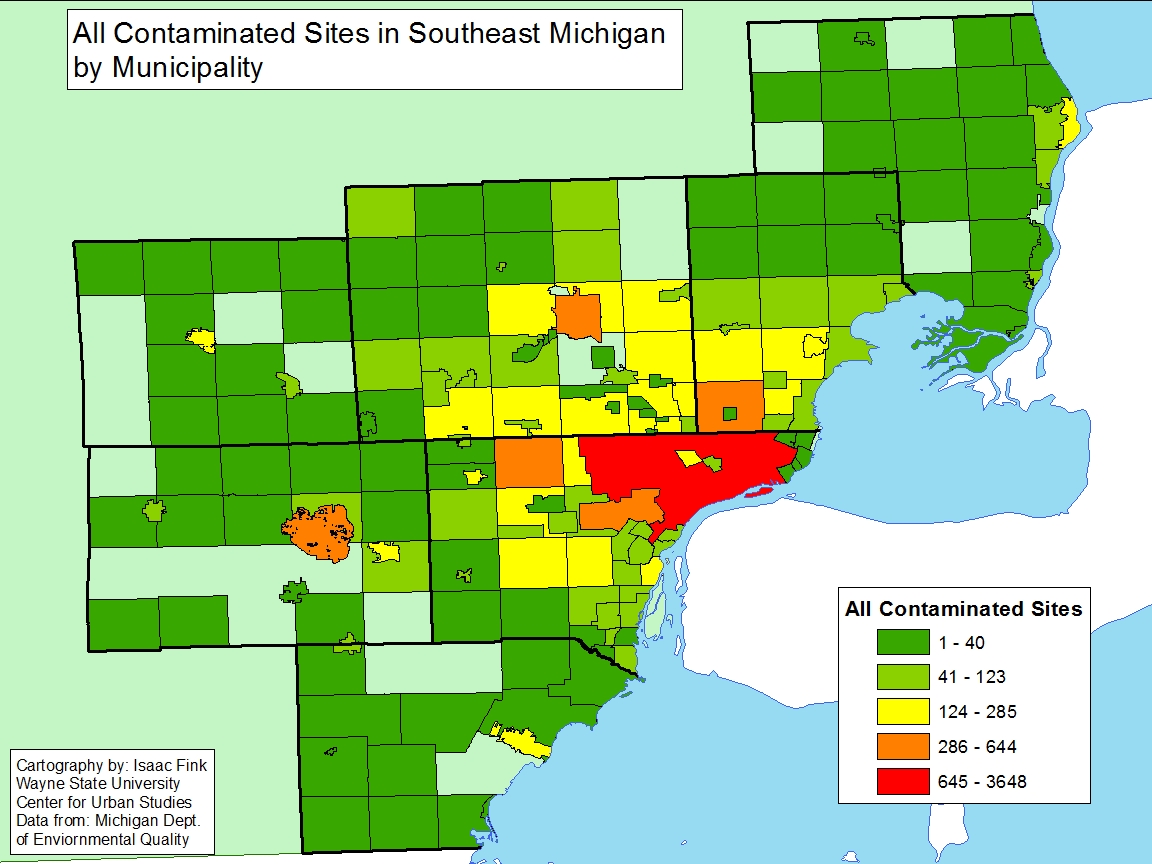
All Contaminated Sites in Wayne County by Municipality: BEA, Part 201, Part 213, and Superfund NPL Sites

The regional map below includes BEA, 201, and 213 contaminated sites, as well as active Superfund NPL contaminated sites and deleted NPL sites. Each color on the map represents the range of BEA, 201, and 213 contaminated sites per city (e.g., Highland Park = 124-285 sites). A green circle indicates a deleted NPL site, while a yellow diamond indicates an active NPL site. The map shows that Detroit contains the greatest number of contaminated sites in Wayne County, with a total of 3,648 (the color red does provide a range, based off the range before it, but Detroit is the only city within the last range). Additionally, there is one deleted NPL Superfund site in Detroit and two in Wayne County. There is also an active NPL Superfund site in Wayne County, in Trenton.

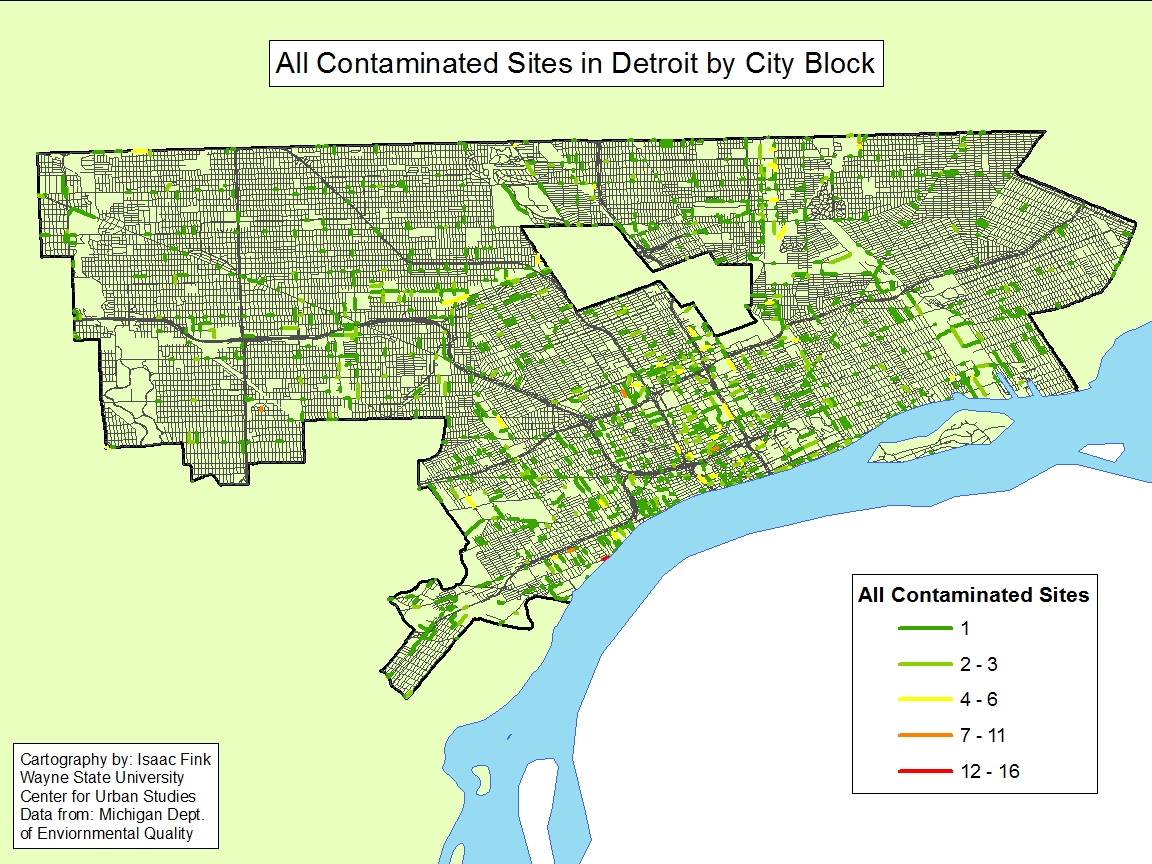
Overall, as the second map below shows, a block in Southwest Detroit has the highest number of concentrated contaminated sites. On a larger scale though, the area just west of Woodward Avenue, south of Highland Park, has several blocks where there are at least one to six contaminated sites.

In this post we simply highlighted the counties and municipalities in the state with the highest number of contaminated sites. However, there is more to this conversation than just that. In a coming post we will also be taking a further dive into where much of these sites are located regionally, specifically Detroit, and the link between income and contaminated sites.

Equal Equitable Policies Needed for Longer Life Expectancy

Socioeconomic factors have a direct impact on the span of one’s life. Our posts on January 3,16 and 23 have demonstrated clear relationships between lifespan and key policy variables.

Where do you live? What is your highest-level education? How much do you earn? Do you have access to health care? Depending on how an individual answers each of those questions, their life expectancy may go up or down.

As we’ve learned over the last several weeks:

  • Those living at or below the poverty line have a lower life expectancy.
  • Those with a bachelor’s degree or higher have a higher life expectancy.
  • Those without health insurance have lower life expectancy.

We further examined the combined impact of these three factors to help understand which is most important. Using multiple regression analysis, we estimated the impact of each variable as well as their combined effect. Together they explain 62.6% of the variance in life expectancy across the region, meaning that nearly two thirds of one’s age at death is related to their combined effect. This is a highly statistically significant effect with less than one chance in a 1,000 that this estimate is a result of chance. Further, of the three variables, the most powerful variable is the level of education (b=0.100; beta=0.456). It is almost one and half times as powerful as poverty (-0.099; -0.345) the second most powerful variable. And education is four times as powerful as being uninsured (-0.081;-0.101).

Nevertheless, all three of these variables contributed an independent effect on life expectancy. These variables are correlated with each other, which under certain conditions can bias these results, but after examining statistics such multicollinearity this does not appear to be a problem. So, while poverty effects both education and the likelihood that somebody in uninsured, each provides an independent effect. No doubt other factors do as well, including chance, habits, and one’s genetic background.

Still it is both sad and potentially hopeful that much of the differences in life expectancy across our region can be explained by these factors because all of these factors are ones we, as a society and a polity, can affect.

This helps us answer the question of what can be done to improve average length of an individual’s life. We need to start by decreasing poverty. Decreasing poverty is not easy to tackle, but there are steps policy makers can take to lower the number of people living at or below the poverty level. Such actions include increasing the minimum wage, creating policies focused on long-term job growth and supporting equity in pay structures, job opportunities and available housing. Perhaps the most important policy is to use the tax system to redistribute income by taxing the very rich (the one and two percenters) to provide supports and services to those with less income. Remember the U.S. once taxed high earners at a rate over 70 percent.

More tax revenue would support higher education, which has recently been strangled by decreasing support from state governments and increasing reliance on student loans. The over-reliance on loans burdens graduating students with long term loan payments, which decrease their mobility and their ability to pursue graduate education.

The creation of a semblance of a national health care system through Obamacare has provided some basic protections for many who had no care. There are, however, still many that do not have care or for whom care is so expensive they cannot truly afford it. Increasing access to health insurance will also require extensive work, but one way to start includes providing information to the underserved on their current options to receive healthcare, and extending these services. Policies reforming the fee structures instituted by insurance and medical companies and creating alternative payment methods are other ways to make health care more accessible.

Overall, discovering reasons why certain communities in Southeastern Michigan have such lower average life expectancies helps us understand what we need to move ahead. Let’s provide them with the income to create healthy lifestyle and sustain longer lives. However, actions must be taken in order for those opportunities to be made available. We as a society, and our policy makers, need to ensure equity and equality are inherent parts of the socioeconomic policies that can ultimately give individuals an opportunity to live a longer life.