Monroe, St. Clair Counties Rank Highest for Green Infrastructure; Majority is Agricultural Land

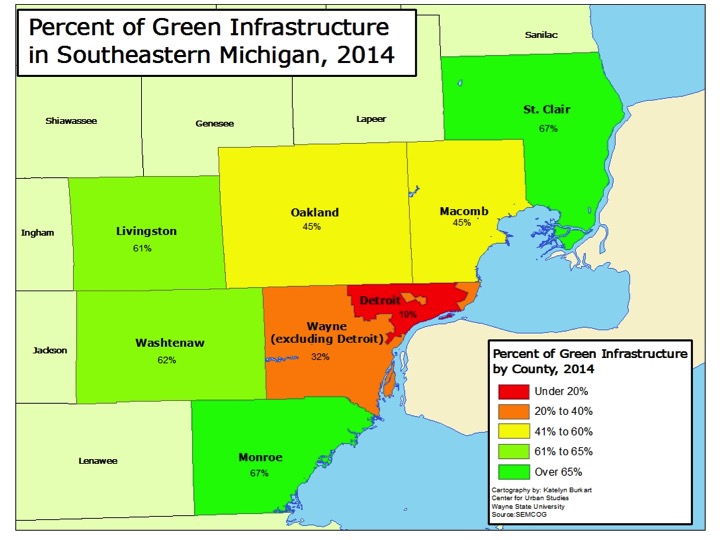
In Southeastern Michigan there was about 180,000 acres of green infrastructure in 2014, according to the Southeastern Michigan Council of Governments (SEMCOG), and the regional planning agency is looking to improve and grow that number. This green infrastructure represents both natural ecosystems (wetlands, forests and parks), agricultural land and constructed versions, such as community gardens and bioswales. Both Monroe and St. Clair counties had the highest percentage of total green infrastructure in 2014 at 67 percent. Wayne County, both including and excluding Detroit, had the lowest percentage of green infrastructure. Excluding Detroit, Wayne County was made up of 32 percent of green infrastructure; including Detroit Wayne County was made up of 30 percent green infrastructure. In general, one can think of green infrastructure as the inverse of developed land, where houses, businesses, roads and other infrastructure exists.

Of this overall green infrastructure it is important to identify what it is comprised of. Below we will see how the tree canopy varies from county to county and how these variations are affected by the presence of parks and agricultural land.

The data provided for this post was found in SEMCOG’s 2014 Green Infrastructure Vision document.

Metro-Detroit Green Infrastructure

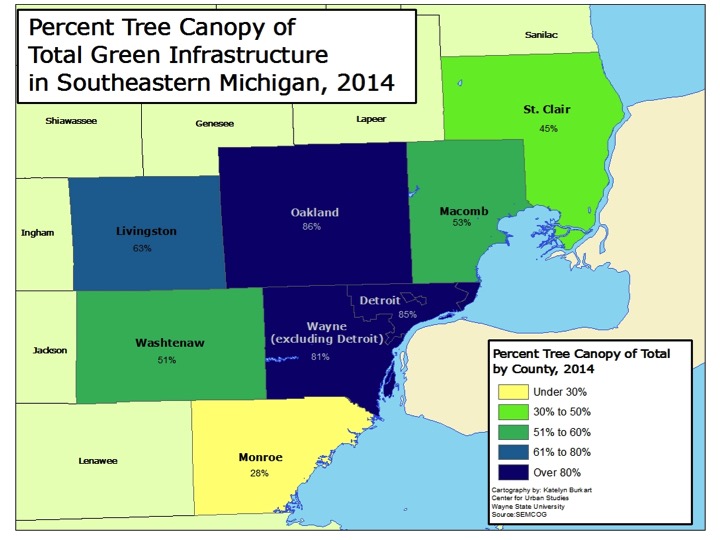
In total, Oakland County had the highest percentage of overall tree canopy at 44 percent; the county’s tree canopy made up 86 percent of its total green infrastructure. Oakland and Livingston counties were the only two in the region that had a tree canopy above the American Forest’s overall standard of 40 percent. The American Forest is the country’s oldest conservation non-profit, and SEMCOG bases its green infrastructure goals on their standards.

The county with the lowest overall tree canopy was Monroe; it had a tree canopy of 20 percent. This 20 percent of total tree canopy made up 28 percent of its total green infrastructure. This is largely because of the greater portion of land devoted to agriculture, as discussed below.

The city of Detroit had a total tree canopy of 16 percent, which is below American Forest’s standard for tree coverage in an urban area. Nevertheless this represents 85 percent of Detroit’s green infrastructure. American Forest calls for a 25 percent tree canopy coverage in an urban area. In a suburban residential the organization’s standard is 50 percent, and in a central business district that standard is 15 percent.

Metro-Detroit Tree Canopy

Metro-Detroit Tree Canopy and Green Infrastructure

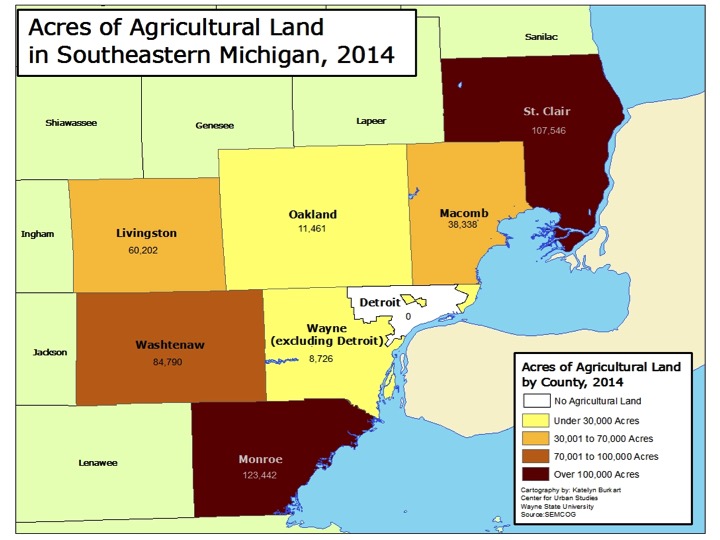
While tree coverage is an important aspect of green infrastructure, it is not the only thing that can make a community “more green.” As discussed above, Monroe County had the highest percentage of overall green infrastructure yet the lowest percentage of tree canopy coverage. As shown below, this is, in part, because there was more than 123,000 acres of agricultural land in Monroe County in 2014. Monroe County had the highest amount of agricultural land in 2014 in the region followed by St. Clair County, which had about 107,000 acres of agricultural land. St. Clair County, like Monroe County, was made up of 67 percent green infrastructure. According to SEMCOG, Monroe County ranks seventh in the state in the total number of acres of vegetables (6,707) and corn, soy and wheat (169,792). St. Clair County ranked sixth in the state in the number of farms producing organic products and eighth in state for the total number of acres of soybeans it produced in 2014 (64,224).

According to SEMCOG, agricultural land is defined as “rural land used with the growing of food as the primary function, but can also provide ecological benefits.” SEMCOG classified Detroit as having 0 acres of agriculture, but this does not include the number of community gardens, which have been growing in the city through individual and organizational efforts.

While Detroit had 0 acres of agriculture land, Wayne County had 8,726 acres of agricultural land, which was the smallest amount in the region.

Metro-Detroit Agriculture Land

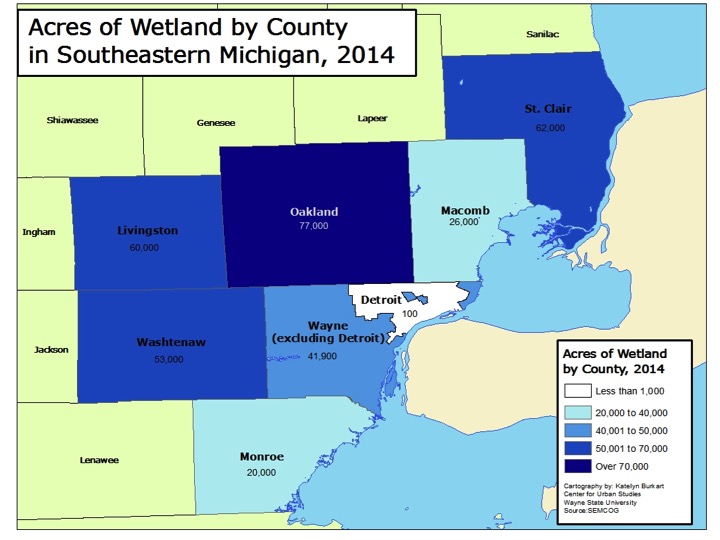
For total acreage of agricultural land in the region, Oakland County had amongst the smallest amount of coverage in the region but for wetland coverage it had the greatest amount. Oakland County had 77,000 acres of wetland in 2014. St. Clair (62,000 acres), Livingston (60,000) and Washtenaw (53,000) counties all had more wetland coverage than Wayne County. However, the 41,900 acres of wetland coverage in Wayne County was nearly five times the amount of agricultural land in the county. Additionally, of those 41,900 acres, 100 were located in Detroit.

Monroe County had the least amount of wetland coverage at 20,000, which is about 100,000 less acreage than it had of agricultural land.

Metro-Detroit Wetlands

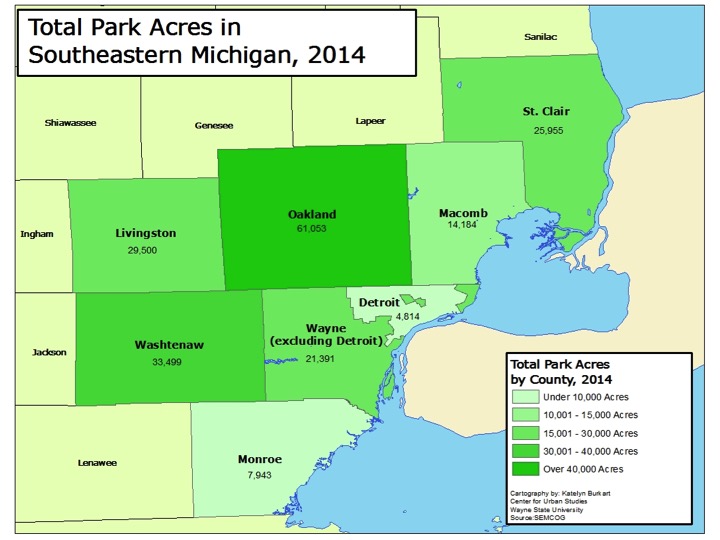
Another factor into the total amount of green infrastructure present in a county is park land, which includes city, country, metro and state parks. Oakland County had the highest amount of park acreage at 61,053. Oakland County is home to five state park/recreation areas, three metroparks, 13 county parks and numerous local parks at the municipal level. Washtenaw County had the second highest acreage of park coverage at 33,499 acres, which was nearly half of Oakland County’s coverage. Like Oakland County, Washtenaw County is home to three metroparks and 13 county parks. Washtenaw County also has 20 nature preserves, numerous parks at the local level and nine state park/recreation areas.

Wayne County had about 26,000 acres of total park acreage, about 5,000 of which was located in Detroit. Belle Isle made up nearly a fifth of Detroit’s park acreage; it is 982 acres.

Metro-Detroit Parks

The amount of green infrastructure established in a community and a region is important because it can not only serve as a catalyst for economic growth but also because it serves as the base for ensuring citizens have access to clean water and air, fresh food and amenities that promote healthy and sustainable lifestyles. There is a recognition that additional green infrastructure is needed in Southeastern Michigan, which is why SEMCOG has created a green infrastructure vision. This vision aims to benchmark the current green infrastructure in the region and then identify policies that will allow for stronger and more connected infrastructure networks, more accessibility and cleaner air and water quality.
Lenawee County has highest percentage of children with elevated lead levels

The data discussed in this post is preliminary data on the lead poisoning of Michigan’s children in 2015 and was supplied by Michigan Department of Health and Human Services (MDHHS) at the county and zip code level, as well as data for the city of Detroit. At the county level, MDHHS also provided an approximate percentage of children who had blood lead levels at 5 ug/dL (micrograms per deciliter of blood) and above. Population data was only available by Zip Code Tabulation Area (ZCTA) (which are somewhat inconsistent with zip codes), preventing the calculation of percentage of children affected for the zip code data.

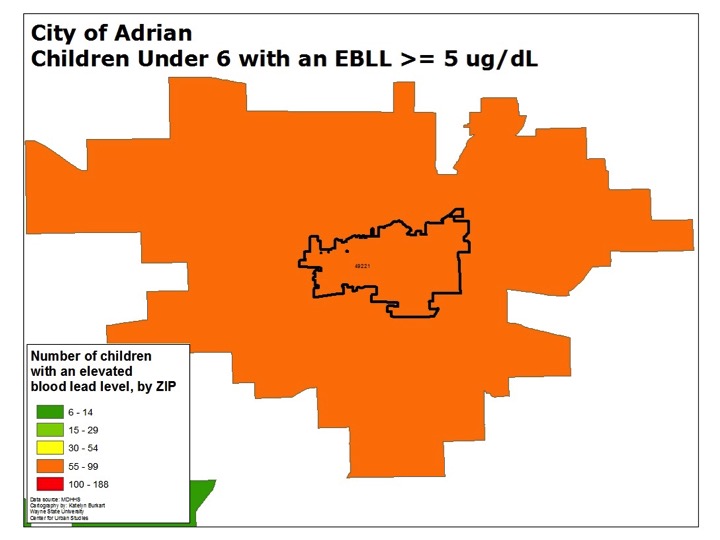
At 10 percent, Lenawee County had the highest percentage of its population under 6, county-wide, with an elevated blood lead level at 5 ug/dL, according to preliminary 2015 data supplied by MDHHS. The city of Adrian is located in rural Lenawee County and within the boundary zip code of 49221. There were 67 children under the age of 6 with elevated blood lead levels greater than or equal to 5 ug/dL in that zip code, according to data supplied by MDHHS.

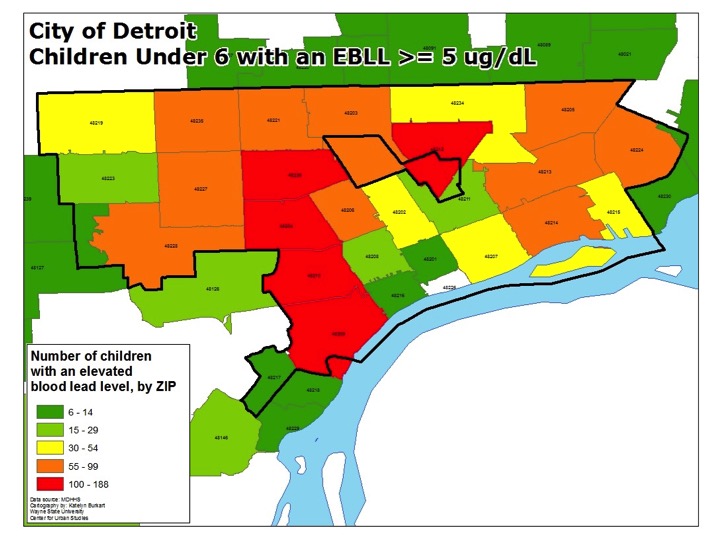
The city of Detroit had 7.5 percent of its population of children under the age of 6 with elevated blood lead levels greater than or equal to 5 ug/dL . However, Wayne County (excluding Detroit) had less than 2 percent of its population of children under the age of 6 with elevated blood lead levels greater than or equal to 5 ug/dL. All seven counties in Southeastern Michigan had less than 2 percent of its population of children under the age of 6 with elevated blood lead levels. At the more local level though, the second map below shows that zip codes in the Port Huron area had between 55-99 children under the age of 6 with blood lead levels greater than or equal to 5 ug/dL. Portions of southern Oakland and Macomb counties, along with Ann Arbor/Ypsilanti area in Washtenaw County, had zip codes with no more than 14 children under the age of 6 with blood lead levels greater than or equal to 5 ug/dL. In Oakland County, the areas around Pontiac and Southfield, along with the area around the Detroit-Metro Airport in Wayne County had slightly higher numbers of children under the age of 6 with blood lead levels greater than or equal to 5 ug/dL; these numbers maxed out at 29, per zip code.

According to the Centers for Disease Control, 5 ug/dL is used a reference level by experts “to identify children with blood lead levels that are much higher than most children’s levels.” The CDC has recommended that public health actions be initiated in children under age 6 with blood lead levels above 5 µg/dL. Babies and young children can be more highly exposed to lead because they often put their hands and other objects that can have lead from dust or soil on them into their mouths.

Michigan Lead Data_County

Michigan Lead Data_Zip

When viewing the elevated blood lead levels in Lenawee County overall and at the more local level of zip codes, we see that the number of children under the age of 6 with elevated blood lead levels in Adrian contributed to the county as a whole having among the highest percentage of elevated lead levels. In 2015, according to MDHHS data, the zip code containing the city of Adrian had 67 children under the age of 6 with elevated blood lead levels.

Aside from Adrian, Detroit and the Port Huron area, the central portions of Muskegon County and Grand Rapids had substantial numbers of children with elevated blood lead levels in certain zip codes.

Adrian Lead Data

There were five zip codes in the city of Detroit in 2015 with more than 100 children under the age of 6 with elevated blood lead levels greater than or equal to 5 ug/dL. These zip codes were: 48238, 48204, 48210, 48209 and 48212. Four of these zip codes are aligned in a row on the west side of Detroit, including parts of neighborhoods such as Southwest Detroit. In total, 1,618 children under the age of 6 were reported to have elevated blood lead levels in Detroit in 2015.

Detroit Lead Data

In the southwestern portion of Grand Rapids the zip code of 49507 had 188 children under the age of 6 with elevated blood lead levels greater than or equal to 5 ug/dL. In total, the city had no more than 523 children under the age of 6 with elevated blood lead levels. The only other city with areas with numbers as high or greater was the city of Detroit, according to data supplied by MDHHS.

Grand Rapids Lead

The city of Flint is important when discussing elevated blood lead levels across the state of Michigan. Due to the water crisis that has been plaguing the city, children’s lead levels have gained national attention. The effect on children of lead in Flint’s water is unlikely to be correctly indicated by the 2015 numbers from MDHHS, first, because many children had not been tested, and second, because lead may not be found in their blood a certain amount of time after they quit drinking water containing lead. This is not to say the lead did not impact the children, but it may have been excreted or taken up into organs or bones. Many thousands of children may have been exposed to lead from the water, though the exact number is still unknown.

The 2015 data supplied by MDHHS shows that the highest number of children poisoned in Flint were in zip code 48503, which had 36 children under 6 with lead levels greater than or equal to 5 ug/dL. Portions of the zip codes of 48504, 48505, 48506 and 48507 are also within Flint’s city limits; these zip codes had 28, 15, 18, and 13 cases in 2015, respectively.

Flint Lead

While elevated blood lead levels in children in the city of Flint are being linked to lead found in the drinking water, as caused by the erosion of the city’s pipes, most lead poisoning in Michigan is related to lead in paint. In 1978, the federal government banned consumer uses of lead-containing paint, but some states banned it even earlier. Lead from paint, including lead-contaminated dust, is one of the most common causes of lead poisoning, and is almost exclusively the source of lead poisoning in the Detroit area, as discussed in a previous Drawing Detroit post.

Lead paint often deteriorates as housing ages, shedding dust and flakes, which becomes available to children to ingest. So the age of housing is a proxy for the risk of lead poisoning. The first map below shows that there are more than 50 counties across the state where 60 percent or more of the housing stock-either owner or renter occupied-was built prior to 1980. About 93 percent of all houses in Detroit and Flint were built before 1980, according to Census data. For the city of Grand Rapids 81.2 percent of the housing stock was built prior to 1980, and for the city of Adrian that percentage is 74.9. The second map below shows the percentage of renter-occupied housing units by county. It will require further examination for a conclusion about the statewide data, but certainly in Detroit lead poisoning tends to be higher in renter-occupied housing. This fact offers an opportunity in that it would be possible to use more assertive code enforcement to require landlords to abate lead paint hazards that are so pervasive in Michigan’s older housing. Several communities in Michigan have tested this approach, which has been very effective in other major cities.

Owner 1980

Renter 1980

Nearly 40 Percent of Southeastern Michigan Schools Receive Lowest State Aid Funding

In 2015 Michigan school districts received a per pupil school aid funding increase between $70 and $140 per student, leaving the Southeastern Michigan per pupil funding amounts between $7,391 and $12,004. For 2016 the Michigan Legislature approved lower funding increases at $60 to $120 per pupil, according to the Senate Fiscal Agency. This funding increase was approved by the Legislature on Thursday, June 9, but Gov. Rick Snyder still needs to sign the bill.

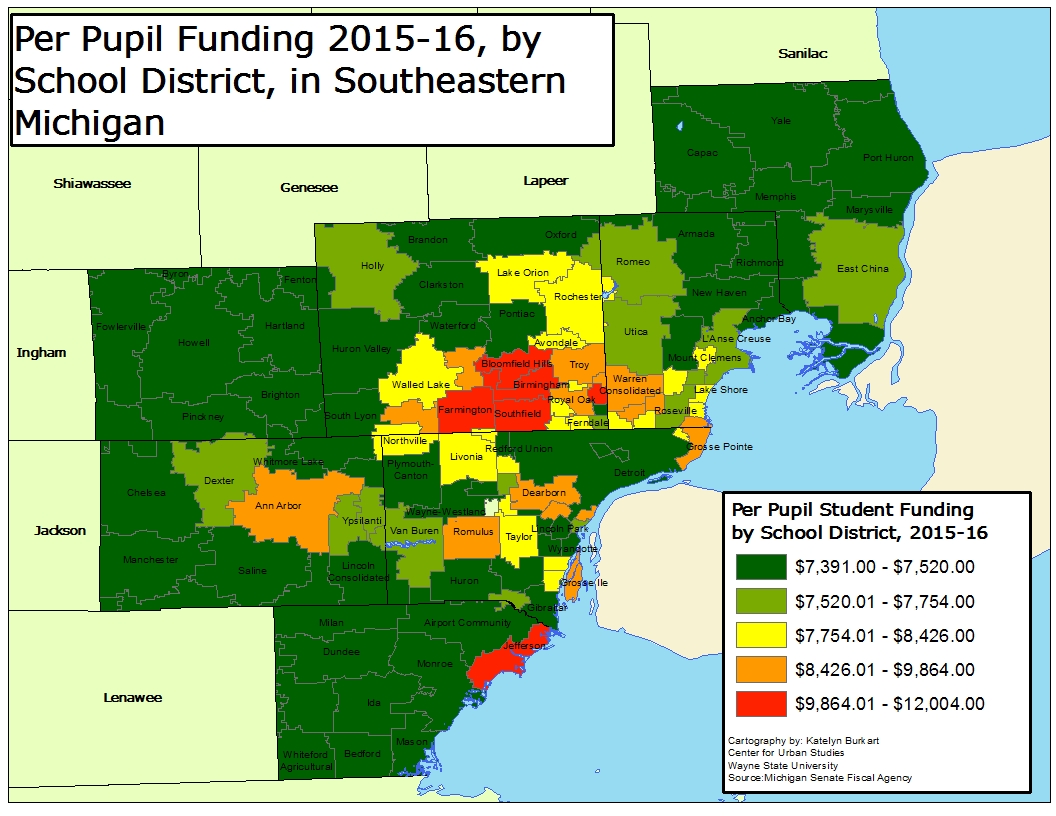
While we wait on this action, Drawing Detroit created a map showing the per pupil funding, also known as the foundation allowance, for Southeastern Michigan school districts in 2015. This shows how funding ranges numerically and geographically in the region.

Before we address the current and State Legislature approved per pupil funding for the 108 Southeastern Michigan School districts, it is first important to have a basic understanding of how Michigan schools are funded.

Public schools have three funding streams: state funding, federal funding and local taxation. The main revenue source districts is from the state. Prior to 1994 school districts received majority of their funding from property taxes. However, with the passage of Proposal A in 1993 most local real and personal property taxes for school operating purposes were exempt. To make up for this loss the sales tax in Michigan increased from 4 to 6 percent; that additional 2 percent was dedicated to school funding. Also, cigarette taxes increased and a real estate transfer tax was created to offset the loss of local tax revenues. Additional revenue sources for state school aid funding are the state education tax (6 mills) and portions of revenue from the lottery and casino and industrial facilities taxes.

Prior to Proposition A, local taxation accounted for 69 percent of the state/local funding ratio for public schools, according to the State Senate Fiscal Agency. Now, with the exception of hold-harmless districts (which will be discussed later) operational funding for a district comes from state funding, but local taxes can be levied for school construction, technology and other infrastructure and debt related needs, according to the Senate Fiscal Agency.

The amount originally allocated per pupil per district was determined for the 1994-95 school district based on each districts’ 1993-94 per pupil funding basis, according to the Senate Fiscal Agency. This initial per pupil funding equation varied vastly across the state because it was largely based off of the property values and taxes that were used to fund districts prior to Proposition A. In an attempt to close funding gaps, the state began to give the lowest funded schools double funding increases. While these increases helped make the funding gap smaller in several cases, there are also more than 50 of the about 550 public school districts in the state considered to be hold-harmless districts. This designation means that prior to Proposition A the taxpayers contributed more than $6,500 per pupil in a district. The state decided these districts could continue to levy additional property taxes for school operations.

There are 21 hold-harmless districts in the region, all of which are listed below.

Hold-Harmless Schools
School District Funding County
Bloomfield Hills Schools $12,004 Oakland
Birmingham Public Schools $11,924 Oakland
Jefferson Schools $11,180 Monroe
Southfield Public School District $10,971 Oakland
Lamphere Public Schools $10,429 Oakland
Farmington Public School District $10,045 Oakland
Grosse Pointe Public Schools $9,864 Wayne
Center Line Public Schools $9,503 Macomb
Ann Arbor Public Schools $9,170 Washtenaw
Warren Consolidated Schools $9,006 Macomb
Troy School District $8,955 Oakland
South Lake Schools $8,874 Macomb
Melvindale-North Allen Park Schools $8,675 Wayne
Warren Woods Public Schools $8,638 Macomb
School District of the City of River Rouge $8,505 Wayne
Dearborn City School District $8,482 Wayne
Grosse Ile Township Schools $8,474 Wayne
Trenton Public Schools $8,426 Wayne
School District of Harper Woods $8,169 Wayne
Livonia Public Schools $8,169 Wayne
Northville Public Schools $8,169 Wayne


The Bloomfield Hills School district had the highest foundation allowance in the region for the 2015-16 academic year at $12,004; its proposed funding increase for the upcoming school year is $60 (the lowest proposed increase, which is equivalent to the rate of inflation). There were only 10 districts in the region with foundation allowances above $9,000. These 10 districts, and the other 10 hold-harmless districts are all expected to receive the $60 inflation rate increase in the Legislature approved school funding package. Typically, according to The Bridge Magazine online, the hold-harmless districts tended to be located in wealthier communities. While this doesn’t still hold true for all the districts on the above list (i.e. Harper Woods and River Rouge) there are still some districts on that list where wealth is substantial. One example would be the district at the top of the list—Bloomfield Hills. The Census reported that in 2014 (most recent data) the median income in Bloomfield Hills was $163,462.

On the opposite end of the spectrum, 42 of the districts, or 39 percent, received between $7,391 per pupil (the lowest funding tier) during the 2015-16 academic year. The Detroit Public Schools systems didn’t receive the lowest funding tier, but close to it at $7,434. Districts that had a $7,391 funding allowance for the 2015-16 academic year are all expected to receive a $120 per pupil increase for the 2016-17 academic year, which is the highest proposed increase. The Detroit Public Schools system is expected to receive a $118 increase. This increase is not reflective of the $617 million bill the Michigan Legislature passed on June 9 in an attempt to fix the Detroit Public Schools district; the School Aid Fund doesn’t contribute to this package.

The map below highlights that majority of the districts with the lowest state aid funding are either located in more rural or urban areas.

Student Funding

The Legislature approved funding allowance for the 2016-17 academic year does aim to further close the gap between lowest and highest funded schools, but doesn’t come without criticism. Michigan State University Education Policy Professor David Arsen said in a June 9 Lansing State Journal article that recent state aid funding increases barely stay ahead of inflation increases. Additionally, he noted that schools facing enrollment decline won’t necessarily feel the affects of the funding increase because of the overall monetary loss associated with losing students. According to the State Senate Fiscal Agency, about 65 percent of a public school districts budget is now made up of funds provided by the state, which further emphasizes the budget constraints a district can feel when students leave one district for another.


Once the 2016-17 per pupil funding package is signed by Gov. Snyder, Drawing Detroit will provide an updated map, along with a more in-depth look at the funding increases in relation to student e

Oakland County Intersections Takes Top Spots for Total Number of Crashes

The Michigan State Police recently released new traffic data regarding the number of crashes at intersections throughout the state in 2015. In the seven county region, Oakland County had the intersection with the largest amount of crashes at 186. This intersection is at Pontiac Trail and M-5/Martin Parkway in Commerce Township. The intersection in the region with the second highest number of crashes was also in Oakland. This intersection is located in Southfield at 12 Mile Road and Telegraph; there were 132 crashes there in 2015.

For more on this study click here.

Drawing Detroit will be further looking into the total number of crashes at these intersections as relates to traffic flow.

Detroit Teen Pregnancy Rate Decreasing, Remains Above the Region’s and State’s

In 2014 in the seven county Southeastern Michigan region Wayne County had the highest teen pregnancy rate at 57.4 per 1,000 female residents between the ages of 15 and 19. This rate is largely reflective of the 84.8 teen pregnancy rate that Detroit had that year; without including Detroit into the calculation Wayne County had a teen pregnancy rate of 37.1 in 2014. And, while Wayne County had the highest teen pregnancy rate in the region in 2014 that rate was the lowest it had been since 1989. This trend of declining teen birth rates not only occurred in Wayne County, but throughout the seven county region, and in the city of Detroit.

According to the Michigan Department of Health and Human Services, the teen pregnancy rates discussed in this post were calculated by taking the estimated number of pregnancies, dividing that number by the female population of 15-19 year olds in each respective county and then multiplying that number by 1,000. Pregnancy numbers are a sum of estimated live birth, miscarriages and abortions. Information to calculate these numbers were provided to the Michigan Department of Health and Human Services through the Michigan Resident Live Birth Files, the Files of Induced Abortions Occurring in Michigan and the Michigan Division for Vital Records and Health Statistics.

Michigan Teen Pregnancy

In 2014 the Michigan Department of Health and Human Services reported there were an estimated 2,101 pregnancies amongst the 24,762 teens between the ages of 15-19 in the city of Detroit. As mentioned earlier, by excluding Detroit teen pregnancies from Wayne County the numbers significantly drop. This exclusion left Wayne County with a teen pregnancy rate of 37.1 in 2014, which is lower than St. Clair County’s pregnancy rate of 37.7 in 2014. St. Clair County’s pregnancy rate in 2014 is representative of a teen population of 5,011 females between the ages of 15-19, in which there were a reported 189 pregnancies. Only St. Clair and Wayne counties, along with the city of Detroit, had teen pregnancy rates above the state’s rate of 34.8 in the region. In Michigan in 2014 there were 330,141 females between the ages of 15-19; amongst this population there was an estimated 11,474 pregnancies. This produces a rate of 34.8

Washtenaw County had the lowest teen pregnancy rate in the region in 2014 at 14.2; this is representative of 213 estimated pregnancies amongst 15,510 females between the ages of 15-19.

Michigan Teen Pregnancy Historic

Overall teen birth rates in Southeastern Michigan have been declining; this is also a national trend. Wayne County, including the teen birth rate for the city of Detroit, consistently had the highest rate in the region. As for the lowest rate, it changed from Livingston County in 2005 to Washtenaw County in 2014. Additionally, while Wayne County had the highest teen birth rate in the region, it has also had the largest decrease of the seven counties. In 2005 the Wayne County teen birth rate was recorded at 76.5 and in 2014 that dropped to 57.4, a 19.1 decrease. In 2005 Washtenaw County’s teen birth rate was 28.2 (just above Livingston County’s rate at 24.9) and by 2014 it decreased to 14.2, making it the lowest teen birth rate in the region in 2014.

When not reviewing the teen birth rates solely at the county level we see that Detroit’s teen birth rates decreased from 107.8 to 84.8 between 2005 and 2014. This decrease was 23.8 points. While there was a decrease, Detroit’s pregnancy rates consistently remained above those in the seven county region. According to Michigan Planned Parenthood Communications Manager Julie McKeiver, both teen pregnancy, and abortion rates, tend to be higher in large cities and rural areas that have low income and low minority populations. This occurs because of the lack of access to health care and related services, she said. To help combat such high rates, Planned Parenthood of Michigan offers a Peer Education program in Detroit, which aims to educate teens on their sexual health. This education, according to McKeiver, is meant to empower the teens in the program, who will then share what they learned with their peers. This program is funded by the State of Michigan’s Taking Pride in Prevention Program (TPIPP). The TPIPP is statewide initiative that also aims to reduce pregnancy. The TPIPP not only funds the Detroit Peer Education Program but also the Safer Choices teen pregnancy curricula that Planned Parenthood implements in Detroit schools and community-based organizations, McKeiver said. This curricula touches on subjects such as delaying the initiation of sex and increasing the use of protection, according to the website.

Although programs are in place in Detroit that aim to decrease the pregnancy rate through education the question remains on how much impact those have versus the impact the lack of health care access that low income communities face.

Michigan Abortion Rates

In addition to teen pregnancy rates, the Michigan Department of Health and Human Services also tracks teen abortion rates. The city of Detroit had the highest rate at 26.3; there was a reported 652 abortions for the teen female population of 24,763 in 2014. When excluding Detroit, Wayne County had a teen abortion rate of 13; when including Detroit, Wayne County had a teen abortion rate of 18.7. The county with the next highest abortion rate was Macomb at 10.1; there were a reported 264 abortions for the 26,060 females between 15 to 19 in the county. The county with the lowest abortion rate was Monroe at 3.7. Michigan had a teen abortion rate of 8.6 in 2014 and the only other county in the region above that rate was Oakland County with a teen abortion rate of 8.8 ( 340 reported abortions for a population of 38,676).

The ability to view the abortion rates by county over a length of time was not made available by the Michigan Department of Health and Human Services. DrawingDetroit will continue pursuing these data.