Wayne County Top in the Region for Injury, Crash Rates for Pedestrian and Bicycle-Vehicle Crashes

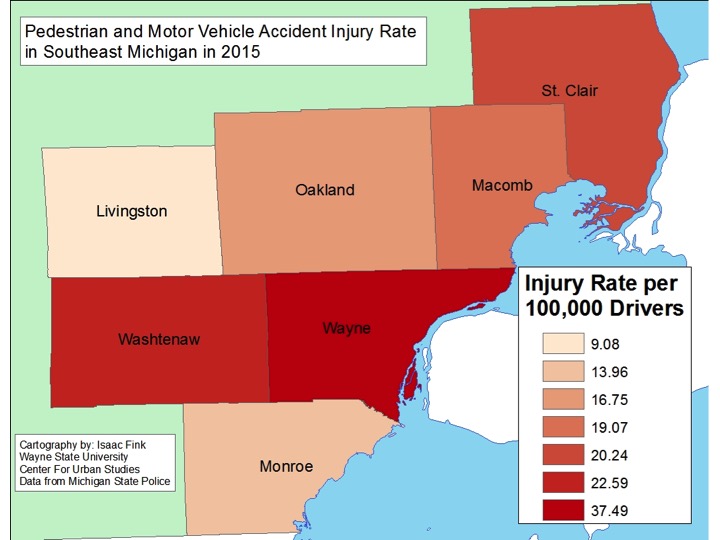
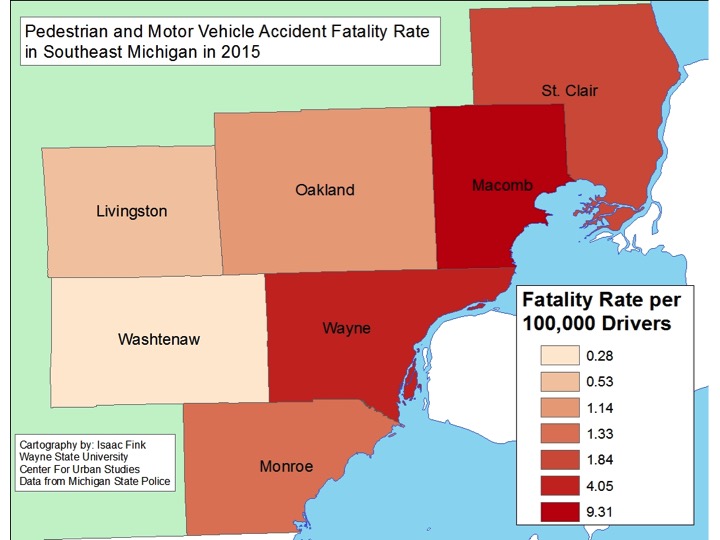
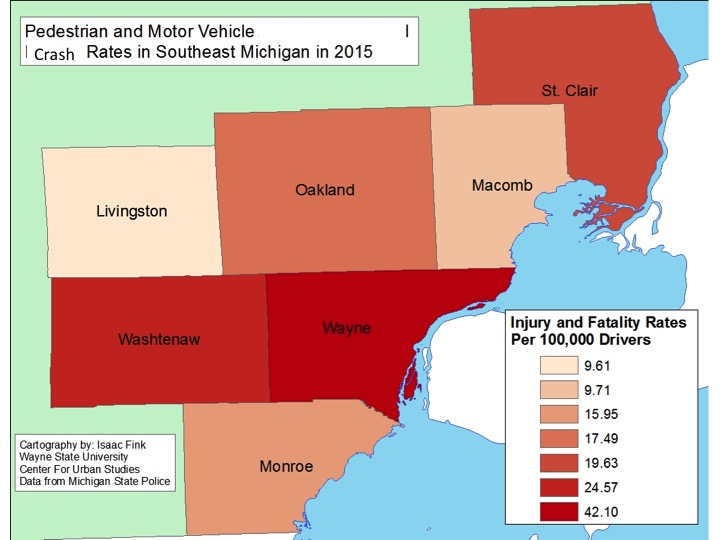
This post presents the rate of injuries and fatalities for vehicle crashes involving pedestrians and bicycles in all counties throughout Southeastern Michigan in 2015, according to the Michigan State Police. The rates in this post were calculated per 100,000 residents.

Wayne County had the highest injury and total crash rates for both pedestrian-vehicle crashes and bicycle-vehicle crashes. In total, Wayne County had a pedestrian-vehicle injury rate of 37 and a total pedestrian-vehicle crash rate of 42. These rates represent a total of 667 pedestrian-vehicle injuries in 2015 in Wayne County and 749 total pedestrian-vehicle crashes in Wayne County in 2015, according to the Michigan State Police. When examining the rate for pedestrian-vehicle fatalities, Macomb County had the highest rate in the seven county region at 9. In Macomb County in 2015 there were a total of 15 fatalities involving a pedestrian and a vehicle. Wayne County had a total of 72 fatalities from the same type of vehicle accident; this was equivalent to a rate of 4. Livingston County had the lowest rate of fatalities and injuries, with rates of 0.5 and 9, respectively.

Slide03

Slide04

Slide05

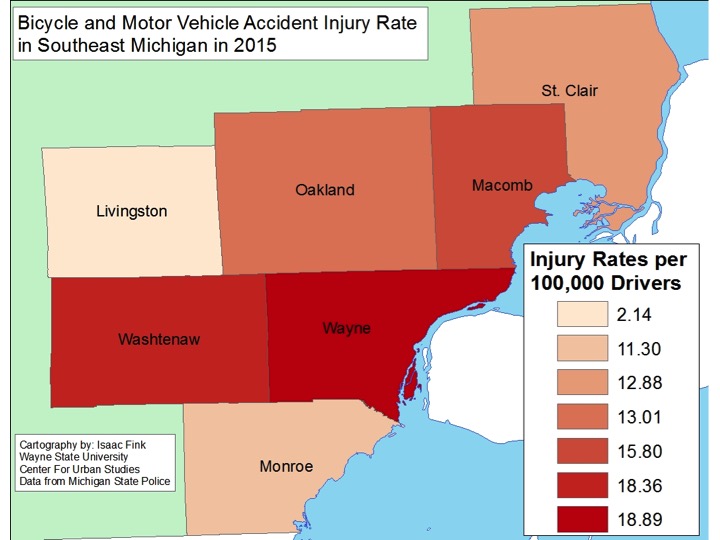
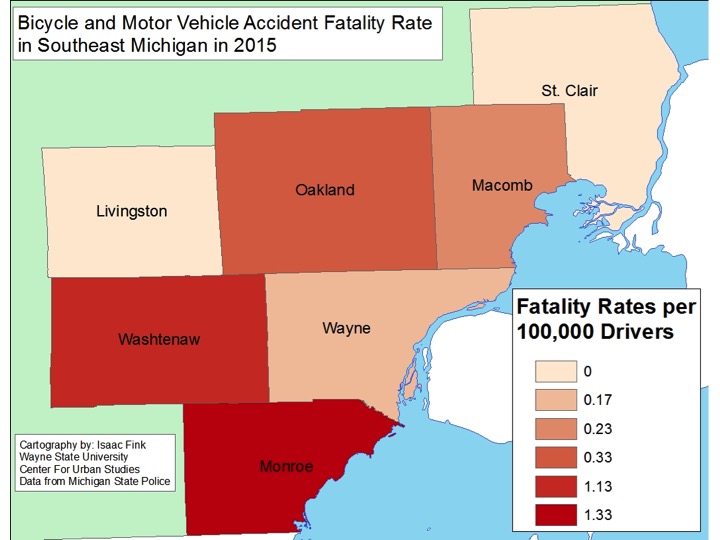
As noted earlier, Wayne County had the highest bicycle-vehicle injury rate in the region at 18.9 per 100,000 residents, with Washtenaw County only slightly behind at 18.4. When looking at the raw data though, there was a total of 336 bicycle-vehicle crashes in Wayne County, there was 72 in Washtenaw County. Monroe County had the highest bicycle-vehicle fatality rate at 1.3 per 100,000 residents with a total of 2 fatalities caused by such accidents in 2015. Washtenaw County came in just below Monroe County with a rate of 1.1 with a total of 4 bicycle-vehicle fatalities; there were also 4 bicycle-vehicle crash related fatalities in Oakland County in 2015 with a rate of 0.3. Livingston and St. Clair counties had zero related bicycle-vehicle related fatalities.

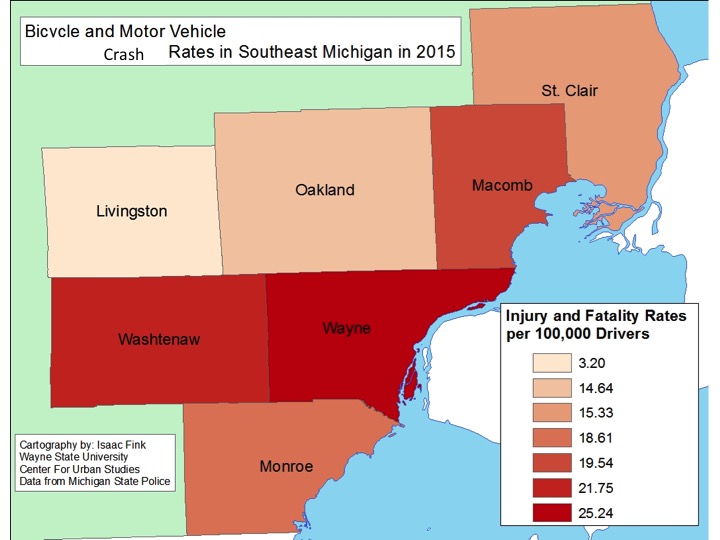
For the total crash bicycle-vehicle crash rates, Wayne County had the highest at 25 per 100,000 residents, with a total of 449 crashes. Livingston County had the lowest rate at 3 with a total of 6 bicycle-vehicle crashes.

Slide07 Slide08 Slide09

According to Smart Growth America, the Metro-Detroit area is ranked 17th of 104 nationwide metropolitan areas for most dangerous areas for pedestrians, due to the number of pedestrian deaths in the region between 2005-14. This study cited street design as one of the reasons for the total number of deaths. Additionally, the Macomb Daily recently cited distracted driving as a reason for the increased number of vehicle related fatalities, including pedestrian and bicycle related ones, over the last several years. This article said distracted driving included cell phone use and being under the influence of drugs and alcohol.

Where Did the Vote Break in Southeastern Michigan?

Republican areas saw marginally increased turnout between the 2012 and 2016 Presidential elections increased. The focus of that increase was southern Macomb County and the Downriver area in Wayne County. Conversely, the traditionally Democratic areas in Wayne County experienced some of the largest voter turnout decreases. Detroit saw especially large decreases.

Slide03

In Macomb County, eight of the communities experienced a voter turnout decrease between the 2012 and 2016 Presidential elections. It was Chesterfield Township that experienced the largest decrease in the county at 5.35 percent while Ray Township experienced the largest increase at 2.46 percent. Although Warren and Sterling Heights have been noted for having several precincts flip from Democratic to Republican between the two Presidential elections, both cities had areas that remained Democratic in 2016. Sterling Heights experienced a 2.7 percent voter turnout decrease in 2016 and Warren experienced a 1.5 percent decrease. St. Clair Shores is another city in southern Macomb County that flipped from Democratic to Republican and here voter turnout increased by 1.6 percent.

While the changes are complicated, it appears that areas in the county to the south that shifted to the GOP are also areas where turnout declined. Likely Democrats would have benefitted by a better Get Out The Vote (GOTV) campaign.

Slide06

In Oakland County we have highlighted how higher income communities like Bloomfield Hills and Birmingham flipped from being Republican in the 2012 presidential election to Democratic in the 2016 election. These communities though experienced a voter turnout decrease between the two elections, as did majority of the Oakland County communities that went Democratic in 2016. With the exceptions of Ferndale, Madison Heights and Clawson, all of the Democratic communities experienced a voter turnout decrease in 2016. Ferndale had the largest voter turnout increase in the county at 11.6 percent while Berkley had the largest decrease at 23.7 percent.

Republican communities in Oakland County weren’t exempt from experiencing a voter turnout decrease in 2016, however the decreases weren’t as widespread or large.

Slide08

Wayne County communities experienced some of the largest decreases in voter turnout in 2016, with Inkster experiencing a 26 percent decrease, River Rouge experiencing a 23 percent decrease and Redford and Detroit experiencing 11 percent decreases, each. Again, these communities all went Democratic in the 2016 election; they also went Democratic in the 2012 election.

Throughout much of Downriver though, an area that flipped from Democratic to Republican, an increase in voter turnout occurred. In that area, Rockwood had the largest increase at 7 percent. The city of Flat Rock did flip from Democratic to Republican between the two elections, but experienced a 16.36 percent voter turnout decrease.

Hamtramck and Highland Park experienced the largest voter turnout increases in Wayne County; Hamtramck had a 12 percent increase and Highland Park had an 11 percent increase. Both cities went Democratic in the 2012 and 2016 elections.

Slide10

In Washtenaw County, Ann Arbor Township had the highest voter turnout increase at 3.37 percent; this community went Democratic in both elections. The only Washtenaw County community that went Democratic in the 2016 election and experienced a voter turnout increase was Sylvan Township; it had a 0.37 percent increase. There were several Republican communities in Washtenaw County too though that experienced voter turnout increases. For example, Northfield Township experienced a 19.6 percent voter turnout decrease.

Slide12

Overall, the data shows that there were very few communities in Southeastern Michigan that experienced large voter turnout increases (above 10 percent). The marginal increases though occurred in areas that went Republican in the 2016 Presidential election, particularly in northern Macomb County, St. Clair County and the Downriver area in Wayne County.

Communities with Higher Non-White Populations Tend to Remain Democratic

Several of the areas that flipped from Democratic to Republican from the 2012 to 2016 Presidential Elections had populations composed of 15 percent or less non-white populations. There were exceptions to this though in areas in Southern Macomb County and Romulus in Wayne County. The Southeastern Michigan regional map below also highlights that Republican areas, in both elections, almost exclusively had populations where 15 percent or less of the residents were non-white.

Detroit, Highland Park and Royal Oak Township, had the highest percentages of non-white residents and also went Democratic in both elections.

Slide03

In Warren the non-white population is 26 percent, and it was here and in Sterling Heights were several precincts flipped from Democratic to Republican in Macomb County. Sterling Heights’s non-white population is 16 percent. Portions of Roseville also flipped from Democratic to Republican and here the non-white population is 23 percent.

Of the Macomb County communities with several of precincts that flipped, St. Clair Shores had the lowest percentage of non-white residents at 8 percent. These communities that flipped also had middle-class incomes, as shown in our previous post.

Slide05

In the areas in Oakland County that flipped from Republican to Democratic (Birmingham, Bloomfield Hills) the percentage of the non-white population typically ranged between 10 and 25 percent. Of those communities, West Bloomfield had the highest percentage of non-whites at 25 percent.

As shown in our previous post, these areas also had some of the highest median incomes in the region.

Of the communities in Oakland County that had several precincts that remained Republican in both elections, Novi and Troy had the highest percentage of non-white populations, 14 and 31 percent, respectively.

Communities that remained entirely Republican across both elections varied substantially from many that had less than ten or even 5 percent non-white to a few precincts that had between 10 and 50 percent non-white residents.

The City of Southfield had the highest percentage of non-white populations of the communities that remained Democratic at 75 percent.

Slide07

Highland Park and Detroit had among the highest non-white populations in both the region and the state. Both of these communities, along with several others surrounding them (River Rouge, Ecorse, Redford, etc.) went Democratic in the 2012 and 2016 elections. As we’ve highlighted throughout this series, the Downriver area had several communities flip from Democratic in 2012 to Republican in 2016. These communities have mid-range incomes, and the majority, with the exception of Brownstown and Taylor, had non-white populations below 15 percent. Brownstown had a non-white population of 16 percent and Taylor had one of 23 percent.

Slide09

Pittsfield, Superior and Ypsilanti had the highest percentages of non-white populations in Washtenaw County, with the City of Ypsilanti having the highest at 38 percent. It was Lima, Sylvan and portions of Dexter, Webster, Lodi and Pittsfield townships that flipped from Republican to Democratic between the two elections. Pittsfield had the highest percentage of non-white populations of these communities at 37 percent and Webster had the lowest at 3 percent.

While there were portions of Dexter that flipped Democratic, there were also portions that flipped Republican. The township’s non-white population stands at 3 percent. However in Augusta and Lyndon, two communities that flipped entirely Republican, the non-white population percentages were 14 and 10 percent, respectively.

Slide11

Our last post showed that majority of the communities that flipped from Democratic to Republican had mid-range incomes. In this post the data does not show a consistent trend on the racial makeup of communities that flipped. For example, in Southern Macomb County, Warren, Roseville, Sterling Heights and Clinton Township all had non-white populations above 15 percent while in the Downriver communities in Wayne County majority had non-white populations below 15 percent (Taylor and Brownstown were the exception).

One trend this post did show though was that communities with non-white populations above 25 percent went Democratic in both elections. On the opposite end of the spectrum, areas that stayed Republican across both elections almost always had populations where 15 percent or less of the residents were non-white.