Detroit, St. Clair County have highest confirmed rate of child abuse/neglect victims in the region

From 2009 to 2013, St. Clair County consistently had the highest rate of confirmed victims of child abuse and/or neglect in the seven county region, according to the Michigan League for Public Policy and Kids Count (these organizations obtained their data from the Michigan Department of Human Services). However, for four of those five years, Detroit’s rate of confirmed child abuse/neglect victims far exceeded that of St. Clair County.

All rates discussed in this post are per 1,000 children ages 0-17, unless otherwise noted. These numbers reflect an unduplicated count of children in a given fiscal year where the alleged abuse or neglect was confirmed after an investigation, according to the Michigan Department of Human Services.

The map above shows the rate and number of confirmed victims of child abuse/neglect for the region in fiscal year 2013. Detroit, which is the only Michigan city with such information available through the data source, had a higher rate than the counties (19.2) in 2013. This rate of 19.2 confirmed victims of abuse and/or neglect per 1,000 children ages 0-17 was equivalent to 3,410 total cases.

As already noted, St. Clair County had the highest child abuse/neglect victim rate of the counties in the region in 2013 at 15.8; this was 557 confirmed victims.

In 2013, Oakland County had the lowest child abuse/neglect victim rate in the region. The rate was 6.2, which equaled 1,723 confirmed victims.

The rate of confirmed child abuse/neglect victims for the State of Michigan in 2013 was 14.9 per 1,000 children.

With the exception of 2010, from 2009 to 2013, Detroit had higher rates of confirmed child abuse/neglect victims than the counties in the region. In 2010, St. Clair County had the highest rate at 16.9 per 1,000 children; Detroit’s rate was 15.8 per 1,000 children at that time. Additionally, Detroit experienced its largest rate increase between 2012 and 2013; the rate increased from 16.7 to 19.2 per 1,000 children. Between 2012 and 2013, Macomb, Oakland, and Monroe counties were the only ones that did not experience a rate increase. Between 2012 and 2013, Macomb County’s rate remained the same at 8.2, while Monroe County’s rate decreased from 12.2 to 11.1 and Oakland County’s rate decreased from 6.4 to 6.2.

Macomb and Oakland counties were the only counties in the region that experienced rate decreases between 2009 and 2013.

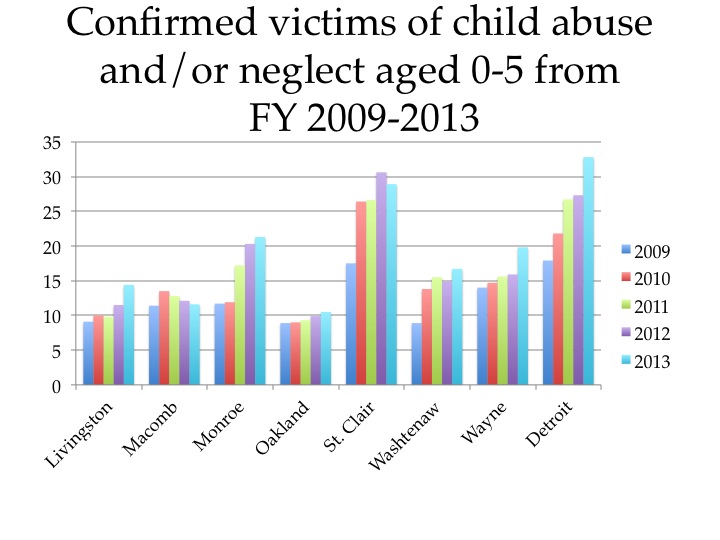
In the above chart, we look at the rate of confirmed child abuse/neglect victims for children between the ages of 0-5 in the region. Again, we see that Detroit and St. Clair County had the highest rates. In 2013, Detroit’s rate was 32.8, while St. Clair County’s was 28.9 per 1,000 children. In 2009, 2010, and 2012, St. Clair’s rates (17.5, 26.4, 30.6, respectively) were higher than Detroit’s (17, 21.8, 27.3, respectively).

For all the years examined, Oakland County had the lowest confirmed child abuse/neglect rates in the region for children ages 0-5. In 2009, its rate was 8.9 and by 2013, its rate had increased to 10.5. Overall, there was a general trend of rate increases across the region. Detroit had the largest rate increase between 2009 and 2013; its rate increased by 15.8 in that five-year time frame.

Although Macomb County’s rate increased by 2.1 between 2009 and 2010, it is the only county in the region that experienced a consistent downward trend in the confirmed child abuse/neglect victim rate between 2010 and 2013, leaving it only .2 points higher than its 2009 rate. Of the counties examined, this was the closest any county in 2013 was to its rate in 2009.per 1,000 children in 2010. But since 2010 the rate has decreased each year.

NYT: Home-price growth driven by multiple economic factors

A recent graph produced by the New York Times shows that while home prices are bouncing back across the U.S. there are different factors driving those increased prices. For Detroit, the cost of purchasing a home is increasing by the lack of supply while in Grand Rapids price is being driven up because of demand. To see the full economics on the growth of home prices in metropolitan areas in Michigan and across the U.S. click here to see the NYT graph based off of a report by Fitch Ratings.

More than 50 percent of Wayne County children on Medicaid

Medicaid and MI Child are two different programs that provide children in the state of Michigan with the opportunity to have health care coverage. Medicaid is a federal health care coverage program that provides services to about 43 million children nationally; it is jointly funded by the federal government and each state. In Michigan, a child is automatically referred to the Healthy Kids Medicaid Program (Michigan’s child Medicaid program) if their family’s annual income is at or below 150 percent of the Federal Poverty Level, according to the Michigan Department of Community Health.

MI Child is Michigan’s version of the Child Health Insurance Program (CHIP), a federal initiative created by Congress in 1997 that is offered to uninsured children, ages 19 and below, of working parents. This program is also jointly funded by the federal government and states but its match rate, according to Medicaid.gov is typically about 15 percent higher than Medicaid; according to the Michigan League for Public Policy funding for this program is currently at risk. According to the Michigan League for Public Policy, this program was created to provide children with quality healthcare when their family earns too much to qualify for Medicaid but cannot afford private coverage. To qualify for MI Child, the child must have no comprehensive health insurance and the parents must have a gross adjusted income between 160-212 percent of the Federal Poverty Level, according to the MI Child Manual. For a family of four to be eligible for MI Child, the annual income limit is $47,700, according to the Michigan Department of Community Health.

In the maps below we see that there is a higher percentage of children covered by Medicaid in Southeastern Michigan than on MI Child. Also, while Wayne County had the highest percentage of children on Medicaid, Macomb County had the highest percentage of children with MI Child as their health insurance coverage plan. Overall though, each county had a higher percentage of children with Medicaid coverage than with MI Child coverage. This means that among those who applied for government health care coverage for their child, there was a higher percentage of families with income levels at or below 160 percent of the Federal Poverty Level than families with a gross income level between 160-212 percent of the Federal Poverty Level.

In the seven county region of Southeast Michigan, Wayne County had the highest percentage of children with Medicaid coverage in 2013, according to the Michigan League for Public Policy. In total, 55.5 percent of children aged 19 and under in Wayne County received Medicaid coverage in 2013. This amounted to about 258,000 children. The county with the second highest percentage of children receiving Medicaid coverage in the region in 2013 was St. Clair (42 percent or approximately 16,250 children).

Livingston County had the lowest percentage of children receiving Medicaid coverage with 18.5 percent in 2013. That same year, 40.8 percent of Michigan children received Medicaid coverage.

As noted, MI Child is Michigan’s version of the CHIP initiated by Congress in 1997 to provide healthcare to children who don’t qualify for Medicaid but whose families cannot afford private insurance. In the region, the percentage of children with MI Child coverage is smaller than those with Medicaid. For example, Macomb County had the highest percentage of children with MI Child coverage in the region in 2013 at 2.4 percent. During the same time period, 35.8 percent of Macomb County children received Medicaid coverage. Of the counties examined, Washtenaw County had the lowest percentage of children aged 19 and under receiving MI Child coverage in 2013 at .9 percent.

Retirement benefits lack funding compared to pensions in Southeastern Michigan

For majority of the states and local government entities across the country one of the most attractive pieces of their compensation packages has been the offering of retiree health care, dental and vision insurance after retirement and life insurance. These benefits are referred to as Other Post Employment Benefits (OPEB) and are not part of an employee’s pension fund. According to the International City/County Management Association (ICMA) OPEB packages have traditionally been generous (ie. Offering full medical insurance coverage after retirement) as a way to attract talent, since public sector salaries are typically lower than those in the private sector. While public employers (ie. state and local government agencies) have traditionally funded their pension obligations during the time in which employees are working, majority of OPEB funding isn’t paid for until after employees retire in a pay-as-you-go manner, according to Michigan State University-Extension. In 2007, the Governmental Accounting Standards Board required all U.S. municipalities to measure the OPEB percent funded and unfunded in their community, which had not been required before. Prior to this change, according to ICMA, most government entities had only incrementally calculated what was owed on an annual basis in context to their annual budget. This new accounting standard though forces government entities to examine what their OPEB costs will be over the long-term and how it will affect their budget, especially as the cost of medical care continues to rise. According to research conducted by Michigan State University-Extension, the burden to fund OPEBs has proven to be a financial stressor for many communities in Michigan, and beyond.

The maps below showcase survey data from the public-sector-financial-based website Munetrix.com; not all communities in Southeastern Michigan represented and only the data discussed below if representative of the communities’ whose information was made available on the website. According to available data, 99.7 percent had 80 percent or less of their OPEB liabilities funded in 2012 while 62 percent of communities with available 2012 pension funding data had 80 percent or less of their defined pensions funded. While there is no single number for whether an OPEB, or pension fund, is healthy or unhealthy there are frequent references in the accounting world that if such a fund is funded at 80 percent or higher it is considered healthy, according to a 2007 Government Accountability Office report. The lack of funding of OPEB obligations above 80 percent compared to pension funding above 80 percent is not unique to Southeastern Michigan, or the communities throughout the state, at all. Rather this is a growing problem communities across the country are trying deal with, according to Michigan State University-Extension.

As noted above, and as can be seen in the maps, more data was provided on pension funding than OPEB funding by Munetrix. Just as data lacks on OPEB funding so does the percent of such funded liabilities. In the region in 2012, according to the data presented, the city of Holly had the highest percent of OPEB funding at 121 percent; Macomb Township came in second to with62.9 percent. Several of the communities with information available had 0 percent of their OPEB liabilities funded. These communities were:

  •   Flat Rock
  •   Grosse Ile
  •   Grosse Pointe Woods
  •   Hamtramck
  •   Harper Woods
  •   Lincoln Park
  •   Clawson
  •   Memphis
  •   Fraser

For 2012, OPEB funding information was not available on the city of Detroit through Munetrix. However, through court documents related to the City of Detroit’s bankruptcy filing , in 2011 Detroit’s OPEB liability was 99.6 percent unfunded; the total OPEB liability at that time was $5.7 billion. Before bankruptcy proceedings were complete, the city had 22 different OPEB related plans, 15 of which were directly related to medical and prescription drug care. Since Detroit came out of bankruptcy its retiree healthcare benefits are funded through two Voluntary Employment Benefits Association trusts. In total, it is estimated these funds will have $450 million put into them to fund the city’s OPEB, according to the Detroit News.

Also when viewing the pension map we see that information for the city of Detroit was not provided for this as well. The city has two pension systems, the general employee pension system and the police and fire system. According to the bankruptcy documents, by the end of 2011 the city owed $1.7 billion to the general employee system and $1.6 billion to the police and fire system.

As Detroit exited bankruptcy in 2014, according to the New York Times, the general employee pension system was 74 percent funded and the fire and police system was 78 percent funded. From now through 2024 the city will not contribute to the pension fund from general fund dollars. Instead, revenues from the Detroit Water and Sewerage Department, settlement monies from general-obligation bondholders and donations from foundations and the state (as part of the “grand bargain“) will fund the pension system, according to the Detroit News.

When looking back at the communities that did have pension data available for 2012 we see that 38 of the 98 had their pension systems funded at 80 percent of above. Of those, the communities below had their pension systems funded above 100 percent:

  • Dearborn
  • Rockwood
  • Lima Township
  • Northfield Township
  • Marine City
  • Ferndale
  • Groveland Township
  • Royal Oak Charter Township
  • Erie Township
  • Brighton Township

Of the communities that had their pension liabilities funded below 80 percent in 2012, Lincoln Park had the lowest at 34.6 percent.

NYT: Transportation a key factor in escaping poverty

A recent article from The New York Times highlights a Harvard study that finds access to transportation is a strong factor in escaping poverty. According to the article, the link between transportation and social mobility is stronger than the relationship between social mobility and crime, education, or family makeup. To read more about this study click here for The New York Times article.

Michigan and Detroit’s unemployment decreases while home values continue to increase

  • From February 2015 to March 2015, the unemployment rate across the state and in the City of Detroit’s decreased (monthly);
  • The Purchasing Manager’s Index for Southeast Michigan increased from March 2015 to April 2015 (monthly);
  • Commodity Price Index increased from March 2015 to April 2015 for Southeast Michigan (monthly);
  • Standard and Poor’s Case-Shiller Home Price Index for the Detroit Metropolitan Statistical Area shows home prices have been increasing since September.

According to the most recent data provided by the Michigan Department of Technology, Management, and Budget, the unemployment rate for the state of Michigan decreased from 5.8 percent in February to 5.7 percent in March. During this same period, unemployment in the city of Detroit also decreased from 12.5 in February percent to 11.7 percent in March.

From February to March, the number of people employed in the city of Detroit decreased by 300, leading to a total of 209,417 people employed in March.

The above chart shows the number of people employed in the auto manufacturing industry in the Detroit Metropolitan Statistical Area (MSA) (Detroit-Warren-Livonia) from January 2014 to January 2015. From February to March the number of people employed in this industry declined by 600, to a total of 106,500. This is the first time employment in this industry in the Detroit Metropolitan Statistical Area has dropped since July of 2014. Despite the decline, March had the second highest number of people employed in the auto manufacturing industry in the last year; February had the highest number.

The Purchasing Manger’s Index (PMI) is a composite index derived from five indicators of economic activity: new orders, production, employment, supplier deliveries, and inventories. A PMI above 50 indicates the economy is expanding.

According to the most recent data released on Southeast Michigan’s Purchasing Manager’s Index, the PMI for April 2015 was 66.3, an increase of 1.8 points from the prior month. It was also an increase of 10 from April of 2014.

The Commodity Price Index, which is a weighted average of selected commodity prices, was recorded at 57.9 points in April 2015, which was 7.9 points higher than the previous month and 6.4 points lower than April 2014.

The above charts show the Standard and Poor’s Case-Shiller Home Price Index for the Detroit Metropolitan Statistical Area. The index includes the price for homes that have sold but does not include the price of new home construction, condos, or homes that have been remodeled.

According to the index, the average price of single-family dwellings sold in Metro Detroit was $98,400 in February 2015. This was an increase of approximately $5,000 from the average price in January 2014. Since February of 2014, prices have increased by $3,590.