America’s obesity problem is not only causing problems for people’s health, but also on their wallets. According to American Public Health Association, the direction cost of obesity in the United States is $152 billion that is spent on related health care; this epidemic also indirectly costs the nation about $73 billion a year for things like lost work time. However, the APHA announced the obesity rate has been declining in past years because of healthier food options in school, safe school routes, and other items that promote a safe environment. The APHA said when children live in safe neighborhoods they feel comfortable with playing outside, meaning they will get more physical activity. To learn more click here (click the infographic to enlarge it).
Monthly Archives: January 2014
Detroit’s police force above 3 officers per 1,000 residents
In the following post, we will examine the number of sworn officers-which includes police officers, sheriff’s deputies and public safety officers-per 1,000 residents in the seven county region of Southeastern Michigan. As can be seen in the below maps, there are several municipalities that do not have their own police force. These are either patrolled by the county sheriff’s department or have a public safety department, which is comprised of both police and fire personnel.
The maps and graph below both show that the City of Detroit had one of the highest number of sworn officer per 1,000 residents of municipalities in the region. According to a local law enforcement chief, who serves on the Southeast Michigan Association of Police Chiefs, it is unofficially recommended there should be a minimum of one sworn police officer per 1,000 residents in municipalities.
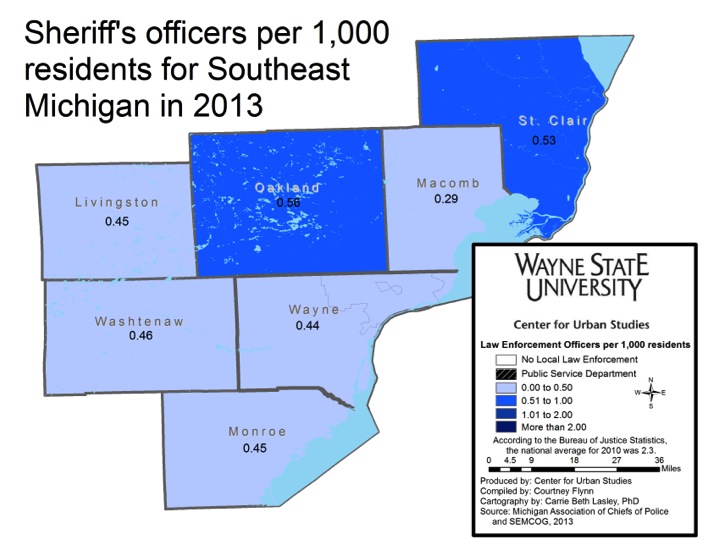
The above map shows there is less than one sheriff’s deputy per 1,000 residents in every county in Southeastern Michigan. These figures were determined by taking the total number of sheriff’s deputies in each county department and dividing it by the total population of each county; these results were then multiplied by 1,000.
Oakland and St. Clair counties had the highest rates at .56 and .53 per 1,000 residents, respectively.
While no county in the region holds up to the one sworn officer per 1,000 residents standards, it should be noted that many municipalities within each county either have their own police department or pay the sheriff’s department for coverage. The county sheriff’s departments are required to cover areas with no police coverage.
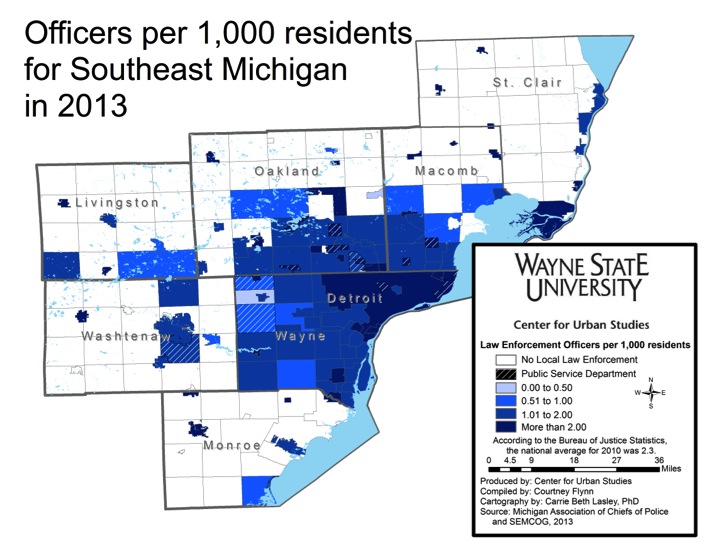
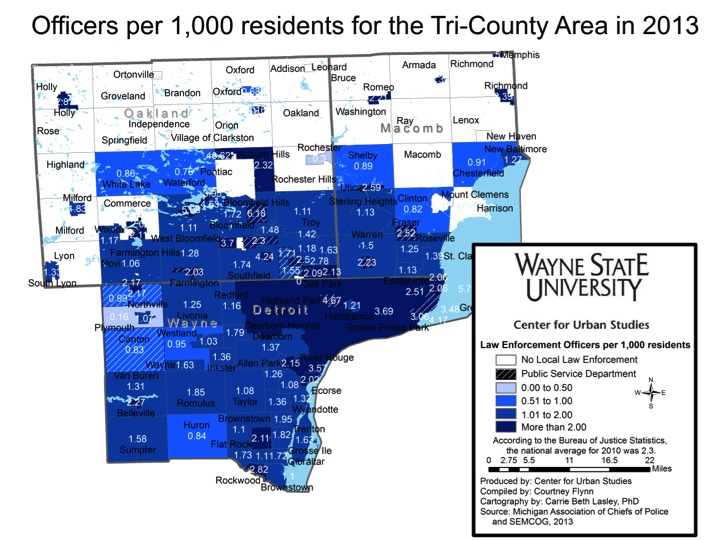
The above two maps show the number of local law enforcement officers per 1,000 residents in 2013. The City of Detroit was one of 104 municipalities (out of 123) in the seven-county region to have more than one officer per 1,000 residents. In 2013 there were about 3.7 officers per 1,000 Detroit residents.
The Lake Angelus Police Department had the highest rate at about 43 officers per 1,000 residents. However, this small lakeside community only had 298 full-time residents with 13 total sworn officers. Aside from this anomaly, Lake Orion had the highest rate in 2013 with a rate of 5 sworn officers per 1,000 residents.
Within the seven county region, areas such as South Rockwood (6.3) and Yale (5.7) had well above the suggested number of officers per 1,000 residents, assuming the 1 per 1,000 is an appropriate benchmark.
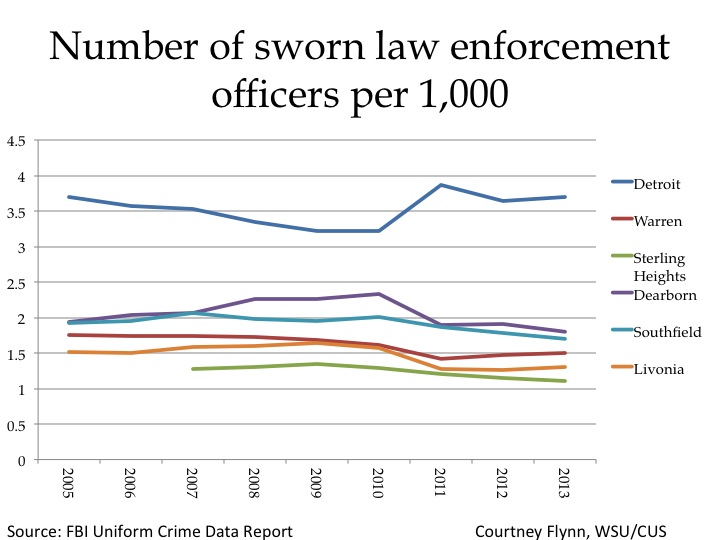
Of six of the largest communities in the in Tri-County region, Detroit has consistently had the highest number of sworn officers per 1,000 residents since 2005, according to FBI data. The rate of officers in this time ranged from 3.2 to about 3.9.
In January of 2013 Interim Police Chief Chester Logan stated he was skeptical about releasing, then current, officer numbers, according to an MLive article. In the same article, Logan also said the city had 40 percent fewer officers at the beginning of 2013 than 10 years prior. While this statistic has since been widely used throughout the media, it also caused some to dig deeper into the operations of the department.
In an August 2013 article produced by the Mackinac Center for Public Policy, confusion over the deployment of Detroit’s patrol officers were brought to light. For example, city officials were quoted in August of 2013 as saying 33 percent of the entire department in 2012 were involved in policing and the rest performed administrative functions. Police officials were quoted, however, as saying that 68 percent of the department was involved in policing in 2012.A report conducted by the Emergency Manager’s Office in the summer of 2013 concluded the discrepancy could not be resolved, according to the article.
While the discrepancy over the use of police has not been resolved, it should be noted the Detroit Police Department has benefited from several grants in recent years. For example, in September 2013 the federal government announced it was providing the City of Detroit with $1.8 million to help pay for 10 police officers. Other grants awarded to the city helped with purchasing new technology for the police department and violence prevention programs.
In 2011, all the above police departments experienced a decrease in the rate of officers per 1,000 residents, with the exception of Detroit. In 2010 the City of Detroit had 3.2 officers per 1,000 residents and in 2011 it had 3.8. Detroit’s rate increase though was not reflective of an increase in the number of officers, but a decline in the population. This is true for all police departments, except for Warren, from 2010 to 2013 in the above chart.
Since 2011, Warren and Livonia have experienced a rate increase. The two cities have been able to sustain their police forces, and increase their officer to population ratio, through increased taxes and department reorganizations. In August of 2012 Warren voters approved a police and fire service millage. Also in 2012 the City of Livonia continued to reorganize its police department, which brought in additional non-officers to perform administrative duties so more patrol officers could be on the street.
Sterling Heights (data wasn’t available for 2005 and 2006) had the lowest rates, ranging from about 1.1 to 1.3. Although Sterling Heights began to lose officers when the recession began in 2008, because property values were declining, residents approved a millage in 2013 to support the police and fire departments. This millage approval allowed the Sterling Heights Police Department to keep 45 officers on staff that were initially slated to be laid off.
Motor vehicle theft increases while overall property crime rate declines
In addition to violent crimes, the FBI also tracks property crimes on an annual basis. This post shows how property crimes have decreased in both Detroit and the State of Michigan during 2012. Not only have the overall property crime rates decreased, but so have the burglary and larceny-theft rates. Motor vehicle theft on the hand experienced an increase from 2011 to 2012 for the City of Detroit.
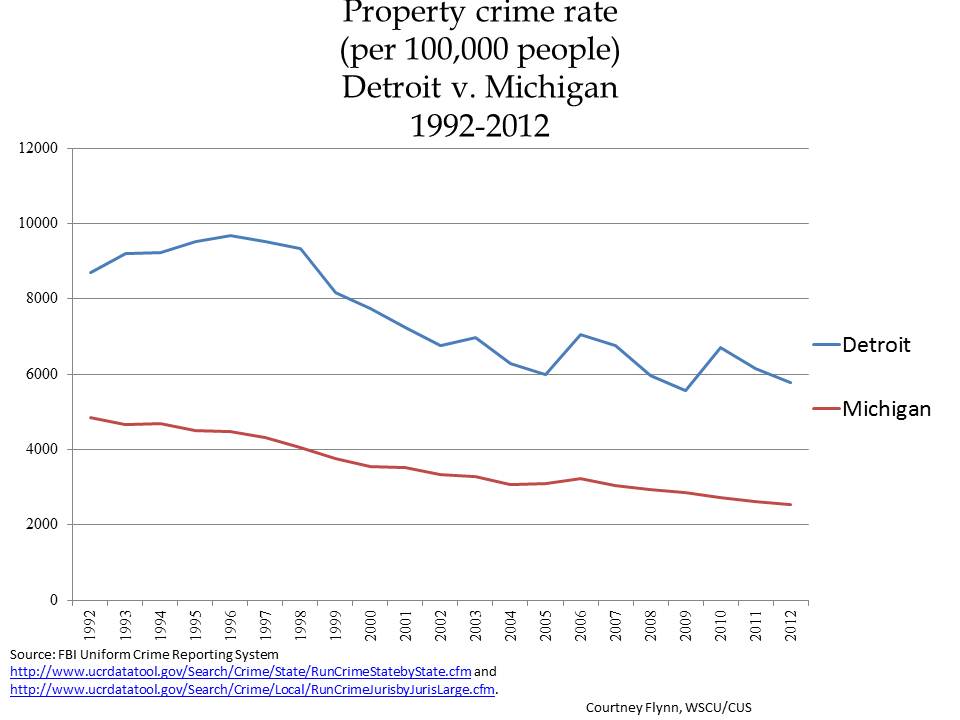
According to the FBI, property crime “includes the offenses of burglary, larceny-theft, motor vehicle theft, and arson. The object of the theft-type offenses is the taking of money or property, but there is no force or threat of force against the victims.”
There was a decrease in the reported property crime rate for both Detroit and Michigan from 2011 to 2012. In 2012, Detroit’s property crime rate was reported at 5,792 compared to 6,143.5 in 2011. Michigan’s property crime rate was reported at 2,530 in 2012, down from 2,621.1 in 2011.
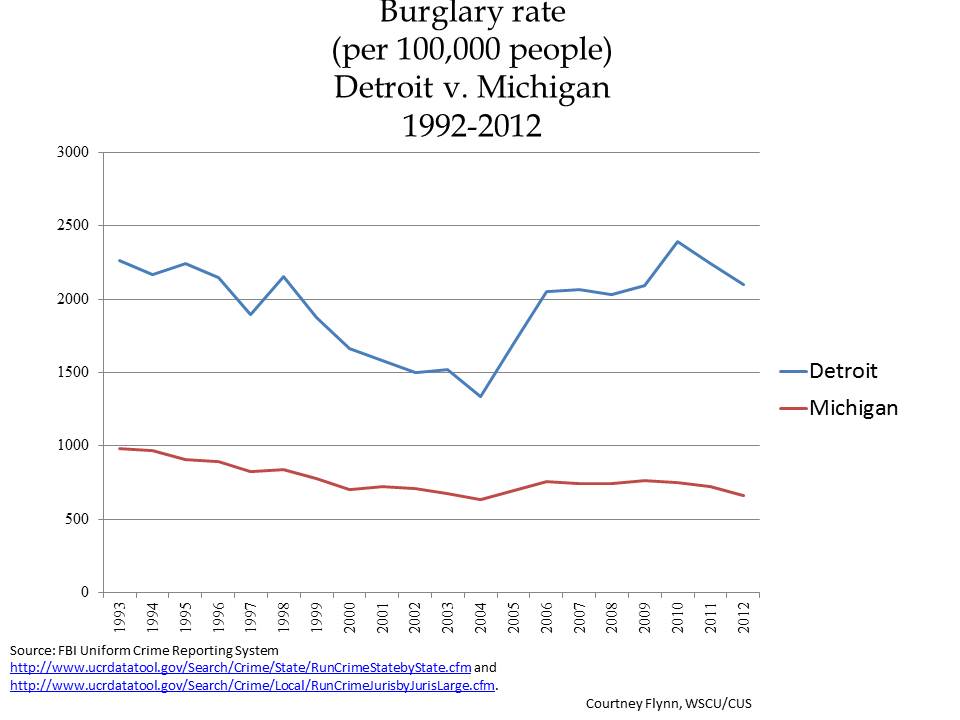
According to the FBI burglary is defined as, “the unlawful entry of a structure to commit a felony or theft. To classify an offense as a burglary, the use of force to gain entry need not have occurred.”
In 2012, both the City of Detroit and the State of Michigan followed similar trends of experiencing a decrease in the burglary rate. In 2012, Detroit’s burglary rate was 2,097.5 compared to 2,242.2 in 2011. Michigan’s burglary rate was 664.4 in 2012 compared to 725 in 2011. Note the increase in the rate with the worsening economic climate after 2005, followed by a decline as the economy improved after 2011.
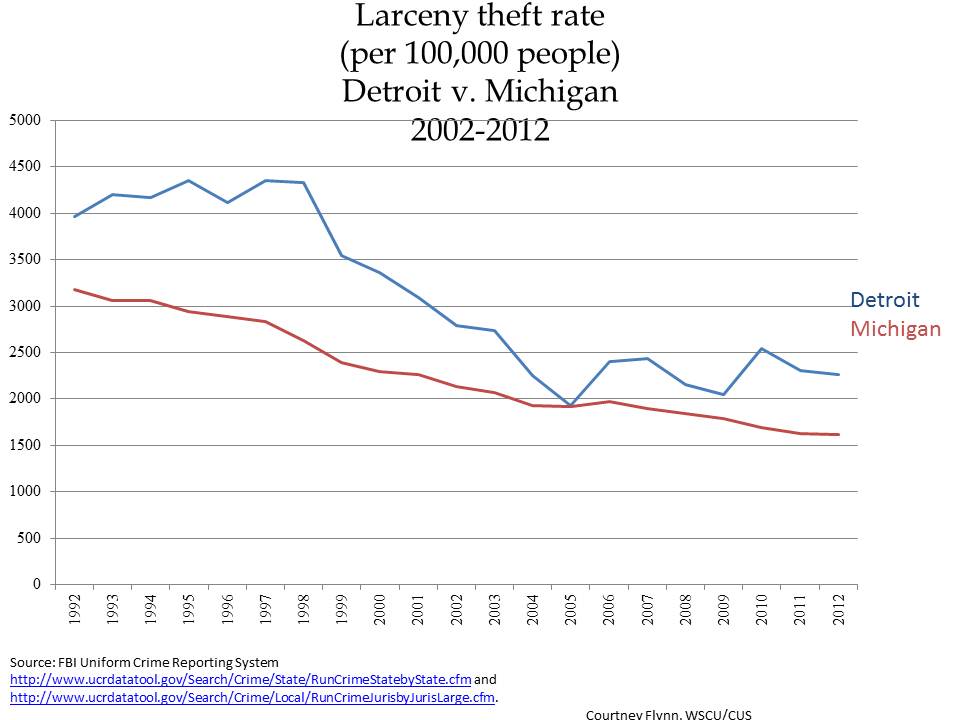
According to the FBI, larceny theft is defined as “the unlawful taking, carrying, leading, or riding away of property from the possession or constructive possession of another.”
In 2012, the larceny rate for Detroit was 2,228.3 and the state’s rate was 1,612; both rates have seen significant declines since 1992.
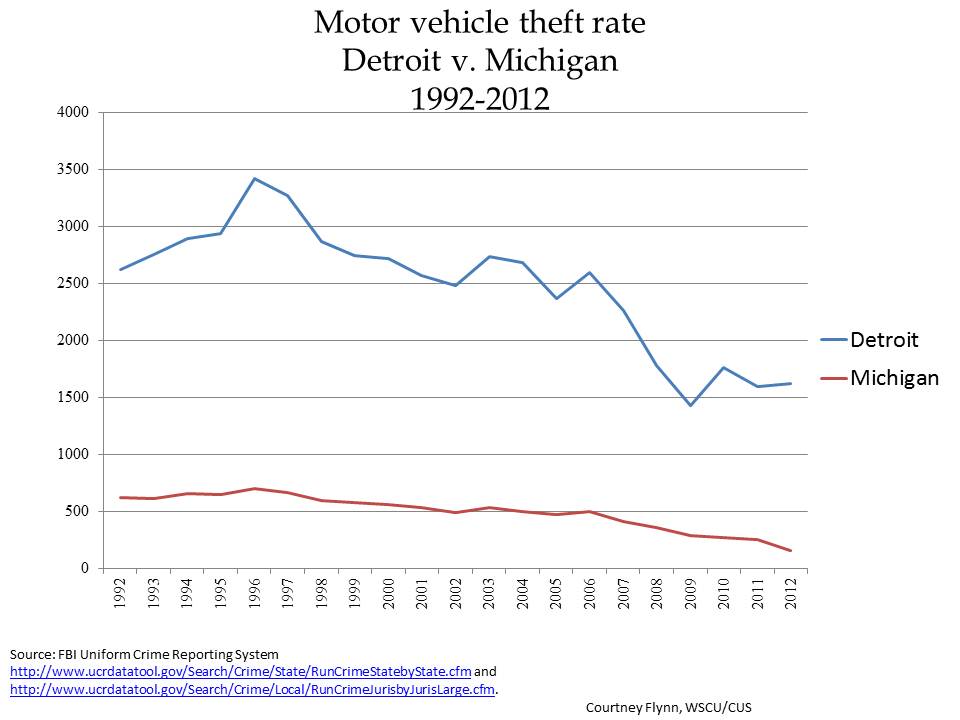
According to the FBI, motor vehicle theft is defined as “the theft or attempted theft of a motor vehicle.”
While the motor vehicle theft rate experienced a decline from 2006 to 2009 it has since increased. In 2012 the motor vehicle theft rate in the City of Detroit was 1,626 and in 2011 it was reported to be 1,594 per 100,000 residents.
The State of Michigan has experienced a steady decline in its motor vehicle theft rates since 2006 (496.6). In 2012 the rate was 157.2.
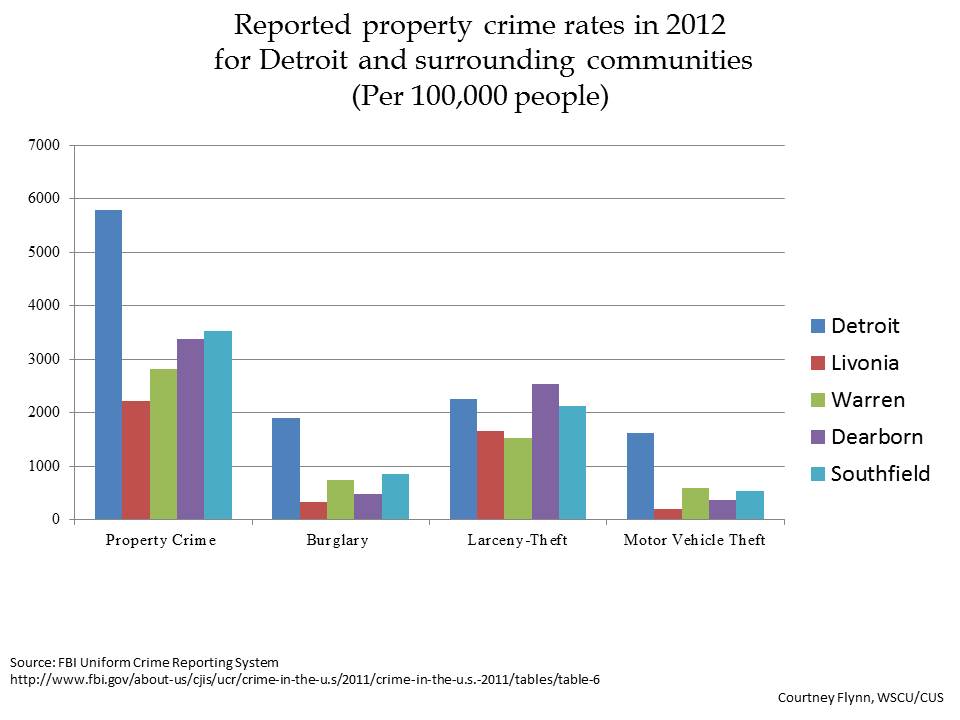
The above chart shows the rate of criminal offenses (per 100,000 people) reported in 2012 for the property crimes addressed in this post for the City of Detroit and the next four most populous cities that are part of the Detroit Metropolitan Statistical Area (MSA). Of the five communities, Detroit had the highest rate of offenses reported for all of the crimes, with the exception of larceny. Dearborn has the highest larceny rate in 2012.
Detroit’s violent crime rates decrease
PLEASE FOLLOW US AT WWW.DRAWINGDETROIT.COM
In the following post, we compare violent crime rates in the City of Detroit with violent crime rates for the State of Michigan as a whole. The categories considered include criminal homicide (used interchangeably with “murder and non-negligent manslaughter” in this post), forcible rape, robbery, and aggravated assault. Unless otherwise noted, all information in the charts was obtained from the Federal Bureau of Investigation’s Uniform Crime Report (detailed information can be found here and here) Each rate is per 100,000 residents.
Overall, with the exception of forcible rape, the City of Detroit’s violent crime rates were higher for each category in 2012 than Michigan’s rates. In addition, from 2011 to 2012, Detroit’s overall violent crime rate slightly decreased while Michigan’s rate increased. This also proved true for the number of homicides in the city from 2012 to 2013, according to the Detroit Police Department.
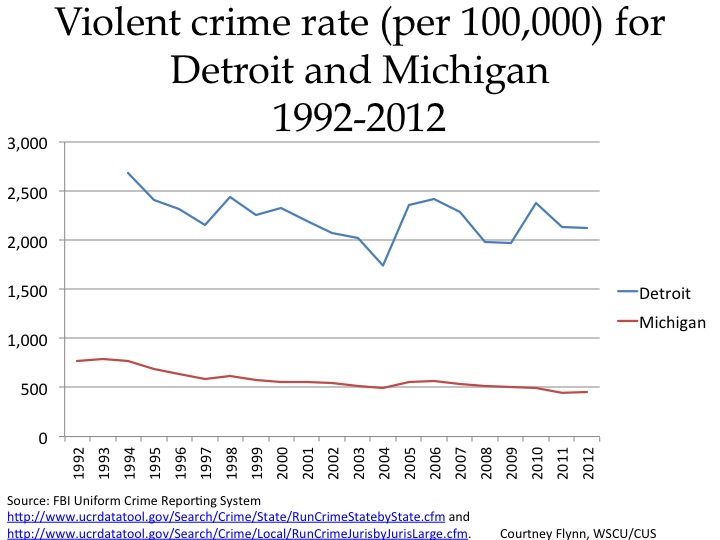
The data provided shows the violent crime rate in Michigan has consistently remained well below the City of Detroit’s rate. For the most part, Michigan’s violent crime rate has been declining since 1994, although there have been a few incidences of increase, most notably from 2011-2012. The state’s violent crime rate was 454.5 in 2012 compared to 445.3 in 2011. These rates are still below the 2010 rate of 490.3.
Detroit’s violent crime rate trend has had more fluctuations than the state’s since 1992. In 2012, the violent crime rate for Detroit was 2,122.9 compared to 2,137 in 2011.
Also, please note no information was provided for Detroit for 1993 because the forcible rape rate is used to calculate the violent crime rate, and in that year the data collection methodology for the offense of forcible rape used by the State Uniform Crime Reporting (UCR) Program did not comply with national UCR Program guidelines. While this rate wasn’t provided by the City of Detroit it was provided for the state by estimating national rates per 100,000 inhabitants within eight population groups and assigning the forcible rape volumes proportionally to the state.
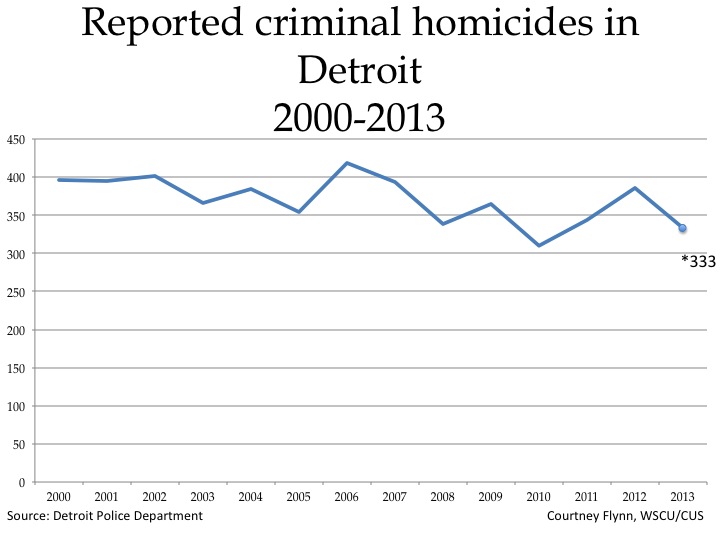
The City of Detroit has touted the decrease of criminal homicides within city limits in 2013. As the chart shows, there has been a decrease, both from 2012 and since 1990. The number of criminal homicide victims in 2013, according to Detroit officials, was 333; in 2102 that number was 386.

According to the FBI, murder and non-negligent manslaughter (a term used interchangeably with “criminal homicide” in this post) is defined as “the willful (non-negligent) killing of one human being by another. The classification of this offense is based solely on police investigation as opposed to the determination of a court, medical examiner, coroner, jury, or other judicial body.”
As with the other crimes examined in this post, the state’s rate remains lower than Detroit’s rate. According to the data, Detroit’s murder and non-negligent manslaughter rate increased from 35.7 in 2008 to 54.6 in 2012 and the state’s increased from 3.7in 2010 to 7.0 in 2012.
When taking the number of reported criminal homicides in Detroit (333) and dividing that number by the Southeast Michigan Council of Governments July 1, 2013 population estimate for the City of Detroit (681,090) and then multiplying it by 100,000, a criminal homicide rate of 48.9 is determine for 2013. This number was not provided by the FBI.

The chart above compares the murder and non-negligent manslaughter rates for Detroit and four of the closest cities to Detroit in the Detroit Metropolitan Statistical Area (this area is defined by the U.S. Census Bureau and is comprised of Lapeer, Livingston, Macomb, Oakland, St. Clair, and Wayne counties). As shown, Detroit’s murder and non-negligent manslaughter rate was 54.6, which was 18 times higher than the city with the next highest murder and non-negligent manslaughter rate (Livonia at 3.1).
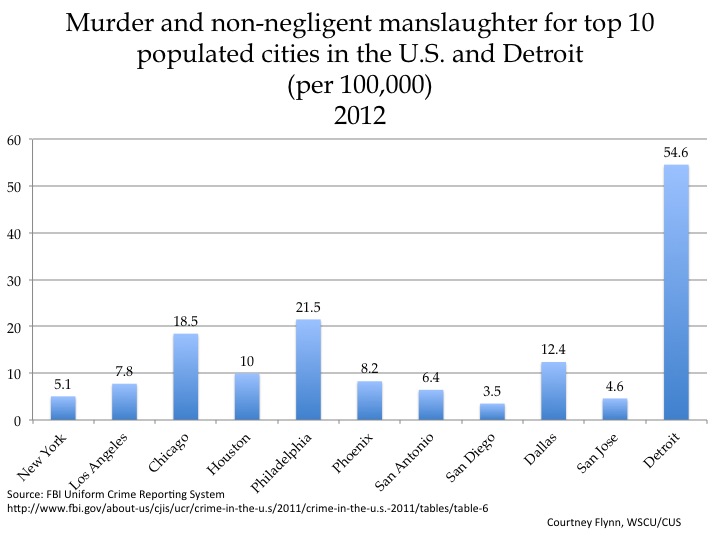
Displayed above are the murder and non-negligent homicide rates for the 10 most populated cities in the U.S. in 2012, along with the City of Detroit (Detroit was not in the top 10). The cities are arranged according to population numbers, highest to lowest from left to right. Among these cities, Detroit had the highest murder and non-negligent manslaughter rate in 2012 (54.6).
Of the U.S.’s top 10 most populated cities, Philadelphia had the highest rate (21.5) and Chicago the second highest (18.5). San Diego (3.5) had the lowest rate.

According to the FBI, forcible rape is defined as “the carnal knowledge of a female forcibly and against her will. Attempts or assaults to commit rape by force or threat of force are also included; however, statutory rape (without force) and other sex offenses are excluded.”
The above chart shows Detroit’s reported forcible rape rate in 2012 (36.2) dropped below the state’s rate (46.4). This was the fourth time Detroit’s rate had been lower than the state’s rate during the years shown (2007-2009 were the other occurrences).
**Data were unavailable for 1993 in Detroit because “data collection methodology for the offense of forcible rape used by the State Uniform Crime Reporting (UCR) Program did not comply with national UCR Program guidelines.”
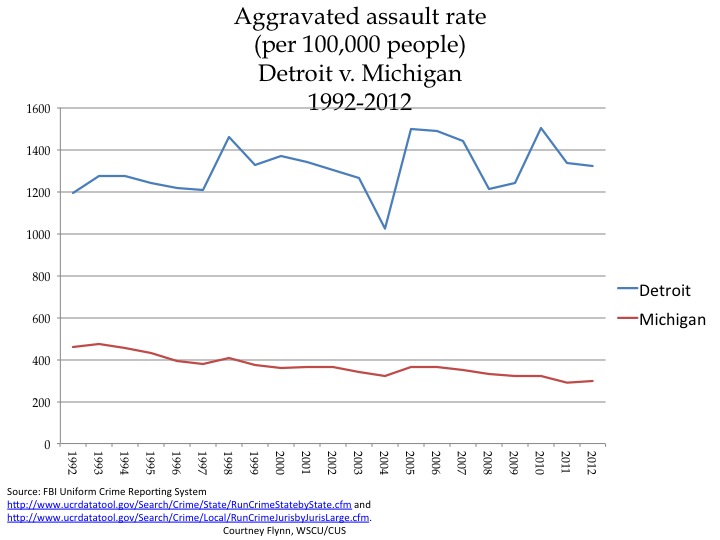
The FBI defines aggravated assault as “an unlawful attack by one person upon another for the purpose of inflicting severe or aggravated bodily injury.”
Overall, the reported aggravated assault rate in Detroit increased from 1,190.8 in 1992 to 1,321 per 100,000 people in 2012. During this time period, there were decreases in the rate, including from 2000 to 2004 and from 2005 to 2008. Michigan’s rate decreased during the time period examined from 458.6in 1992 to 295.5 in 2012.
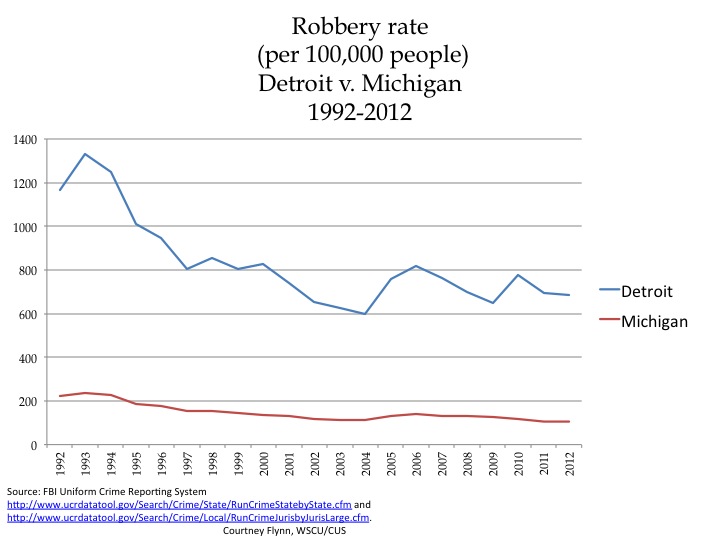
Robbery is defined by the FBI as “the taking or attempting to take anything of value from the care, custody, or control of a person or persons by force or threat of force or violence and/or by putting the victim in fear.”
The robbery rate for the City of Detroit has consistently been much higher than that of the State of Michigan. From 1992 to 2012, both rates have decreased. Detroit’s rate was 1,167.9in 1992 and 648.9 in 2012. Michigan’s rate was 221.5 in 1992 and 105.6 in 2012.
From 2011 to 2012, both Detroit and the State of Michigan did not experience much change in robbery rates. Detroit experienced a decrease of about 11 robberies per 100,000 residents from 2011 to 2012 while the state’s rate remained the same.
Most Wayne County homicide cases in Detroit
According to an interactive map released by the Detroit Free Press there were about 400 deaths handled by the Wayne County Medical Examiner’s Officer in 2013. To see where these occurred click here.
Economic and Demographic indicators: Detroit’s population up as are home prices
In recent weeks information regarding the increase in Michigan’s population and an estimated decrease of migration out of the state have been published in various news outlets. According to information from the Southeastern Michigan Council of Governments, Detroit’s population has also experienced an increase.
In addition:
•The unemployment rate in Detroit and across the state has been decreasing; (monthly)
•The Purchasing Manager’s Index for Southeast Michigan decreased from November 2013 to December 2013; (monthly)
•The Commodity Price Index experienced a decrease from November 2013 to December 2013 for Southeast Michigan; (monthly)
•Standard and Poor’s Case-Shiller Index show that the prices of homes in the Detroit area have been experiencing an increase; (monthly)
•The number of building permits obtained in Wayne and Oakland Counties decreased from October 2013 to November 2013; (monthly).
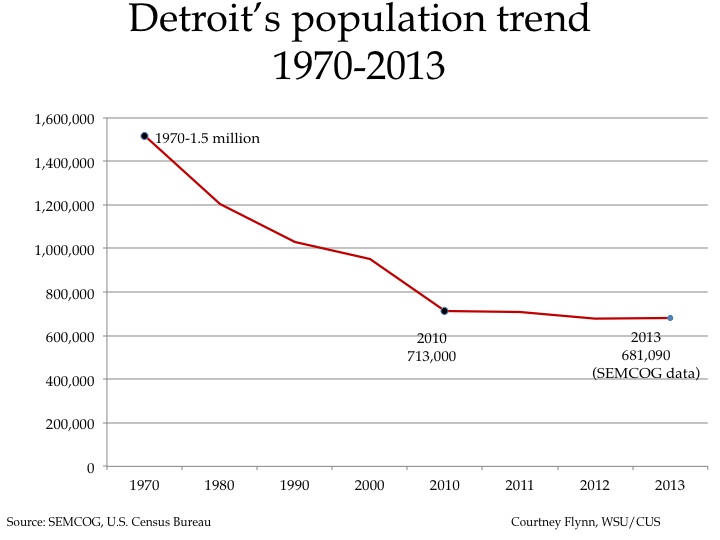
Overall, the City of Detroit’s population has experienced a decline, going from about 1.5 million residents in 1970 to 677,891 in 2012. However, from 2012 to July 1, 2013 the city has experienced a population increase, according to the Southeastern Michigan Council of Government. SEMCOG estimated in 2012 the city had 677,891 residents, and as of July 1, 2013 the SEMCOG estimate was 681,090 residents. The biannual population estimates from SEMCOG are based on trends from area demographics.

According to the most recent data provided by the Michigan Department of Technology, Management and Budget, from October to November of this year the unemployment rate for the State of Michigan has decreased from 9 to 8.8 percent. They estimate the City of Detroit also experienced an unemployment rate decrease. In September the rate was recorded at 16.9 percent and in October it was estimated at 16.2 percent.
Employment numbers for Detroit, and other localities in the State of Michigan, were not available for November because of the government shutdown in October.
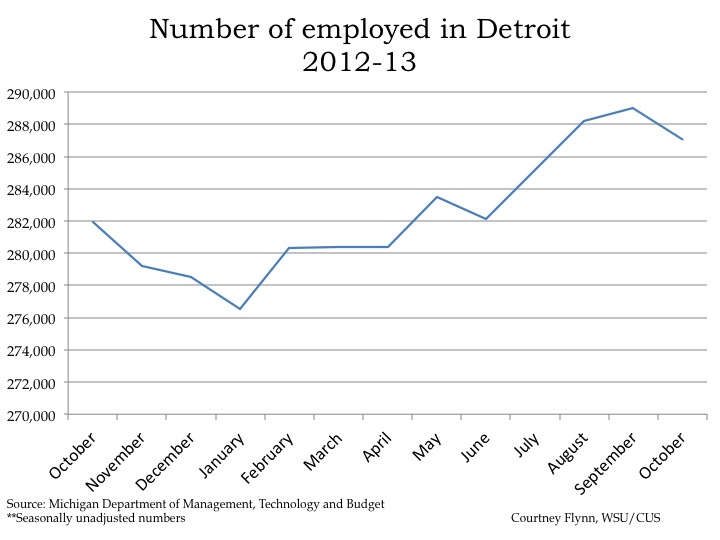
The number of employed in the City of Detroit decreased by 1,928 people from September to October of 2013. In October there were 287,067 people employed.

The above chart shows the number of people employed in auto manufacturing industry in the Detroit Metropolitan Statistical Area throughout 2012 and into 2013. Employment increased in the auto manufacturing and auto parts manufacturing industries from September to October. In September it was reported there were 90,700 people employed in these industries, and in October there were 91,500 employed; this is an increase of 800 employees.
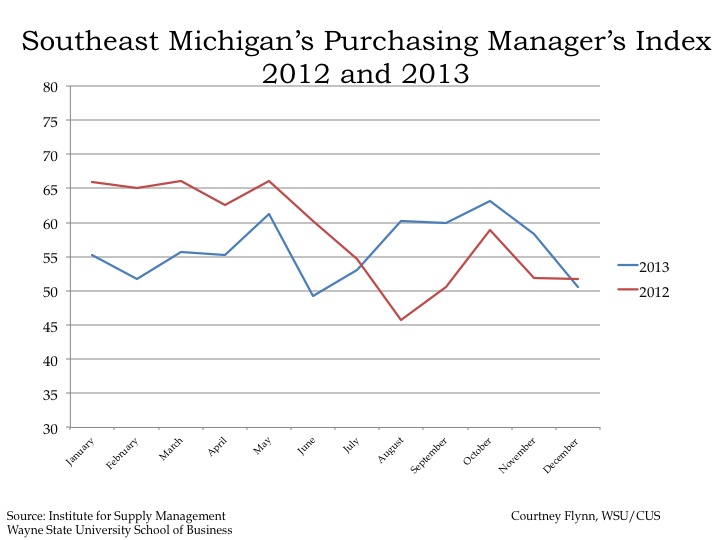
The Purchasing Manger’s Index (PMI) is a composite index derived from five indicators of economic activity: new orders, production, employment, supplier deliveries, and inventories. A PMI above 50 means the economy is expanding.
According to the most recent data released on Southeast Michigan’s Purchasing Manager’s Index, there was a decrease of 7.7 points from November 2013 to December 2013. In December 2013, a PMI of 50.6 was recorded, which is reflective a declining in economic expansion because of a reduction in new orders and production.

The Commodity Price Index, which is a weighted average of selected commodity prices, was recorded at 52.2 in December 2013, which was 2.2 lower than the previous month.


The above charts show the Standard and Poor’s Case Shiller Home Price Index for the Detroit Metropolitan Statistical Area. The index includes the price for homes that have sold but does not include the price of new home construction, condos, or homes that have been remodeled.
According to the index, the average price of single-family dwellings sold in Metro Detroit was $92,140 in October 2013. This was an increase of approximately $13,420 from the average price in October 2012.
The annual percent change in the Home Price Index showed a slight decrease from the increase the region experienced in July. Between August 2012 and August 2013, there was a 16.34 percent increase in home prices for the Detroit MSA.


The above charts show the number of residential building permits obtained each month in Wayne, Oakland, and Macomb counties from January 2012 until November 2013. These numbers are reported by local municipalities to the Southeastern Michigan Council of Governments and include single family, two family, attached condo, and multi-family units.
All three counties experienced a decrease in the number of building permits pulled from October to November, consistent with a seasonal decline in home construction. Oakland County experienced the most dramatic decrease in the number of building permits pulled. In October 324 permits were pulled and in November there were 113; this is a decrease of 211. Wayne County experienced a decrease of 61 permits pulled and Macomb County experienced a decrease of 51.
In addition to Oakland County experiencing the most dramatic decrease, it was the only county that had fewer permits pulled in November 2013 than November 2012.
Michigan’s population increases for second year in a row
According to recently released U.S. Census Bureau data, Michigan’s population has marginally increased for the second year in a row. Experts believe, according to a recent Detroit Free Press article, that part of the reason the state’s population has grown by about 2.3 million people is because the outflow of residents has decreased. To read more, click here.