Highland Park has Highest Poverty Rate in Southeastern Michigan

In 2015, the highest levels of poverty were concentrated within the City of Detroit and its inner-ring suburbs, according to data from the U.S. Census Bureau. Highland Park, which is surrounded by the City of Detroit, had the highest percentage of residents aged 18 or older living at our below the poverty level at 44.7 percent. In Hamtramck, 28 percent of the adult were living below the poverty level in 2015, and in the City of Detroit, 25.5 percent of the adult population was living below the poverty level.

In 2015, according to the U.S. Department of Health and Human Services, the poverty threshold for an individual was an annual earning of $11,770 and for a family of four it was $24,250.

When breaking down the adult population into two groups, those between the ages of 18-64 and those above the age of 65, Highland Park and Hamtramck, respectively, again had the highest poverty percentages. In Highland Park, 46.1 percent of the population between the ages of 18 and 64 lived at or below the poverty level, and 38.6 percent of the population above the age of 65 lived at or below the poverty threshold. In the City of Hamtramck, 41.7 percent of the population between the ages of 18-64 lived at or below the poverty level, and 30.7 percent of those above the age of 65 lived at or below the poverty level. In Detroit, 37.5 percent of the residents between the ages of 18-64 lived at or below the poverty level in 2015, and 20.4 percent of those above the age of 65 lived at or below the poverty level.

On the opposite end of the spectrum, there were 134 communities in Southeastern Michigan (of the 214 total municipalities) where less than 10 percent of those between the ages of 18-64 lived at or below the poverty level. Additionally, there were 175 communities in the region where less than 10 percent of those above the age of 65 lived at or below the poverty level.

The communities with the lowest percentages of their adult populations living at or below the poverty level were primarily concentrated in the western area of the region, with several being located in Washtenaw County.

While the highest poverty levels were concentrated around the City of Detroit, poverty levels across the region have increased. This data will be explored next week by comparing Census poverty level data for the years 2000, 2010 and 2015.

Indicators Show Growth For Housing in Southeastern Michigan

In Southeastern Michigan, home prices are on the rise, as are the number of housing units being built, while mortgage rates appear to be slowly, and slightly, decreasing. Such indicators, which are more closely examined in this post, speak to a slow ongoing recovery in housing and possibly higher homeownership rates. However, since the number of building permits being pulled include many multi-family units, it is perhaps also true that higher rents, a trend we have been following, are drawing more investment into rental housing.

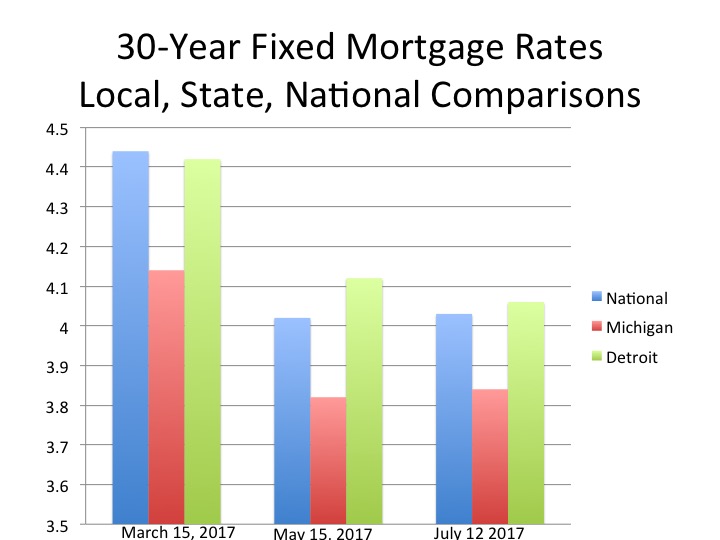
Above are three average 30-year mortgage interest rates at the national, state and local levels. These rates were provided by bankrate.com, which does a national survey of large lenders on a weekly basis. As a 30-year fixed rate mortgage is the most traditional type of home financing, this was chosen to show the rate differences. On average, the State of Michigan had the lowest average interest rate for the week of July 12 at 3.84, which was 0.02 points higher than the last time we examined that data. Of the three months for which we have examined mortgage rates, Michigan’s continues to remain the lowest.

Also during the week of July 12, 2017 Detroit’s average 30-year fixed mortgage interest rate was higher than the national average. At this point in time, Detroit’s average was 4.06 and the national average was 4.03. Between May and July, the 30-year fixed mortgage rate for the Detroit area decreased (it was 4.12 in May and was 4.06 the week of July 12) but it increased by 0.01 on the national level (it was 4.02 in May).

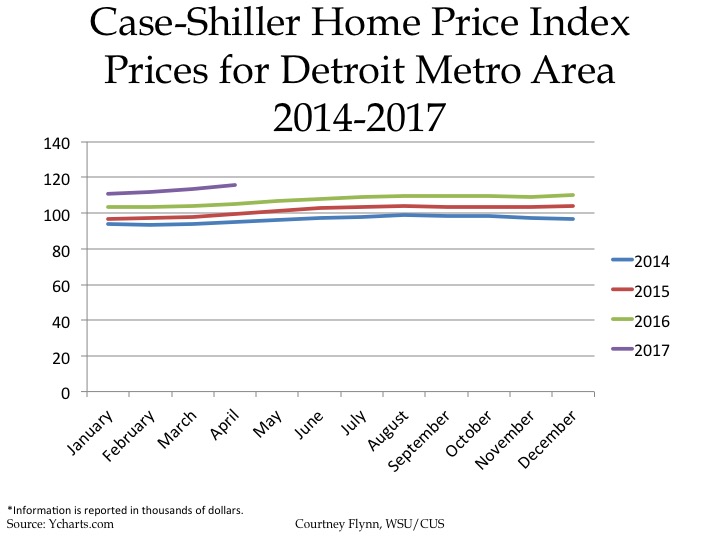
The above charts show the Standard and Poor’s Case-Shiller Home Price Index for the Detroit Metropolitan Statistical Area. The index includes the price for homes that have sold but does not include the price of new home construction, condos, or homes that have been remodeled.

According to the index, the average price of single-family dwellings sold in Metro Detroit was $115,610 in April 2017. This was an increase of $10,390 from April of 2016 and an increase from $16,110 from April of 2015 and an increase of $20,750 from April of 2014. Between just March and April of this year the average home price in the region increased by $2,030.

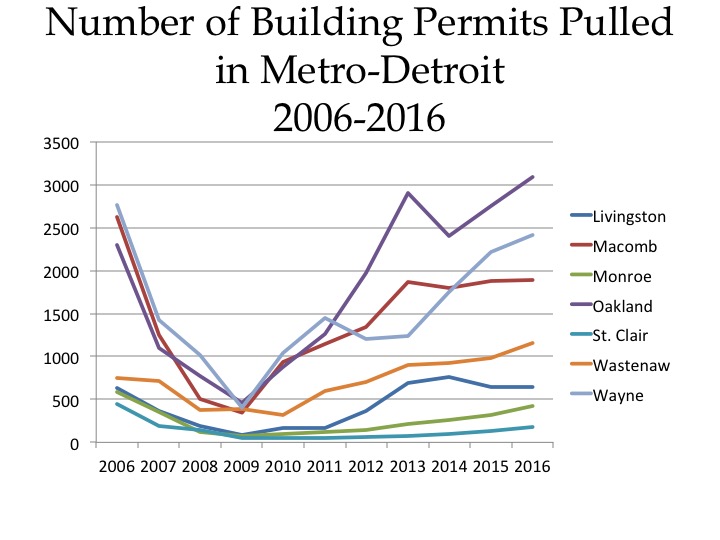
Between 2006 and 2016, according to the Southeastern Michigan Council of Governments, the number of building permits pulled dropped to a low in 2009, mid-recession. The number of building permits reported for each county includes single family, two family, attached condo and multi-family units.

The number of building permits pulled have recovered for all seven counties in the region since the 2009 nadir. However, only three of the seven counties have outpaced their 2006 numbers. These counties are Livingston County, Oakland County and Washtenaw County. The difference between the number of 2006 building permits and 2016 building permits for each of these three counties are:

  • Livingston: 59
  • Oakland: 786
  • Washtenaw: 405

Of the four counties where building permit numbers have yet to recover to 2006 numbers or beyond, Macomb County had the biggest difference at 739. In 2006 there 2,626 building permits pulled in Macomb County and in 2016 there were 1,887. For Wayne County, there was 356 difference in that time frame. There were 2,766 building permits in Wayne County in 2006 and in 2016 there 2,410.

Overall, in 2016, Oakland County had the highest number of building permits pulled at 3,088. Oakland County has had the highest number of permits pulled, regionally, since 2012 when it surpassed Wayne County.

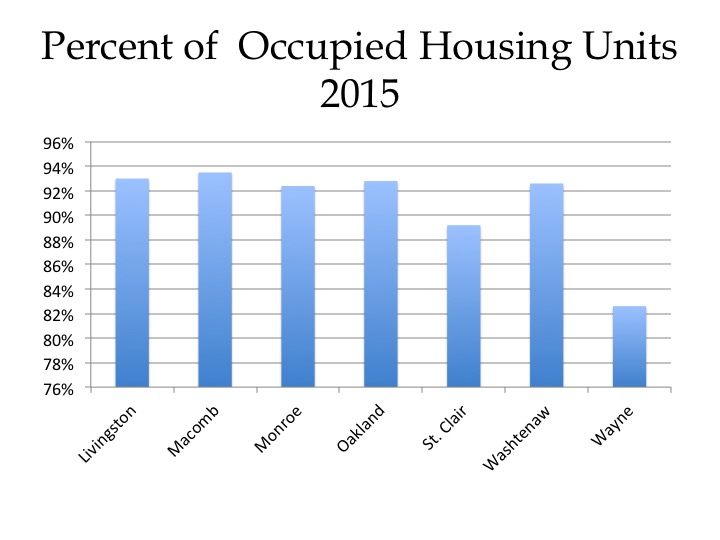
According to the 2015 American Community Survey, Wayne County had the lowest percentage of occupied housing units at 83 percent, meaning there was a 17 percent vacancy rate in the county in 2015. Macomb County on the hand had the highest occupied housing unit rate in the region at 94 percent. Livingston, Oakland and Washtenaw counties all had 93 percent occupied housing unit rates, and Monroe County had a 92 percent occupied housing unit rate. The only other county in the region that had an occupied housing unit rate below 90 percent was St. Clair County. In 2015, St. Clair County had an 89 percent occupied housing unit rate.

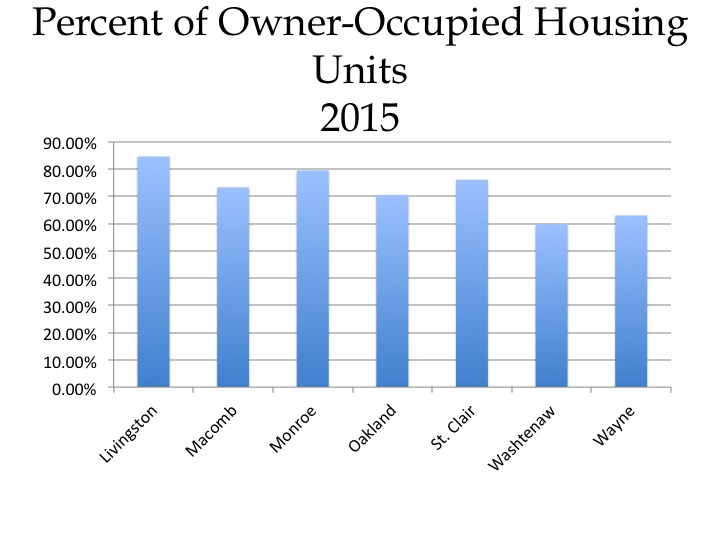
In 2015, according to the American Community Survey, Livingston County had the highest home-ownership percentage at 84.6 percent while Washtenaw County had the lowest at 59.8 percent. It should be noted though that the University of Michigan is located in Washtenaw County, meaning off-campus student housing is typically made up of rental units. In Wayne County, the percentage of owner-occupied housing units was 63 percent. It was only Washtenaw and Wayne counties where the percentage of homeowners was below 70 percent.

Southeastern Michigan Drug Death Rates On The Rise, Trend Similar to State and Nation-wide Problem

Between 2010 and 2015 Wayne County experienced the largest rate increase for drug-induced deaths in Southeastern Michigan, according to the Michigan Department of Community Health. In 2010 the rate for drug-induced deaths in Wayne County was 22.4 per 100,000 people and by 2015 that increased to 36.1 per 100,000 people. In Detroit, the drug-induced death rate increased by 9.4; in 2010 the rate was reported at 22.3 per 100,000 people and in 2015 it was reported to be 31.7 per 100,000 people.

Monroe County was the only other in the region to experience an increase above 10 per 100,000 between 2010 and 2015 was Monroe County. In 2010 the drug-induced death rate in Monroe County was 19.7 per 100,000 people, and by 2015 it had increased to 32.1 per 100,000 people, meaning there was a 12.4 rate increase.

In addition to showing rate changes between 2010 and 2015 we have also created maps that show the rate changes in five-year increments between 2000 and 2005 and 2005 and 2010. Between 2000 and 2005 Monroe County was the only county in the region to experience a rate increase above 10. In 2000 the drug-induced death rate in Monroe County was reported at 4.1 per 100,000 people and by 2005 increased to 17.1 per 100,000 people. Between 2005 and 2010 the rate increase for Monroe County was much smaller at 2.6, however the data shows drug-induced death rates in Monroe County and throughout the region have continued to increase since 2000.

Between 2000 and 2015 the overall drug-induced death rate increase for Monroe County was 28, and for Wayne County that rate increase was reported at 18.2. In 2000 the drug-induced death rate in Wayne County was reported to be 18.2 per 100,000 people, by 2005 it increased to 22 per 100,000 people. Between 2005 and 2010 there was a slight rate decrease of .3, but by 2015 the rate peaked at 36.1 per 100,000 people (the highest in the region).

Also between 2005 and 2010 in Detroit there was a drug-induced death rate decrease; this decrease was reported at 3.7 (in 2005 the rate was reported at 26 and in 2010 it was reported at 22.3). However, like the seven counties in the region, Detroit experienced drug-induced death rate increases between 2010 and 2015 of 9.4 per 100,000 residents, and overall since 2000 an increase of 9.1.

An overall increase in drug-induced death rates is not unique to Southeastern Michigan. According to the Michigan Department of Community Health, 2015 was the third straight year the State of Michigan experienced an increase in the drug-induced death rate. In 2015 the rate was reported at 22.3, compared to a rate of 20.5 in 2014, 18.3 in 2013 and 16.4 in 2012. Throughout the country, according to a recent Free Press article, there were 19 states (Michigan being one of them) that experienced an increase in drug-induced death rates. The U.S. Centers of Disease Control and Prevention reported that of the 52,404 drug overdose deaths in 2015, 63 percent of them were related to opioids. In Michigan, according to the Free Press article, about 45 percent of the drug related deaths in the state were related to opioids and about 20 percent involved heroin.