Rent Costs Increase throughout Michigan between 2000-2014

In 2014 there were 122 different communities in the state of Michigan with gross median rental costs above $1,000; Bloomfield Hills topped this list with a gross median rent price of $2,001. Despite this community being at the top of the median gross rental cost list for the state it experienced a 5 percent median rental price decrease between 2000 and 2014. On the opposite end of the spectrum, in 2014 there were 72 different Michigan communities with median gross rental prices under $500 a month; Rose City in Ogemaw County had the lowest gross median rental cost at $294 per month. Like Bloomfield Hills, Rose City also experienced a decrease in its median gross rental cost between 2000 and 2014. However, for Rose City that decrease was much greater; there was a 50 percent median gross rental cost decrease between 2000 and 2014.

On a national basis, in 2014 the gross median rental cost was $920 and 41 percent of rental units throughout the U.S. had a gross median rental price above $1,000; 12.1 percent of the rental units in the U.S. had gross median rental costs below $500.

For this post, data from the year 2000 is from the decennial census while the 2014 data is from the 5 year American Community Survey. Additionally, when comparing gross median rent data between 2000 and 2014 (as seen in the second map) the 2000 rent prices were adjusted to reflect 2014 dollars so a more accurate reflection of the changes could be presented.

Gross rent is defined as the monthly amount of rent plus the estimated amount of utilities and fuel.

MedGrossRent2014

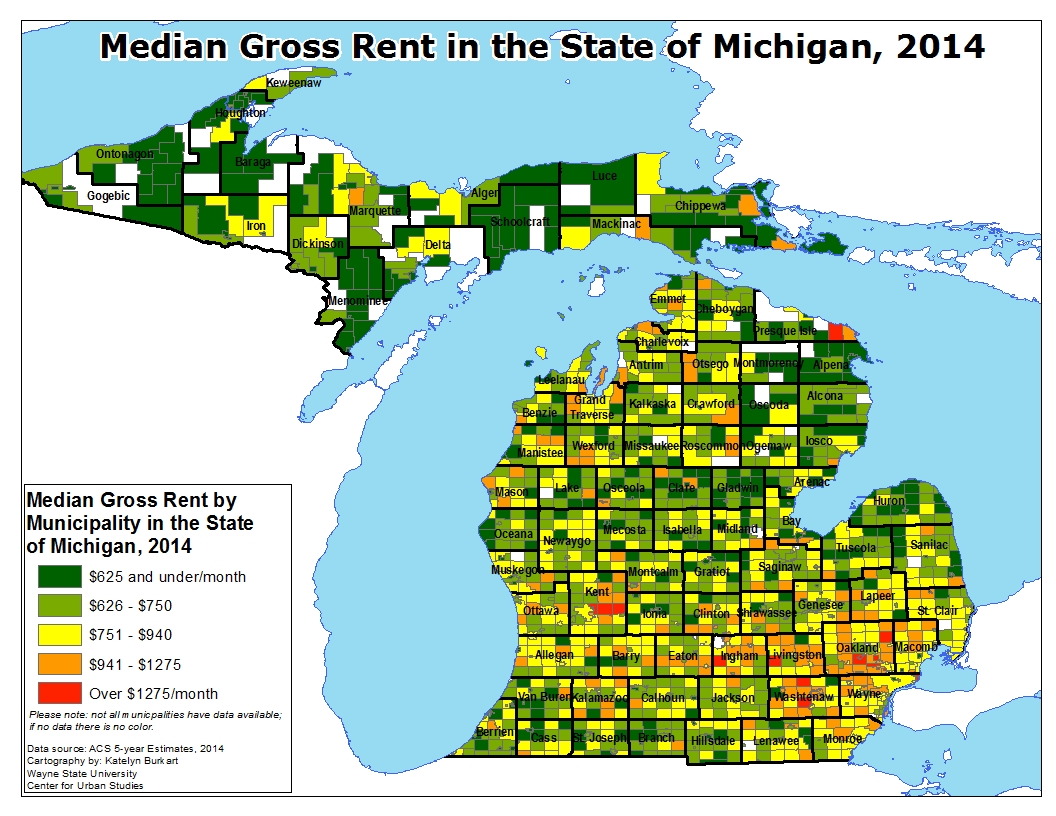
The map above shows the range of median gross rental costs throughout the state of Michigan in 2014. Looking at the highest bound of rents–$1,275 and there were 20 communities throughout the state, 13 of which were located in Southeastern Michigan and seven of which were located in Oakland County. Of those in the region, two were located in Wayne County-Grosse Pointe Shores and Grosse Pointe Farms. As noted, there were over 100 communities with gross rental prices above $1,000 in Michigan in 2014.

Regionally, there were also five communities on the lower end of the spectrum, with gross median rental costs below $625. The city of Highland Park was the only one located in Wayne County, with a gross median rent of $624. The city of Center Line had the lowest gross median rental cost in the region at $492.

The city of Detroit had a gross median rental cost of $756 in 2014. This was in the 42 percentile of gross median rental prices throughout the state. Detroit’s gross median rental cost was higher than more than 50 percent of the other communities in the state.

ChangeRent00to14

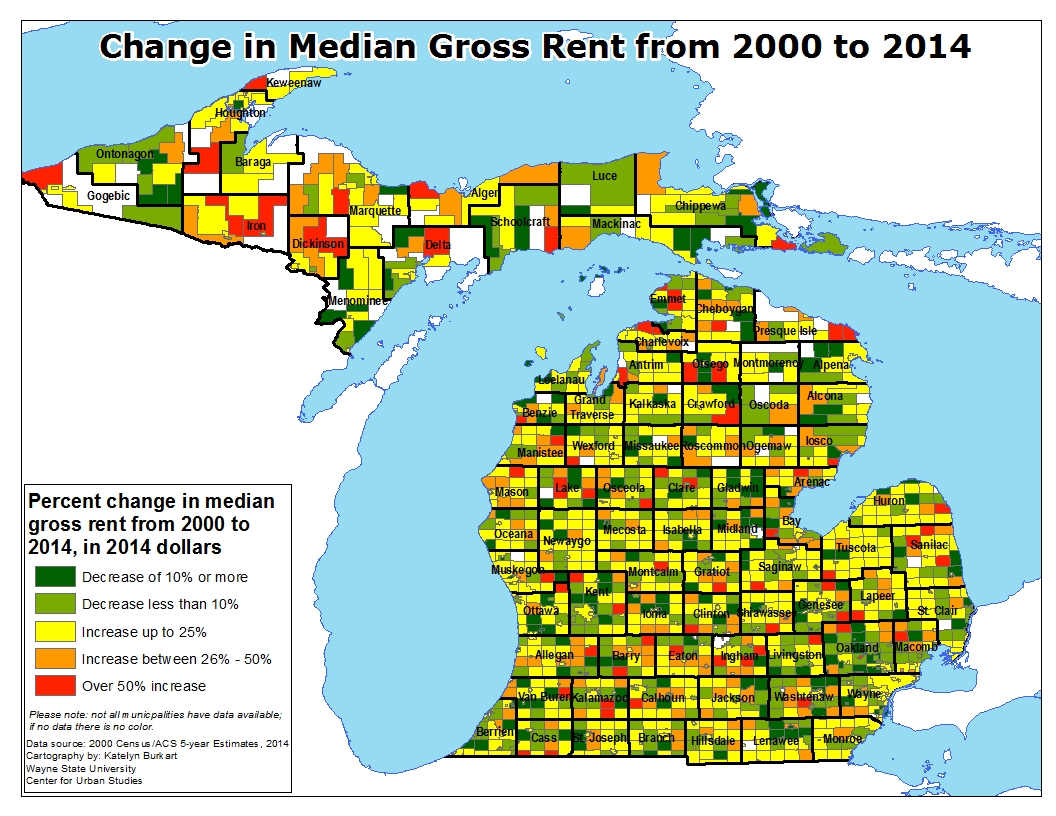
In total, there were 80 Michigan communities with gross median rental price increases above 50 percent between 2000 and 2014 (These are the communities for which there was full data for comparison). Of those 80 communities, four were located in the Southeastern Michigan region, two of which were located in Oakland County. Of those communities, Orchard Lake Township had the highest percentage change in gross median rent at 117 percent. In 2014 the gross median rent in the township was $1,909 and in 2000 (in adjusted 2014 numbers) the gross median rent was $879 ($635 in 2000 dollars).

Cross Village Township in Emmett County had the largest overall gross median rental cost increase between 2000 and 2014 (in 2014 dollars) at 132 percent. In 2014 the gross median rental price in the township was $915 while in 2000 the price (in 2014 dollars) was $415 (equivalent to $300 in non-adjusted 2000 dollars). It should be noted though that this Lake Michigan town had a population of 294 in 2014, meaning that a small number of large increases in rent could produce the large reported change in the median.

Of the 27 communities in Michigan with a decrease in gross median rental costs between 2000 and 2014 for which full data was available for comparison, only two were located in Southeastern Michigan. These communities-Rose and Sylvan Lake townships in Oakland County and Deerfield Township in Livingston County-experienced rental rate decreases at 1.5 percent, 2.7 percent and 25 percent, respectively.

Between 2000 and 2014 the city of Detroit’s gross median rental cost increased by 12 percent. Detroit’s gross median rental cost increase was higher than about 70 percent of the other Michigan communities between 2000 and 2014 (when comparing in 2014 dollars). While not depicted in either of the maps, it was reported on July 23 2016 by the Detroit News that the housing market in Downtown Detroit continues to soar, with average rents increasing more that 11 percent since 2011 in that area of the city. According to the article, the average monthly rent for a one bedroom apartment in Downtown Detroit is $1,359.

Overall, about 65 percent of the state’s cities or townships had gross median rental cost increases between 2000 and 2014, when dollars were adjusted for comparison. Various reasons may explain the overall increase in gross median rental costs (in comparable dollars) throughout the state, the most likely of which is greater demand. The 2008-2009 recession produced a large uptick in foreclosures, nationally and throughout the state. With this, many people were left looking for affordable rental units. With an increase in demand comes an increase in price. In a future post we will discuss the overall change in rental rates throughout Southeastern Michigan between 2000, 2010 and 2014, but according to the U.S. Census Bureau we do know that on a national basis the recession produced a greater demand in rental units. Since gross median rent also includes the estimated cost of utilities and fuel, increases in energy costs overtime are also likely contributors to the overall increase.

Detroit Unemployment Increases, Along with Number Employed and Labor Force

  • From April to May 2016, the unemployment rate across the state and within the city of Detroit increased (monthly);
  • Overall, however, the number of employed Detroit residents increased (monthly);
  • The Purchasing Manager’s Index for Southeastern Michigan decreased from May to June 2016 (monthly);
  • Commodity Price Index also decreased for Southeastern Michigan (monthly);
  • Standard and Poor’s Case-Shiller Home Price Index for the Detroit Metropolitan Statistical Area shows home prices continue to gradually increase on a month-to-month basis.

Unemployment

According to the most recent data provided by the Michigan Department of Technology, Management and Budget, the unemployment rate for the State of Michigan increased to 4.5 percent in May 2016; the unemployment rate was 4.3 percent in April. During this same period, unemployment in the City of Detroit also increased, but at a higher rate. Detroit’s unemployment increased from 9.1 percent in April to 9.8 percent in May.

Slide05

In May of 2016 the number of employed Detroit residents rose to 218,656, an increase of 1,577 from April. Between May of 2016 and May of 2015 there was a total increase of 8,756 employed Detroit residents, according to the Michigan Department of Technology, Management and Budget.

Along with the the number of employed Detroit residents increasing over the last year, so has the labor force. Between April and May of 2016 the labor force increased by 3,784 and between May of 2015 and May 2016 the labor force increased by 803. In May of 2016 the labor force recorded by the the Michigan Department of Technology, Management and Budget for the city of Detroit was 242,432.

Auto Manufacturing employment

The above chart shows the number of people employed in the auto manufacturing industry in the Detroit Metropolitan Statistical Area (MSA) (Detroit-Warren-Livonia) from May 2015 to May 2016. In that time frame the number of people employed in this industry decreased by 900, from 94,200 to 93,300.

PMI

The Purchasing Manger’s Index (PMI) is a composite index derived from five indicators of economic activity: new orders, production, employment, supplier deliveries, and inventories. A PMI above 50 indicates the economy is expanding.

According to the most recent data released on Southeast Michigan’s Manager’s Index, the PMI for June 2016 was 58.8, a decrease of 1.1 points from the prior month. The May 2016 PMI was a decrease of 3.2 from May of 2015.  Although there was a decrease, the PMI is still considered strong because of new orders, employment and production. There was a decrease in finished goods, which caused the decrease, along with a decrease in the commodity price index, which is shown below.

Commodity Price Index

The June 2016 Commodity Price Index decreased 7.1 points from May and 6.9 points from the prior year. According to the ISM-Southeastern Michigan PMI the Commodity Price decreased between May and June, however fuel, paper and plastics went up in price.

Detroit Home Prices

The above charts show the Standard and Poor’s Case-Shiller Home Price Index for the Detroit Metropolitan Statistical Area. The index includes the price for homes that have sold but does not include the price of new home construction, condos, or homes that have been remodeled.

According to the index, the average price of single-family dwellings sold in Metro Detroit was $103,780 in March 2016. This was an increase from $97,900 from March of 2015 and an increase from $93,780 from February of 2014.

Detroit has Highest Percentage of Kids Tested for Lead Poisoning

In 2015 about 37 percent of children under the age of 6 in the city of Detroit were tested for an elevated blood lead level, according to data provided by the Michigan Department of Health and Human Services. This was the highest percentage of children tested in the state; Livingston County had the lowest percentage of children under the age of 6 tested at 8.91 percent.

As shown in an earlier post, we also saw that in 2015 Detroit had the highest percentage of children under the age of 6 with blood lead levels elevated above 5 ug/dL at 7.5 percent, according to the Michigan Department of Health and Human Services. Similarly, Livingston County had among the lowest percentage of its child population under the age of 6 tested for elevated blood lead levels while also having less than 2 percent of its child population test positive for elevated blood lead levels.

According to the Michigan Department of Health and Human Services, all children enrolled in Medicaid are considered to be at risk for lead poisoning. Michigan Medicaid Policy requires all children between the ages of 12 and 24 months ages be tested for elevated blood lead levels at least once. Additionally, a child between the ages of 36 and 72 months must be tested for blood lead levels if they have not been tested before. The 2015 data available for the number of children (ages 0-18) on Medicaid was not available for this post. However, we do know a child in Michigan is automatically referred to the state’s Medicaid program if their family’s income is at or below 150 percent of the Federal Poverty Level.

It is particularly important children at risk of lead poisoning be tested because the substance is absorbed more into a child’s body than an adults. Additionally, a child’s brain and nervous system is more sensitive to the damaging effects of lead. Babies and young children can also be more highly exposed to lead because they often put their hands and other objects that can have lead from dust or soil on them into their mouths.

Michigan Lead Testing

Genesee County is where the city of Flint is located and in 2015 between 20 and 25 percent of Genesee County’s child population under the age of 6 was tested for elevated blood lead levels; more than 75 children under the age of 6 in just three zip codes within the city limits of Flint tested positive for elevated blood lead levels in 2015.

In response to the Flint Water Crisis, the State of Michigan has since “strongly recommended” that all children who live in the city, live in a home using Flint water or attend school or a childcare center in the city be tested for elevated blood lead levels. In addition, the state has required all children insured by Medicaid and/or enrolled in WIC be tested. These recommendations will certainly increase the percentage of children tested for elevated blood lead levels in Genesee County for the year of 2016.

Also, in a recent post we discussed how the city of Grand Rapids had one select zip code with 188 children under the age of 6 with elevated blood lead levels; in total there were no more than 523 children under the age of 6 in all of Grand Rapids with elevated blood lead levels. While the data on the percentage of children under the age of 6 tested for elevated blood lead levels in Grand Rapids in 2015 wasn’t readily available we do know that between 17 and 19.99 percent of children under the age of 6 in Kent County were tested for elevated blood lead levels.

The city of Adrian was another municipality discussed in a previous post because of the number of children with elevated blood lead levels. In 2015 there were 67 children under the age of 6 with elevated blood lead levels in Adrian, according to the Michigan Department of Health and Human Services. This number of children with elevated blood lead levels in Adrian contributed to the 10 percent of children under the age of 6 with elevated blood lead levels in Lenawee County. Subsequently, between 13.5 and 16.99 percent of children under the age of 6 were tested for elevated blood lead levels in 2015.

Although the areas mentioned above have been noted as having a high percentage of children under the age of 6 with elevated blood lead levels, none of the counties in which they are located in had more than 25 percent of children under the age of 6 tested for elevated blood lead levels. The counties in Michigan that did have more than 25 percent of its child population under the age of 6 tested for elevated blood lead levels were:

  • Jackson County
  • St. Clair County
  • Shiawasee County
  • Hillsdale County
  • St. Joseph County
  • Benzie County
  • Baraga County

The map above shows that elevated blood lead testing throughout the state of Michigan is inconsistent and 15 counties throughout the state had less than 13.5 percent of its child population under the age of 6 tested for elevated blood lead levels. We also know that children living in poverty have a higher risk of being poisoned by lead, but as the map shows, not all children under the age of 6 are being tested for lead poisoning, and of those not being tested there is certainly a portion of at risk children being excluded.


Locals Push Ahead as Michigan Takes Steps Backward for LGBT Inclusivity

Just over a year ago love won nationwide when the Supreme Court ruled in favor of same-sex marriage. County courthouses across Michigan began issuing marriage licenses to those who wanted a legally recognized union, despite their sexual orientation and gender identity. However, even such a monumental move toward equality didn’t serve as a catalyst for the State of Michigan to make strides to secure other basic human rights for the Lesbian, Gay, Bisexual and Transgender (LGBT) community. In fact, state level statutes have failed to recognize equality for the LGBT community, whereas at the local level various officials are working to ensure comprehensive civil rights policies exist in the areas they have jurisdiction over.

Currently, there are 46 Michigan cities and counties, combined, which provide some type of employment and/or housing discrimination protection to the LGBT community. Fourteen of these local government entities, including three counties, are located in Southeastern Michigan. Just in Southeastern Michigan, those 11 communities with inclusive non-discrimination policies make up 23 percent of the region’s population. The three counties with such policies-Macomb, Washtenaw and Wayne-make up 64 percent of the population. But, while these efforts deserve to be applauded, many of the policies are by no means comprehensive. At the municipal level expanded civil rights policies are to be adhered to by all employers and/or housing providers. This isn’t necessarily the case at the county level though. Macomb County’s human rights policy is only extended to the county’s 2,200 current and potential employees; its contracting policy doesn’t even reflect the changes.

Both historical and recent policies, and lack thereof, at the state level have created a culture that lacks inclusion and basic human rights protections. Currently the Elliott Larsen Civil Rights Act (the state’s non-discrimination policy) does not include sexual orientation or gender identity and expression. Attempts to amend this statewide civil rights act have occurred since 1973 (a year after East Lansing and Ann Arbor adopted their policies), the most recent being 2014. The proposed 2014 amendments aimed to add exactly what is missing, however those amendments were never approved in the legislature. This lack of action and support for basic human rights continues to leave Michigan without a blanket discrimination protection for the LGBT community and a political gesture toward inclusivity.

Although the legislature failed take action on the Elliott Larsen Act, in the summer of 2015 three Religious Freedom Adoption bills became law, allowing religious organizations to deny placement of a child in a home based on religious grounds. These bills did not have direct language against the LGBT community but it can be argued they are, at least in part, targeted at by these bills. State Rep. Andrea LaFontaine said the bills were meant to protect the public-private partnership that allows Michigan to have an 80 percent adoption rate. She said,  by making the then proposed bills law, no agency would have to choose “between their faith and helping children.” The Human Rights Campaign said these laws make it even more difficult for LGBT couples to adopt, particularly as the Michigan Catholic Conference and Bethany Christian Services make up 25-30 percent of adoptions that occur in Michigan, according to information provided by Gov. Snyder’s office to the Washington Blade (link). These laws may have protected those public-private partnerships, but they also opened up another avenue for discrimination based on sexual orientation and gender identity.

Not even a year later it seems another door toward discriminatory practices could open. Proposed House Bill 5717 and Senate Bill 993, which were introduced to the Legislature a few months ago, aim to keep the use of public school restrooms restricted to those with the same biological sex; SB 993 goes as far as relying on chromosomes). Anatomy and gender are not one in the same, and while the supporters of these bills claim they are trying to protect the children, the effect is likely to be discrimination against them.

Michigan citizens do not have access to fair employment, housing and family planning options because of their sexual orientation or gender identification, and that soon may be extended to the use of the restroom. Yes, there have been concentrated attempts at the local level to broaden access to these basic human rights for over 30 years. However, some of the State’s elected leaders continue to build walls, including between children, even as local government entities and the nation tirelessly work toward acceptance and inclusivity.

Below is a timeline and a map showing the most recent years in which a Michigan municipality implemented a more comprehensive non-discrimination policy that addresses equal employment and/or housing rights based on gender identity and/or sexual orientation.

Items to note:

  • East Lansing was the first local government entity in the nation to enact to include sexual orientation in its civil rights protections. East Lansing expanded its original 1972 policy that provided employment protections based on sexual orientation to include housing protections in 1986 and to include gender identity in 2005. Since 2005 was the most recent policy amendment East Lansing is listed under 2005 in the timeline and on the map.
  • Ann Arbor adopted policies that provided residents employment and housing protections in 1972; in 1999 it expanded those protections to include gender identity. Ann Arbor is listed as amending its policies in 1999, not 1972, because that was the most recent change.
  • Detroit updated its initial 1979 employment and housing protections beyond sexual orientation to include gender identity in 2008. Detroit is listed as adopting comprehensive non-discrimination policies in 2008 because, again, that was the most recent year they were updated.

Slide14 LGBT

Zippia: Michigan’s Living Wage is $49K

Using MIT’s living wage index, the website Zippia created a website showing what the living wage in every U.S. state is. According to the website, to support two adults and one child in the state of Michigan it costs $49,000. This put Michigan in the third quintile. Illinois and Wisconsin both had higher living wage costs, $51,000 and $52,000 respectively, while Indiana and Ohio had lower living wage costs, $47,000 and $46,000, respectively.

To read the article and view the map click here.