Is the Future of Southeast Michigan’s Public Transportation Regional?

The Regional Transit Authority, which is charged with coordinating regional services and developing rapid transit along Woodward, Gratiot and Michigan Avenue corridors in Macomb, Oakland, Washtenaw and Wayne counties, placed a millage on the ballot in 2016 to support such operations. That millage failed and while the sentiment for public transportation in the region has seemed to increase, we are now left wondering whether it is simply public transportation that has garnered more support, or if it is regional transportation.

Millages supporting SMART (the Suburban Mobility Authority for Regional Transportation) passed in Wayne, Oakland and Macomb counties in the November 2022 election. Since 1995 each of the three counties have passed such millages every four years to support this local transit authority, although in 2022 the margins for approval of these millages was higher only higher for Macomb County as compared to the approval rates in 2018. None the less, the millages were approved in all three counties, again, such consistency is about to change—whether it’s for the long-term better or worse remains unknown though.

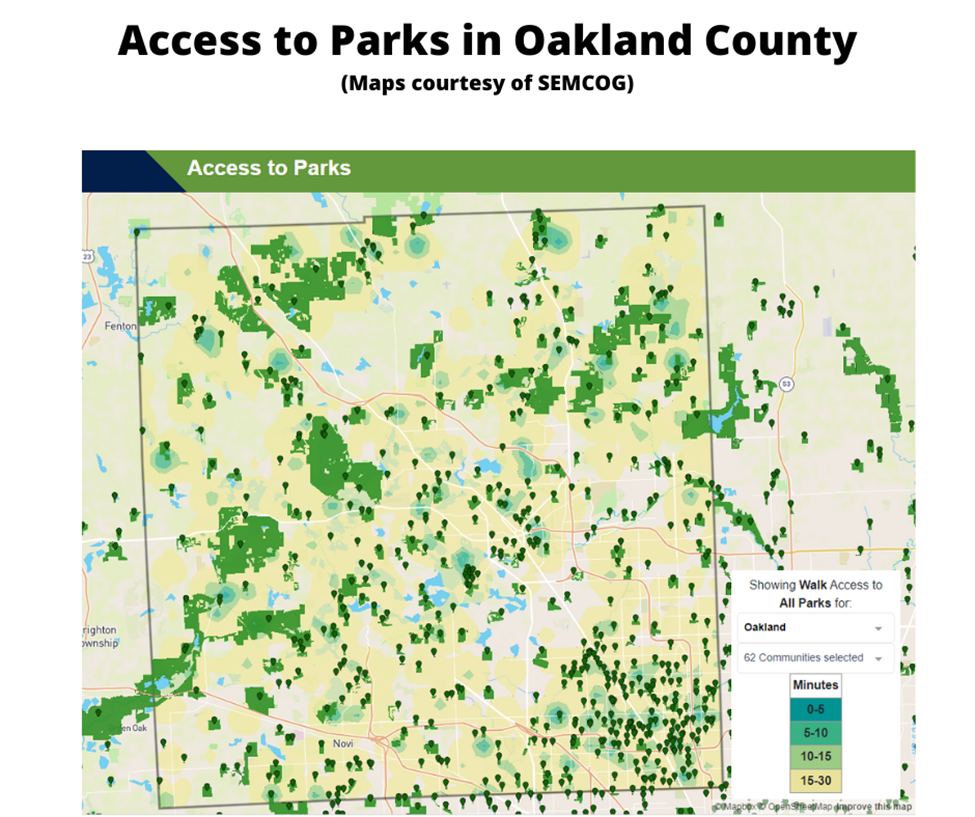
For the short-term, the millage renewals will continue to support public transportation throughout Wayne, Macomb and Oakland counties, and will allow for services to be expanded. Oakland County is the key example of where services will be expanded. Once an “opt-out” county, where each municipality could decide if it wanted to leverage tax dollars to support the public transportation service, Oakland County is now a fully opt-in community. Along with ballot language that gave way to Oakland County being an opt-in county, the now approved millage language also gave way to a 10-year countywide transit millage that will levy 0.95 mills a year starting in 2023. For a home valued at $200,000 (or a home with an SEV of $100,000) the homeowner will pay $95 a year to support the newly approved SMART millage. The Oakland Transit Millage will not only support SMART but also the North Oakland Transportation Authority (NOTA), the Western Oakland Transportation Authority (WOTA) and the Older Persons Commission (OPC) in the Rochester area.

According to Oakland County, these funds levied through the approve transit millage will support services that specifically benefit Oakland County residents and businesses. With the approved millage, Oakland County transit is expected to bring in in about $66.1 million in the first year. According to Oakland County, of those funds, SMART would receive $33.3 million to maintain service and expand routes, the OPC would received $1 million, and the North and West Oakland Transportation Authorities would each receive $2 million. Additionally, $20.4 million will be allocated for new services—with the breakdown being $3.2 million for paratransit, $3.5 million for micro transit, $12 million for more routes and $1.7 million for improvements on existing routes.

Macomb County is another fully opt-in county and has been one since 1995. In November of 2022 Macomb County also approved a 0.95 millage for transit but for five years; traditionally the millages were for four years. The most recent millage passed by 66 percent; in 2018 the millage passed by a margin of only 23 votes. With the passage of this millage, the funds are to support new routes, increased access to on-demand service and improved average wait times, according to SMART.

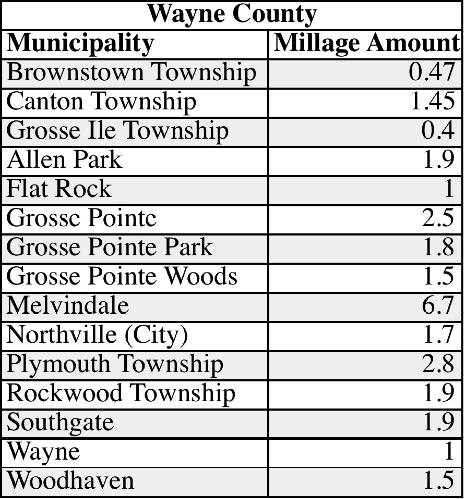
Wayne County is now the only opt-out county that SMART services. This November voters of opt-in communities approved a four-year 0.994 mill levy that will raise about $20.2 million in its first year, according to Wayne County. In Wayne County, there are 25 communities that opt-in to SMART services, according to the SMART website. Detroit is not an opt-in community as it has its own transportation network serviced by the Detroit Department of Transportation (DDOT).

DDOT and SMART services do overlap in some areas, allowing users to easily travel to-and-from the state’s largest city on direct routes from certain other suburban communities; many of these stops are located along Gratiot, Michigan and Woodward avenues.

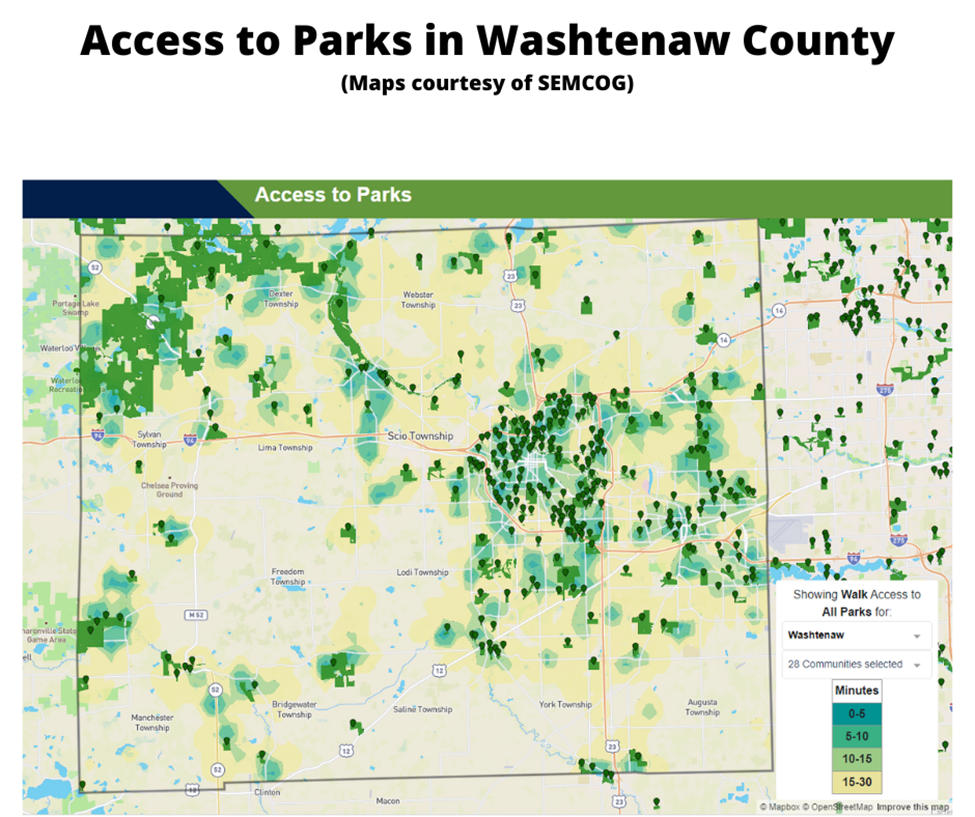
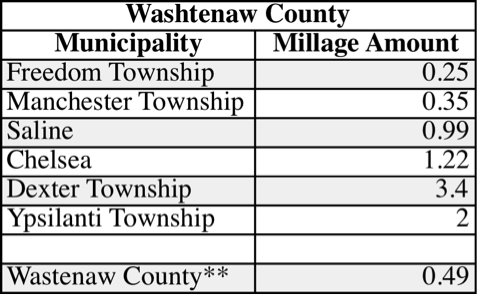
While transit in Macomb, Oakland and Wayne counties received continued support in the November 2022 election, the Ann Arbor Area Transit Authority did too in the August 2022 election. A new 2.38 millage was approved by Ann Arbor and Ypsilanti voters to support TheRide, which is operated by the AAATA. This five-year millage aims to improve and expand public transit service in the area. In addition to the passage of this millage, the Southeast Michigan Council of Governments also granted funds to support increasing transportation services between the cities of Ann Arbor and Ypsilanti, along with Ypsilanti Township.

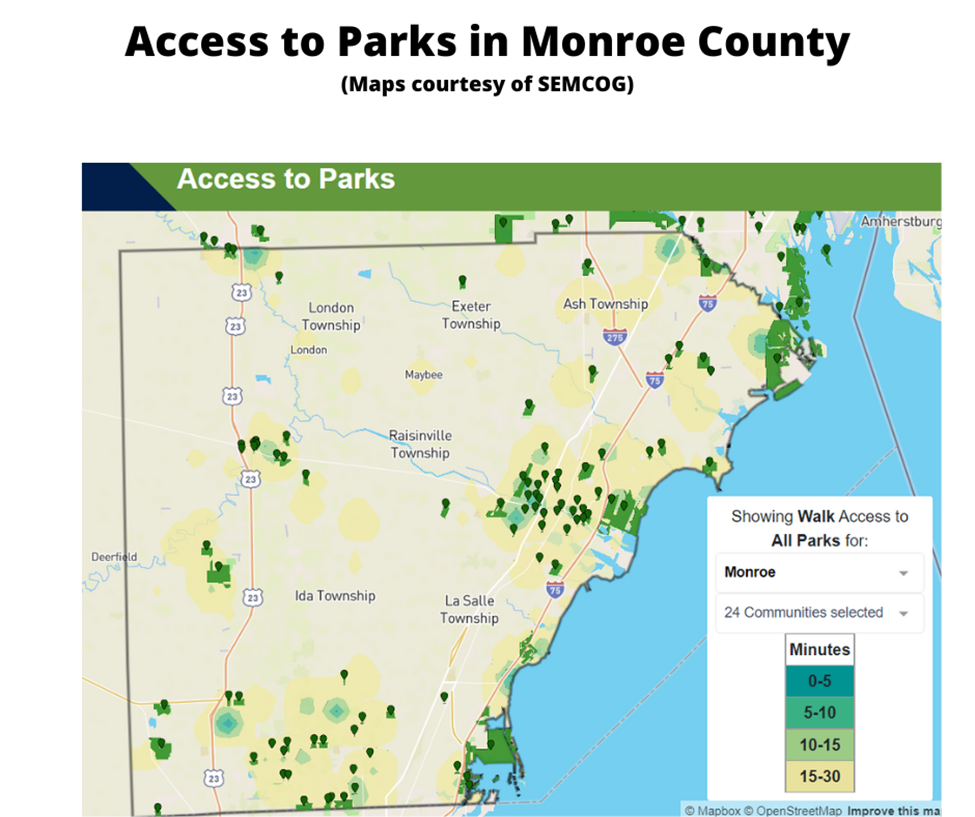
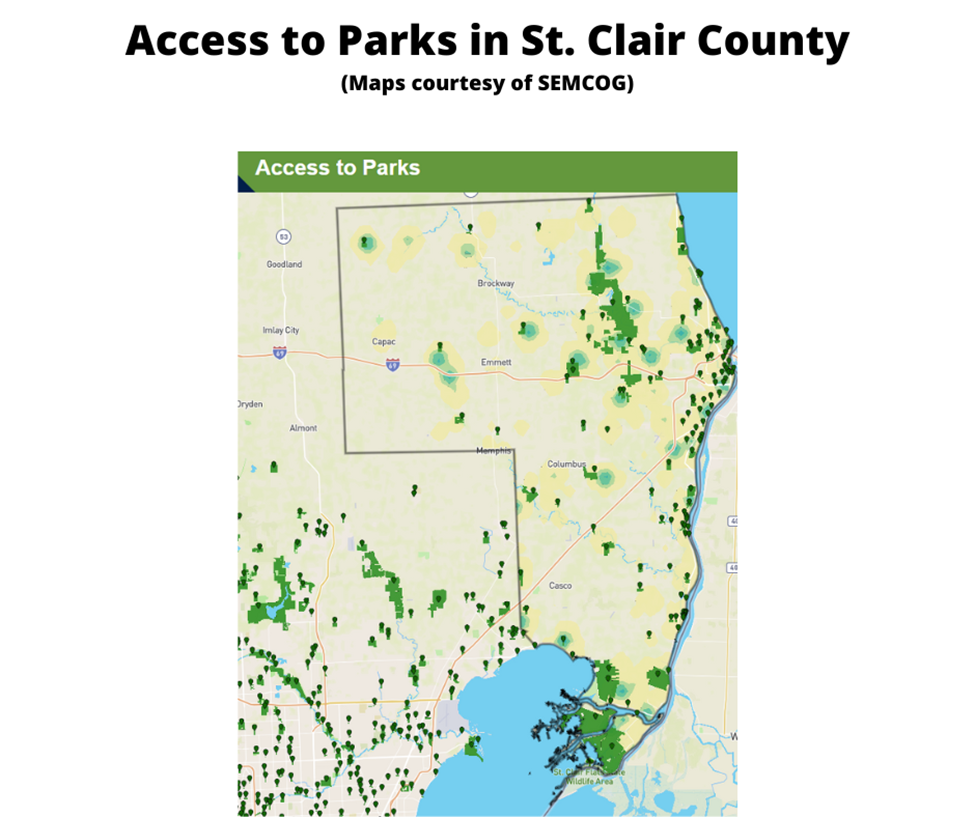
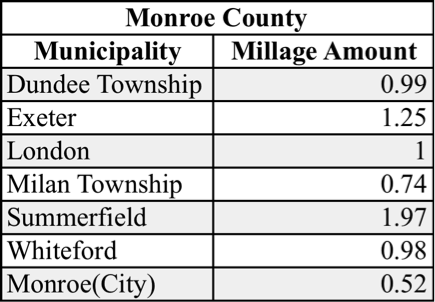
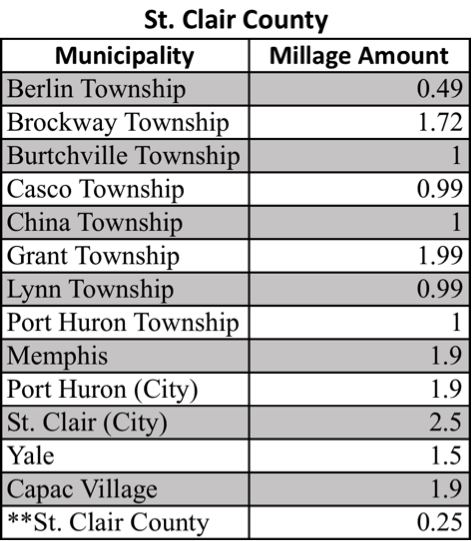
Between the AAATA, SMART, DDOT, NOTA, WOTA, OPC and then Livingston County’s Livingston Essential Transportation Service (LETS), Monroe County’s Lake Erie Transit service and St. Clair County’s Blue Water Area Transit services there are at least nine different public transportation providers in the seven-county region. Then, there is also the RTA, which is meant to oversee the yet-to-be developed regional services, and has the ability to leverage additional transportation millages if approved by voters (and voted to be placed on the ballot by RTA and county leaders)

So, while the recent transit millage approvals highlight increased support for public transportation in Southeast Michigan, it also seems the infrastructure for our fragmented public transportation network is only strengthening. Various mobility options must certainly be made available to meet the differing needs of the population, but benefits may be had when our public transportation and connectivity options are guided by a regional, forward-thinking mission.

Parks Need Priority in Funding to be Sustained

While park land is plentiful in Southeastern Michigan, its upkeep and protection is something necessary to keep it accessible to the public. As noted in our last post, park land throughout Michigan, and Southeastern Michigan, is made accessible through government entities, non-profits and/or private organizations. The funding of park lands and public spaces by non-profit and private organizations is at the will of the organizations’ board members and owners. However, funding and protecting park land through government entities is often more complex.

Government owned and operated parks throughout Michigan are funded primarily through tax dollars, but user fees, grants and donations also aid in their funding. At the state level, according to the Michigan Department of Natural Resources (MDNR), about 97 percent of funding for parks operations and maintenance is generated by user fees and royalty revenues. According to the MDNR, the breakdown is as follows:

  • 51%: Camping and lodging reservation fees
  • 26%: Recreation Passport sales
  • 15%: State-owned, oil, gas and mineral royalty revenues – which feed the Michigan State Parks Endowment Fund – (15%)
  • 5%: Concessions, shelter reservations and miscellaneous sources

Michigan’s General Fund tax dollars provide the remaining three percent of state parks funding.

At the County level, funding differs from one county to the next. For example, in Wayne County there is a millage (0.2459 mills) that funds county parks and distributes money to local communities for their parks. This millage means that the County’s general fund is not expected to make room for parks funding, but if those elected to represent Wayne County residents chose to do so in the general fund they can. Instead, through this additional millage that was voted on by the people (in 2016 and renewed in 2020) there is a dedicated funding source for a guaranteed amount of time. Through a parks millage, funding is dedicated to the creation, operation and/or upkeep of a park. When parks are funded through just the general fund the amount of money allocated to the parks, the programs and/or upkeep can vastly differ from year-to-year depending on the priorities of the elected bodies.

By simply putting a parks millage on the ballot, Wayne County showed that park improvements were a priority of theirs, and with 76 percent of voters supporting the 2020 ballot initiative this also showed that Wayne County residents also view parks as a priority.

In addition to Wayne County having a millage that helps support its parks and recreation opportunities so does Oakland, Washtenaw and St. Clair counties. In Southeastern Michigan, Monroe, Macomb and Livingston counties do not have additional funding mechanisms to support their parks.

Despite Monroe, Macomb and Livingston counties not having county-wide millages to help fund parks, there are cities in Livingston and Macomb counties that have millages to help support their parks.

For example, in Livingston County the Howell Area Parks and Recreation is supported by a 0.75 millage. This millage not only created the recreation agency that services Genoa, Marion, Oceola and Howell townships it also finances the parks and services the residents of these townships use and rely on.

In Macomb County, the cities of Roseville and Eastpointe created a joint recreation authority through a 1 mill tax levy that was originally approved by voters 2011. This millage allows the authority to operate, offer services (which produce revenue, also allowing the authority to operate) and maintain and update facilities and parks. Municipalities such as Washington and Macomb townships also have millages (one for each township, they do not have a joint authority) that support their parks and their recreation opportunities.

So, while tax dollars are a primary source of funding for our parks, and the opportunities they provide, the commitment to their allocation varies. Additionally, commitment to the funding of public parks comes from other sources as well. For example, there are the revenues generated from their use (fee structures differ from one park to the next, one program to the next and one municipality to the next), donations offered from various people and groups and grants that municipalities receive.

The grants that municipalities can apply for to support their parks are rather plentiful; the MDNR, the Southeastern Michigan Council of Governments, Ralph C. Wilson Jr. Foundation are just some of many organizations that allocate grand fund to support parks and recreation opportunities. However, grants are often a one-time allocation of funds and cannot be relied on to ensure a park, its staffing, its programs and more will continue from one year to the next.

To ensure the park land, and the programs associated with it, we all benefit from remains accessible and useable we must create dedicated funding mechanisms. Millages are one source, but must be approved by voters. And, while general fund dollars flow into a municipality on an annual basis, the allocation of those funds differs annually.

Park Land is Plentiful in Southeastern Michigan

In Southeastern Michigan there are more than 2,300 parks which are owned and operated by either the federal government, State of Michigan, a local municipality, the Huron Clinton Metroparks Authority or a private entity. The footprint of these parks covers more than 214,000 acres and much of these parks are concentrated in the more heavily populated areas of Southeastern Michigan, such as Wayne, Oakland and Macomb counties. For example, in the City of Detroit there are 359 total parks, which range in size, type (passive, active, trails, etc.) and ownership (city, state, private).  Parks are viewed as an essential service because they increase economic value, provide health and environmental benefits and create an aspect of community, allowing for greater socialization. Furthermore, understanding how accessible parks and recreation amenities are can help communities prioritize improvements that serve more people.

In Southeastern Michigan 1,847 of the parks in the region, or 80 percent, are owned and operated by local municipalities. For example, of the 359 parks in Detroit about 350 are owned and operated by the City itself, the others are owned and operated by the Michigan Department of Natural Resources or private entities. Private entities in the region own and operate the second highest number of parks in the region, followed by counties. The way in which counties prioritize parks in the region varies greatly. For example, in Macomb County there are only two county parks—Freedom Hill, which serves as an entertainment center, and the Macomb Orchard Trail, which is a 26 mile long multiuse path that is overseen by a board comprised of a county representative and one person from each community that also pays into the system. In Oakland County there are 13 parks and in Washtenaw County there are well over 20 different parks, many of which are nature preserves.

Public parks are largely funded by public monies and each municipality’s priorities are reflected in how their dollars are spent. So, in the case of Washtenaw and Oakland counties, for example, we see that the counties themselves place a higher priority on access to parks. The emphasis on parks and recreation opportunities in communities can not only be seen by how the general fund dollars are allocated to such amenities, but also by if there are additional taxes voted on by residents to further increase parks and recreation amenities and access to them.

While funding allocations to parks differ from one county, and community, to the next, we do know that access to parks in the region is easily attainable for most. As noted, majority of the parks are concentrated in more heavily populated areas, but according to the Southeastern Michigan Council of Government’s (SEMCOG) 2019 Parks and Recreation Master Plan, parks and recreation opportunities are accessible within a 10-minute drive for nearly every household in the region. Additionally, according to the study, a 10-minute bike ride provides access to parks for 89 percent of households in the region. The study does show that for 42 percent of households in the region access to parks within 10 minutes of walking or use public transportation is not attaintable, posing a barrier of access to those who may not have a reliable use of their transportation. The lack of a strong public transportation system in the region does prove to be problematic for those who want/need reliable access to parks, especially the region’s largest parks. Since larger parks are located in less populated areas those without reliable transportation of their own, who may rely on public transportation, will have greater difficulty in reaching the larger parks. SEMCOG’s Access to Core Services report state that 7 percent of all households and 13 percent of transit-dependent households are within a 30-minute transit trip to a park greater than 200 acres in size.

The maps below highlight where parks are located in the region.

As noted, parks are viewed as an essential amenity within a community. However, funding to maintain and improve parks and recreation amenities is also vital to ensure such access. While we know majority of the region can access parks and recreation opportunities currently, we will further look into some of the funding structures that allow for such access in a later post and evaluate their long-term viability. We will also look deeper into the access of parks as it relates to the socioeconomic makeups of communities in Southeastern Michigan.

Broadband Not Accessible for All in Metro-Detroit

Even in the age of the internet, accessibility is limited for many, including in Southeastern Michigan.

According to the Southeastern Michigan Council of Governments (SEMCOG), there are about 1.6 billion homes in the seven county region with broadband and about 250,000 without it. In other words about 87 percent of homes in the region have internet and 13 percent are without it.

Access to broadband connectivity is two-fold though.

In a small percentage of the region there is no connectivity. In Southeastern Michigan, 99 percent of homes have access to broadband and 1 percent do not; this equals to out about 1.9 homes having access to broadband and about 10,000 not having access. The first map below highlights where any kind of access to the internet lacks. Each county in the region is affected, with very small neighborhoods in even some of the most populated areas (Detroit, Canton, West Bloomfield, etc.) experiencing some dead zones. However, the more rural areas in the region (north Macomb County, western Livingston and western Washtenaw counties) and several areas throughout St. Clair and Macomb counties) have much larger areas where access to broadband does not exist. While the land area where access is lacking looks large, the population that lives in these areas must also be considered. As noted, overall, there are about 10,000 people who do not have access to the internet due to service not existing where they live.

The first chart below highlights those who are underserved by broadband, which not only includes those who do not have access to broadband at all but also those who do not have access to highspeed internet (meaning they may have access to slower internet that does not allow for extensive streaming, downloading, etc.). St. Clair County has the highest percentage of homes that are underserved at  7.1 percent, followed by Monroe County where 2.5 percent of homes are underserved. Oakland County has the lowest percentage of homes that are underserved at 0.4 percent.

***All data in this post is provided by SEMCOG***

While the existence of broadband infrastructure is a concern, so is overall access, especially for those who have limited access to the infrastructure. The chart below shows the percentage of homes that do not use the internet. Wayne County has the highest percentage of homes that do not use the internet at 19 percent and, conversely, Washtenaw County has the lowest percentage of homes that do not use the internet at 7 percent.

Factors that play into a home being able to obtain broadband include income, age and race. For example, in Wayne County, 49 percent of households with an average income of $20,000 a year or less do not have the internet. This income bracket has the highest percentage of homes without internet across the region. When examining aging groups that data shows that 33 percent of the 65-years-of-age and older population does not have the internet; this is the age bracket with the highest percentage of individuals without access. And, finally, 13 percentage of the black population in Wayne County does not use the internet. Blacks have  the highest percentage of non-usage in Wayne County, and in every other county in the region.

Access to the internet is vital for many. This was fully demonstratated when COVID made remote work and school a necessity. As our society continues to evolve, access to this lifeline must become more accessibility to the population despite their location, income, race and age. As the data shows, race, income and age certainly play a factor in accessibility so breaking down those barriers must be a priority, as should developing stronger infrastructure in more rural areas. 

Locally, Washtenaw County has committed more than $13 million in American Rescue Act Funding to expand affordable and equitable high-speed broadband infrastructure to unserved and underserved communities. This is part of a larger investment by Washtenaw County which is focused on connecting every to high-speed broadband infrastructure.

Additionally, the City of Detroit is creating a test fiber-to-the-home connectivity project in Hope Village. This project will connect about 2,000 homes to affordable service. This project is also being funded by the American Rescue Act.

With millions of dollars dispersed to every county in American Rescue Act Funding, this should certainly become a priority for more places than just Washtenaw County.

Alcohol Causes Most Traffic Deaths in Southeastern Michigan, Distracted Driving Causes Most Injuries

Traffic fatalities in Michigan totaled just under 1,000 in 2018, a number that officials from the Michigan State Police said is too high. However, that number was below the 2016 and 2017 traffic fatality numbers which rose above 1,000. Below we examine the number of traffic fatalities and injuries in Southeastern Michigan, along with the number of fatalities and injuries related to alcohol, distracted driving and drugs. As the charts show, of the factors examined, alcohol is the largest contributor to traffic fatalities in the region.  

Wayne County, which is also the largest county in the state, had the highest number of traffic fatalities at 164, 63 of which were alcohol related. Distracted driving contributed to 6 of the164 deaths and drugs contributed to 38. Oakland and Macomb counties had the second and third highest number of traffic fatalities in the region at 54 and 53. In Oakland County, of the 54 traffic fatalities, 13 were alcohol related, 3 were related to distracted driving and 8 were related to drugs. For Macomb County, alcohol contributed to 18 of the 53 traffic deaths and distracted driving contributed to 3 of the deaths; there were not any drug related traffic deaths.

When looking at the percentage of alcohol related traffic deaths compared to the total number of traffic deaths, Monroe County had the highest rate. Of the 29 traffic deaths in Monroe County in 2018, 48 percent of them (14) were alcohol related. St. Clair County had the lowest percentage at 6 percent. In 2018 there were 16 traffic deaths in St. Clair County and 1 was alcohol related. With those two exceptions, the percentage of alcohol related traffic deaths ranges between 24 and 38 percent.

Of the other two factors, drugs contributed more to traffic fatalities than distracted driving.

Injuries related to vehicle accidents are higher than fatalities and while Wayne, Oakland and Macomb still had the highest numbers in the region, the data shows that distracted driving was reported to be the largest contributor of the factors examined. Overall, data indicated that distracted driving contributed to an average of 10 percent of the traffic related injuries in Southeastern Michigan in 2018. In Macomb C, Monroe and Washtenaw counties distracted driving contributed to 11 percent of the traffic related injuries and in Wayne County distracted driving contributed to 7 percent.

 Although Wayne County had the lowest percentage of distracted driving related traffic injuries in the region, it had the highest number at 1,082 (there were 16,578 total injuries). Alcohol was related to 897 traffic injuries in Wayne County and drugs were related to 281 injuries. In Oakland County there were 10,105 total traffic related injuries, 572 of which were alcohol related, 1,013 of which were related to distracted driving and 199 of which were related to drugs. In Macomb County there were 7,360 traffic related injuries, 391 of which were related to alcohol, 813 of which were related to distracted driving, and none of which were related to drugs. And, while Macomb County did not report any drug related traffic injuries in 2018, St. Clair County was the only county in the region where there were more drug related traffic injuries than alcohol or distracted driving injuries. In 2018 there were 931 traffic injuries in St. Clair County, 122 of which were related to drugs. 

While the full 2019 Michigan State Police Report on traffic fatalities and injuries has not been released, officials maintain that they continue to strive for fewer than 1,000 fatalities each year. Additionally, officials have said they believe the lower 2018 number is related to additional efforts made to educate drivers and stricter enforcement. The 2019 numbers will be released in March, and at that time we will examine the new data and compare it to historical data.

Detroit Vacancies Decline Over Long-Term, Slow Uptick Recently in Numbers

New information on vacancies in Detroit provides a mixed picture. There were 1,490 fewer vacant Detroit properties of all kinds between September 2018 and September 2019, according to the U.S. Postal Service. However, between June 2019 and September 2019 the number of residential vacancies increased by 61 (discussed below). Overall in the month of September of 2019 there were 82,738 vacant addresses.

Although there was a decrease in the number of vacant addresses, the percentage of vacant addresses in Detroit has remained between 21 and 22 percent since June of 2011. Vacancy rates reached 20 percent in December of 2010. The peak vacancy rate in Detroit, according to U.S. Postal Service data, was in March of 2015 when it was 22.8 percent; at that time it was equivalent to 88,017 vacant addresses.

Looking backward, (we have USPS data back through 2005) the lowest vacancy rate in Detroit was in December of 2005. At that point, the rate was 10.03 percent, and that was equivalent to 38,981 vacant properties. So, overall we witnessed more than a doubling of vacancies with a gradual decline to 82,738 from a peak of 88,017.

When examining only residential vacancy rates that rate was 21.34 percent in September of 2019, which was equivalent to 74,818 vacant residential addresses. The residential vacancy rate between September of 2019 and 2018 decreased by less than 1 percent, and the total number decreased by 2,239 residential addresses. The five-year difference was a decrease of 7,230 residential vacancies. The highest residential vacancy rate was 23.5 percent in March of 2015; the lowest residential vacancy rate was in February of 2008 at 15.8 percent. Following the peak residential vacancy rate in 2015, those numbers have been on the decline.

In addition to these changes, in September of 2019 there was not a change in the number of “no stat” addresses–properties denoted by mail carriers as being either “vacant” or “no-stat.” In September of 2019 the percent of no-stat properties was 6.2 percent.  These no-stat properties are ones that carriers on urban routes mark as vacant once no resident has collected mail for 90 days. Addresses in rural areas that appear to be vacant for 90 days are labeled no-stat, as are addresses for properties that are still under construction. So, urban addresses labeled are those a carrier deems as unlikely to be occupied again any time soon. That is, both areas where property is changing to other uses and areas of severe decline may have no-stat addresses.

The maps below demonstrate both the overall Detroit address vacancy rates (including residential and business vacancy rates) by Census Tract for September 2019 (first map) and the change in vacancy rates between September 2019 and September 2018 (second map). In total, there were about 65 Census Tracts in Detroit with total vacancy rates above 35 percent. The Census Tract with the highest vacancy rate in September of 2019 was located north of I-94, between there and I-96, with a rate of 55.8 percent. There were two large clusters of Census Tracts with vacancy rates above 35 percent, one cluster was located along I-96 south and west of the Davison Freeway, and the other was located on the eastside of the city along Gratiot Avenue.

While most of the Census Tracts in the City experienced a decrease in the number of vacancies from September 2018 to September 2019, there were about 40 tracts scattered all across the city that had an increase. The Census Tract with the highest increase was located on the City’s far west side and there was an increase of 7.2 percent. The tract with the largest vacancy rate decrease was located in Southwest Detroit and there was a decrease of 11.1 percent.

In addition to the U.S. Postal Service tracking vacancy data so does the U.S. Census Bureau. The chart below shows the differences that each agency reports in vacancy rates. The Census Bureau only tracks vacant houses while the U.S. Postal Service tracks residential properties, businesses and total vacancy rates. In the chart below only residential rates are examined. As the data shows, the Census regularly has higher residential vacancy rates as compared to the U.S. Postal Service. The most recent data for the Census data (2017) shows that the City’s residential vacancy rate was 29.2 percent and that was in 2017. The Postal Service’s equivalent rate was 22.4 percent at that time. The Census data is based on a sample of about 72,000 housing units. The U.S. Postal Service data is collected by postal service workers, if a residence is deemed occupied it means it requires mail service.  It is deemed vacant if it does not require mail service. One potential reason for the difference in vacancy rates is the fact that the Census data is based on samples while the U.S. Postal Service relies on postal carrier’s actual observations of the properties. 

Local Road Taxes Help Support Southeastern Michigan Roads

The state of the roads in Michigan are well known to be largely in poor condition, and funding never seems to be at a point to allow for a total overhaul toward long-term improvement. Road funding in Michigan doesn’t come from one dedicated source. Rather, there is federal funding provided by the Federal Highway Administration Highway Trust Fund, state funding provided by state fuel taxes, vehicle registration fees, income taxes, additional appropriations decided on by the Legislature, and local funding provided by general tax revenue and additional road millages. This post shows the communities in Southeastern Michigan that have additional road millages to further improve the roads.

According to the data provided by the Michigan Department of Treasury, there are 73 communities in Southeastern Michigan that levy an additional tax to support road funding, along with two counties. These millages are intended to improve road funding. Of all the communities that levy a road millage, the City of Melvindale has the highest road levy at 6.7 mills, followed by the City of Grosse Pointe and the City of St. Clair which both levy 2.5 mills. The City of Sterling Heights levies the fourth highest amount in the region at 2.47.

Freedom Township and St. Clair County levy the lowest amounts at 0.25 mills each. The only other county in the region to levy a road tax is Washtenaw County which has a 0.49 millage.

Another item to note is that there are more townships levy road taxes than cities and villages. This is likely due to the fact that township roads are controlled by county road departments/commissions, meaning more competition for road dollars.

A mill is a $1 tax per $1,000 of assessed taxable value. For example, a homeowner with a house assessed at $200,000 (true value at $400,000) in a city that levies a 2.5 millage would pay an additional $250 in city taxes. Of course, how much money a community receives in total from a road millage will vary depending on the number of homes in a community along with the average home value of a community.

According to the Mackinac Center for Public Policy there is a strong correlation between improved road conditions and a road millage. According to the Center, 58 percent of roads in a city without a road millage are in poor condition. And, if a city has a road millage, each mill is correlated with a six-point reduction in the percentage of roads in poor condition. This is not necessarily true for villages, where 47 percent of roads in villages without a road millage are in poor condition. This differentiation could be due to the fact that villages typically have less taxable property value, meaning they would need a higher levy to get the dollars needed for more improvement.

Below is a map of communities in Southeastern Michigan that levy a road tax, along with lists to show what communities are making additional investments into their road infrastructure.

Water Rates Vary Due to Location, Use

Water rates throughout Southeastern Michigan vary greatly, despite the fact that most communities in the region receive their water through the Great Lakes Water Authority (GLWA). The GLWA was approved by Wayne, Oakland and Macomb counties’ Board of Commissioners in October of 2014 and on January 1, 2016 the regional authority became fully operational, ultimately as a result of Detroit’s bankruptcy. The county boards’ approval allowed the authority to form and for the GLWA to lease water and sewer infrastructure from the City of Detroit for 40 years at a cost of $50 million a year. The approval of the GLWA also meant that all Detroit Water and Sewer wholesale customers, with the exception of the City of Detroit (127 in all, 75% of which are in the tri-county area) are now customers of the Great Lakes Water Authority.

The Detroit/GLWA system consists of:

  • 640 miles of large water and sewer pipes
  • Five water treatment facilities
  • One major sewage treatment plant

The map below shows the commodity charge rates for Fiscal Year 2020, as approved by the GLWA. In total, the GLWA represents 127 different communities, not all are shown in the map below though because some receive their services through the smaller water authorities, such as the South Oakland County Water Authority (which is a member of the GLWA and then services communities in that area).   As the map shows, Bruce Township has the highest rate at $75.53 per million cubic feet (MCF). However, majority of the communities in the region that participate in the GLWA have commodity charge rates that range between $4.28 per mcf and $18.53 per mcf. The City of Ecorse has the lowest rate at $4.28 per mcf.

According to the GLWA, the charges vary across communities for a number of reasons. Of course, communities are in charge of their end rates but the GLWA starts with setting their commodity prices by creating a water budget, which is capped at a 4 percent increase each year. This budget is reflective of operating expenses, the cost of infrastructure and other costs. The GLWA then looks at the usage patterns of each community and where it is located in terms of its elevation and distance from a water plant. Location matters because the more electricity that is used to pump water to a community the more a city’s commodity charge will be. So, for example, Bruce Township is in the northern part of Macomb County so transportation is farther. Additionally, it does not have a storage facility (such as a water tower) that would allow it to store water at cheaper rates and distribute to customers. In addition to storage options, cities can also manage their water rates as charged by the GLWA by not exceeding max volume usage during peak hours and conserving.

Southeastern Michigan County Roads Far Below Average

In 2018 not one county in Southeastern Michigan had at least 25 percent of its road pavement deemed to be in “good” condition, according to the Southeastern Michigan Council of Government (SEMCOG). Rather, the pendulum swung the other way, with each county having at least 33 percent of its road pavement deemed to be in “poor” condition.

The ratings-“good,” “fair,” and “poor”-are determined according to the Pavement Surface Evaluation and Rating (PASER) system, which are linked to the Michigan Transportation Asset Management Council’s best practices. For roads to be deemed in “good” condition they must be new, or like new, and only require regular maintenance. Roads that are considered “fair” have some signs of aging and require preventative maintenance such as crack sealing and overlay, which will extend the life of the road. “Poor” condition roads require some type of rehabilitation or reconstruction and are near the end of their life.

Regionally, St. Clair County has the largest percentage of road pavement deemed to be in “poor” condition at 54 percent. Oakland County has the next largest percentage of road pavement in “poor” condition at 49 percent. Monroe County has the lowest percentage of roads deemed to be in “poor” condition at 33 percent.

With Monroe County having the lowest percentage of roads in “poor” condition it also has the highest percentage of roads in “good” condition at 36 percent. Wayne County has the lowest percentage of roads in “good” condition at 15 percent. In addition to Wayne, Oakland and St. Clair counties have less than 20 percent of its road pavement in “good” condition (16 and 17 percent, respectively).


In the “fair” condition category, Wayne County has the highest percentage of roads in that condition at 39 percent. Washtenaw County has the lowest percentage of “fair” condition roads at 28 percent.

By now, it is common knowledge that Michigan’s roads need attention, and the funding to ensure the reconstruction and general maintenance of the roads needs to change from its current structure. Gov. Gretchen Whitmer recently proposed a 45 cent fuel tax hike, which is said to increase state road funding by $2.5 billion by 2021. Under this plan, the distribution of road funds (which is determined by Public Act 51) would slightly differ. Each county would still receive its normal share of the state’s current 26.3 cent per-gallon gas tax, but the additional gas tax increase would be distributed based on the use of roadways.  Currently in Michigan, counties receive 56 percent of their funding from vehicle fees, 24 percent based on the miles of county roads and the remaining 20 percent is based on other factors.

Whether Whitmer’s plan will be adopted remains in the air, but there seems to be general agreement that more funding is needed to fix the roads.

The Fate of Transit Remains in Limbo in Southeastern Michigan

The fate of public transit in Southeastern Michigan continues to remain unknown. While the Suburban Mobility Authority For Regional Transportation (SMART) millage passed in communities throughout Oakland and Wayne counties and, just barely, in Macomb County the cohesion amongst public figures and, most importantly, the public continues to disintegrate. The continued outspoken opposition against the Regional Transit Authority (RTA) by Oakland County Executive Brooks Patterson and Macomb County Executive Mark Hackel tend to gain the most attention, but the near death of public transit in Macomb County should speak even louder. In Macomb County, when a SMART millage goes before voters the entire county must either approve or vote it down. Just last month the voters of Macomb County were asked to approve a SMART millage renewal. The voters did approve the millage renewal, but by a mere 23 votes, even though Hackel was urging for a “yes” vote on this proposal. Four years ago though, when Macomb County voters were asked to approve a millage increase, from 0.59 mills to 1 mill, the passage rate was 60 percent. This approval came before the 2016 RTA millage request that ultimately failed. This RTA millage proposal passed in Wayne and Washtenaw counties, where support was a given, and continues, by the elected officials and businesses, while it failed in Macomb and Oakland counties.

Two years later, officials still can’t come to a consensus on what the RTA proposal should be, which is why it will not appear on the November ballot.

The stories amongst elected officials remain the same, Patterson and Hackel don’t support transit in the form of the RTA, Wayne and Washtenaw county and Detroit officials see the need to expand on current systems and the messaging transit advocates have tried to push for years is not getting through. With the SMART millage passage transit options will continue to be provided in areas of Wayne, Oakland and Macomb counties. Additionally, the Detroit Department of Transportation and SMART continue to strengthen their relationship to provider faster and broader connectivity for transit users. However, the negativity propagated about regional transit from Patterson and Hackel seems to be trickling down to voters. It is vital that regional community, meaning the voters, comes together to push for a robust system that allows citizens greater opportunities to travel to jobs, educational institutions and health care providers. There must be support for a system that encourages economic growth, and most importantly, breaks down barriers that currently exist in Southeastern Michigan. To do this, citizens need to educate themselves on both sides of the regional transit debate, grow their understanding on what transit means for a region and not be afraid to speak against the loudest in the room.

As to public officials, one wonders when those officials who do support transit—those in Wayne County, Washtenaw County and Detroit—will realize that they can innovate without their recalcitrant neighbors to the north. A thriving transit system propelled by these governments will support the rapidly evolving growth economy along the east-west axes of I-94 and I-96/U.S. 23, even if our northern neighbors wish to lag. Let’s proceed intelligently and incrementally, if regional and rational are not feasible at this time.