More than half of region’s housing units are mortgaged

With majority of the housing units in the region are reported to have a mortgage, it is important to understand what cost of mortgages are for homeowners. In this post we examine the median monthly housing cost for homeowners with and without a mortgage, along with what percentage of a homeowner’s income the mortgage makes up.

Housing units with a mortgage

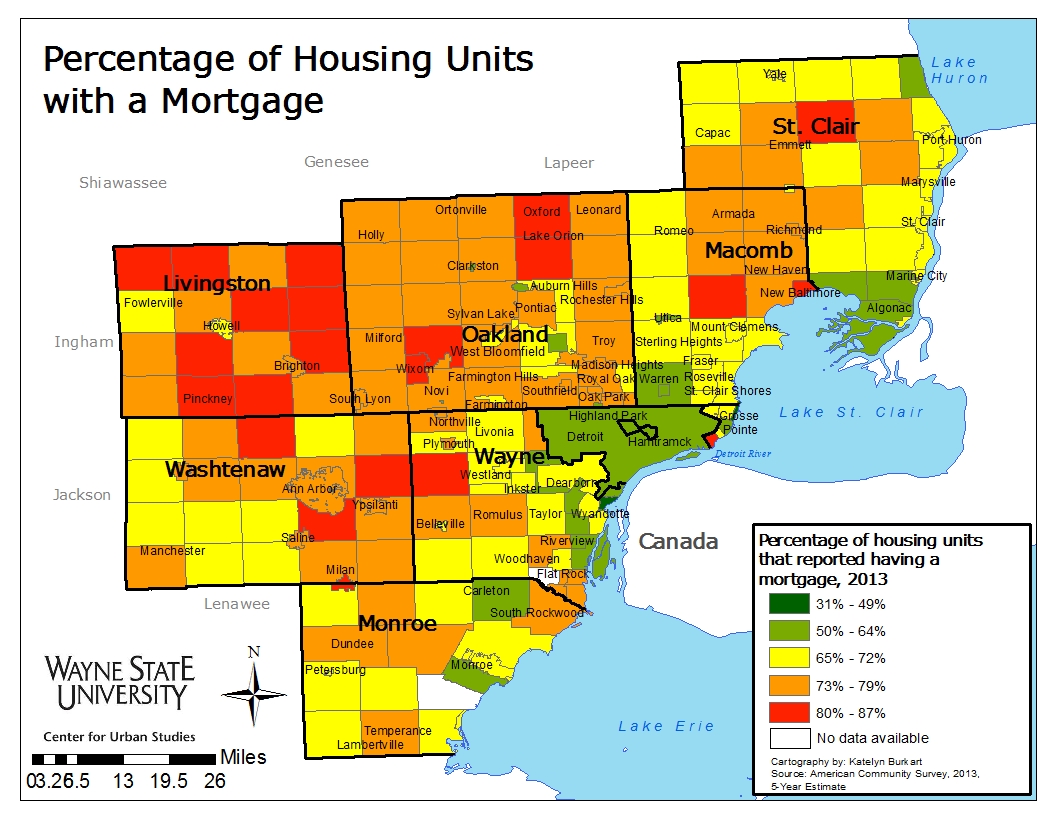
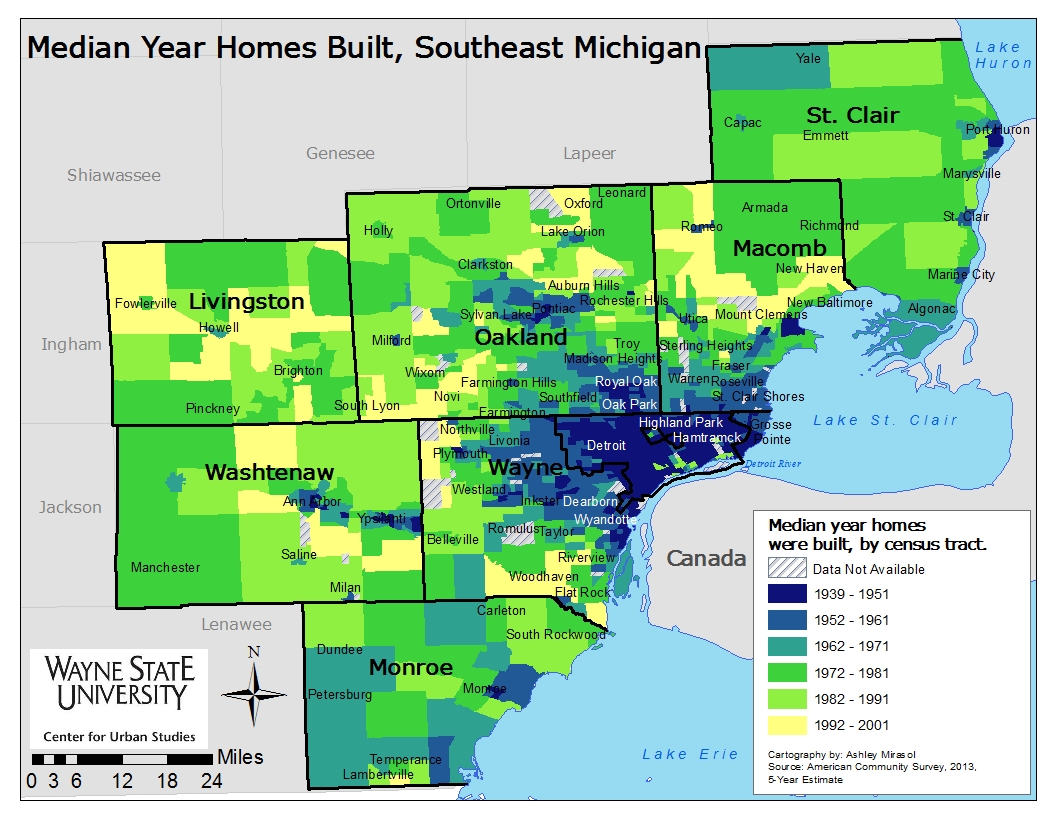
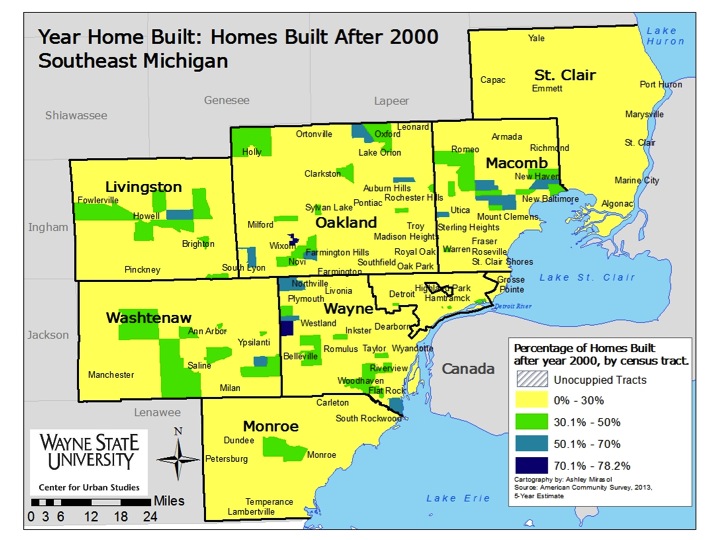
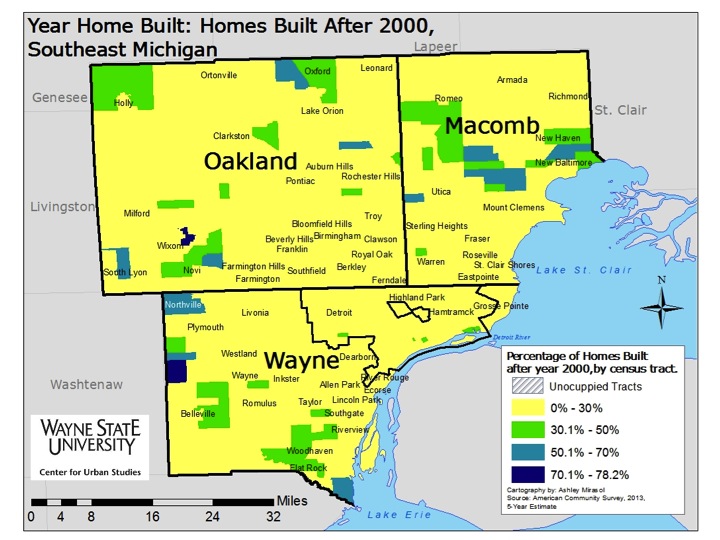
There were 22 communities out of 227 in Southeastern Michigan where more than 80 percent of the housing units reported having a mortgage according to the American Community Survey 5-year estimates for 2013. While this is only equivalent to about 10 percent of the region, it should be noted that many of these areas also have some of the newest housing units .

In the majority of the communities in the region 65 percent or more of the housing units were mortgaged. Detroit was on the low end of this spectrum with 51.1 percent of housing units having a mortgage. There was a handful of communities near Detroit where less than 60 percent of the owners reported having a mortgage. In addition, there were two in Monroe County and five in St. Clair County that were reported to be below 60 percent.

OwnerCostsWMortgage

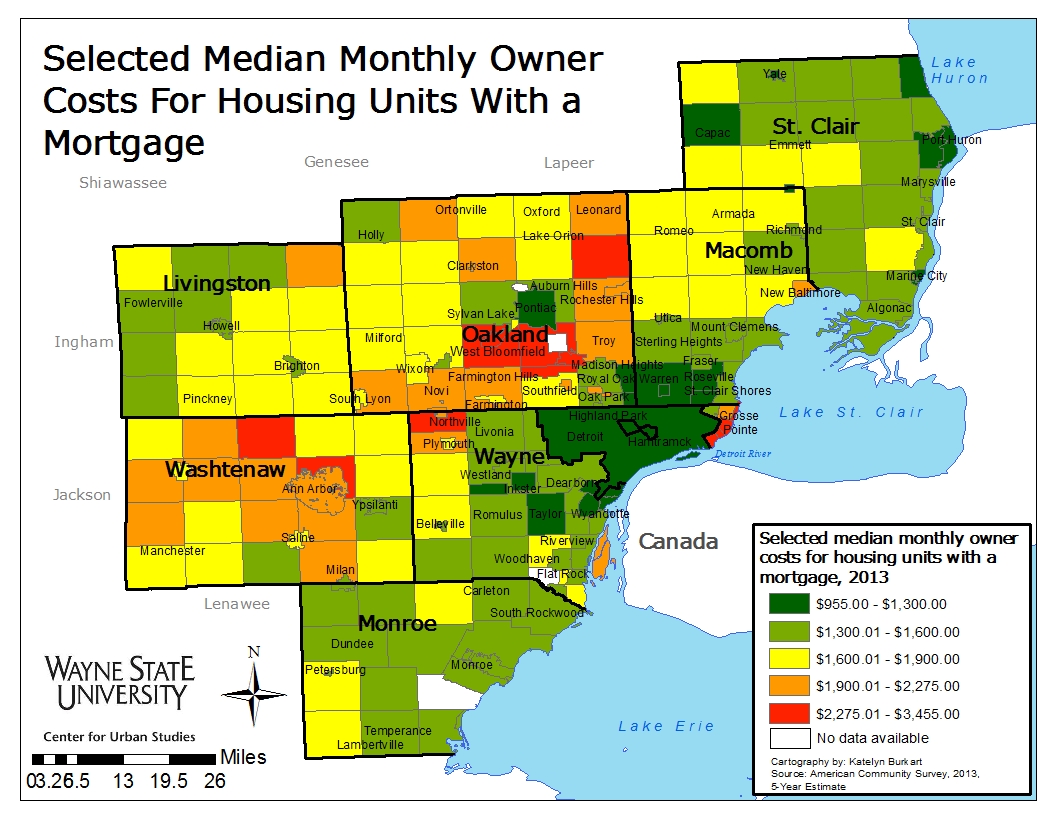
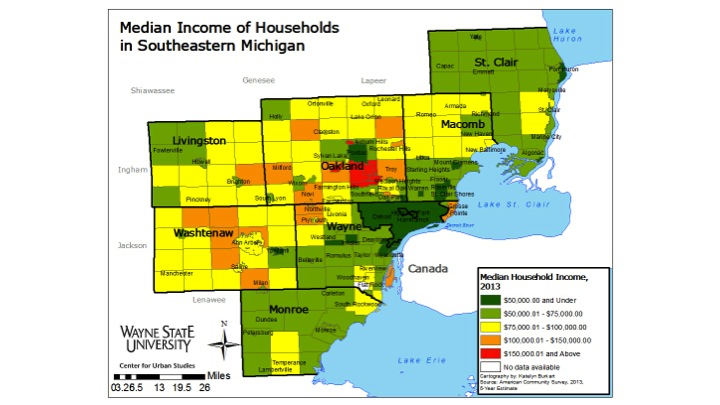
There are groups of households who have mortgage costs three or more times higher than households with the lowest cost mortgages. As one might expect, the highest median monthly owner costs for mortgaged housing units were located in the communities with some of the highest median incomes (link to past post). Those communities with the highest monthly owner housing unit cost were:

  • Bloomfield Hills: $4,000+
  • Northville: $2,478
  • Webster Township: $2,289
  • West Bloomfield: $2,200
  • Grosse Pointe Farms: $2,189
  • Grosse Ile: $2,126
  • Addison Township: $1,749
  • Ann Arbor Township: $1,540

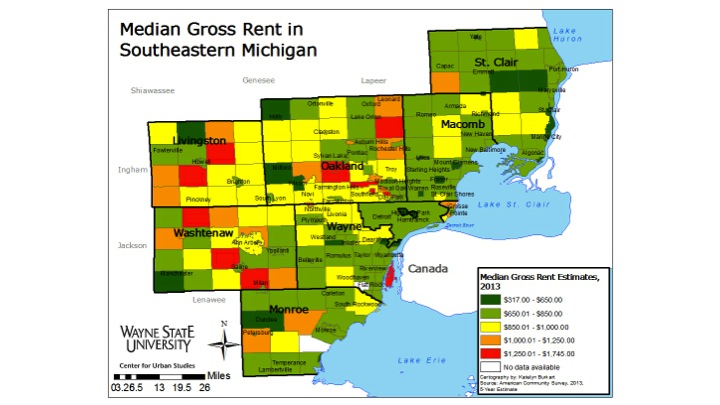
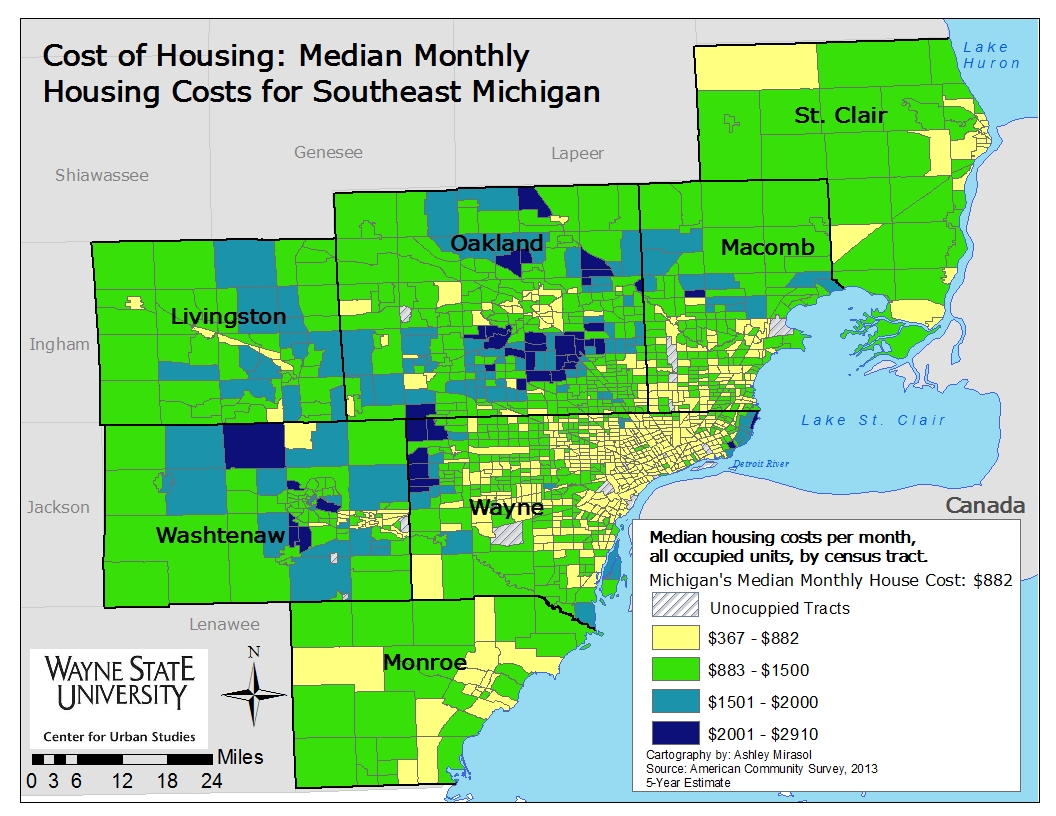
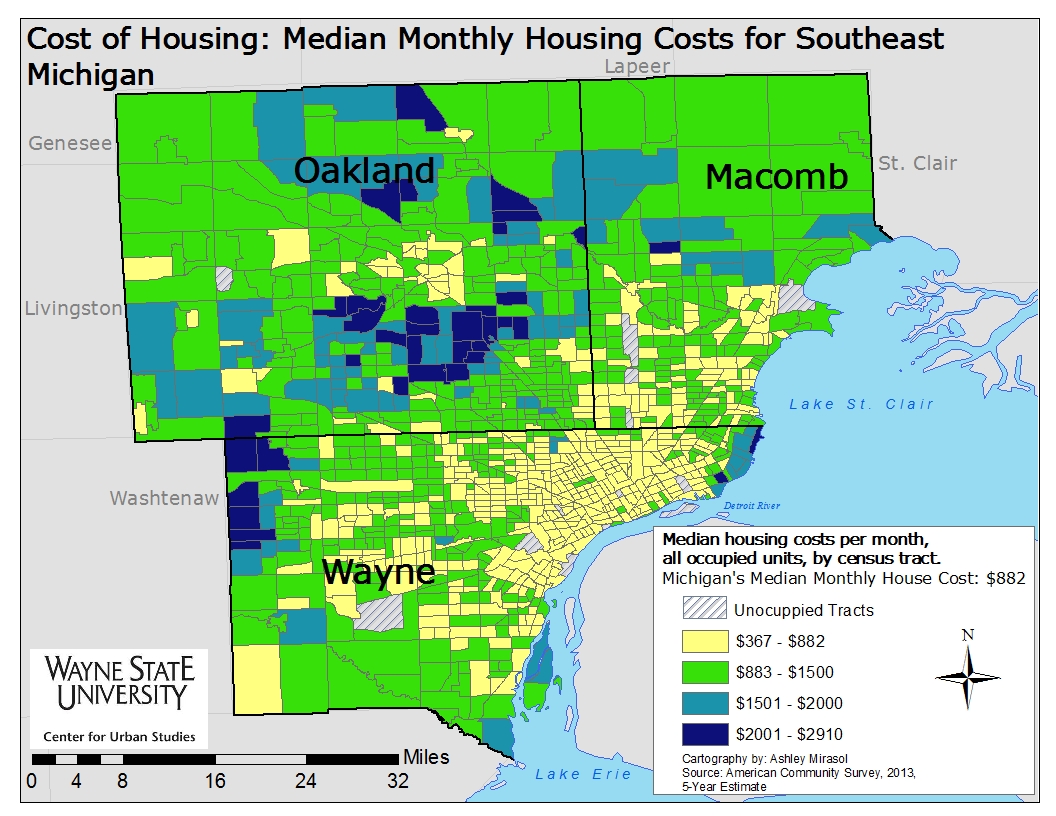
Most of the region, though, had median costs ranging between $1,300.01 and $1,900.

Detroit was only one of 18 other communities in the region where the median monthly cost was $1,300 or below. Pontiac was the only community in Oakland County in this category, and there were none in Livingston, Monroe, or Washtenaw counties.

OwnerCostsWOMortgage
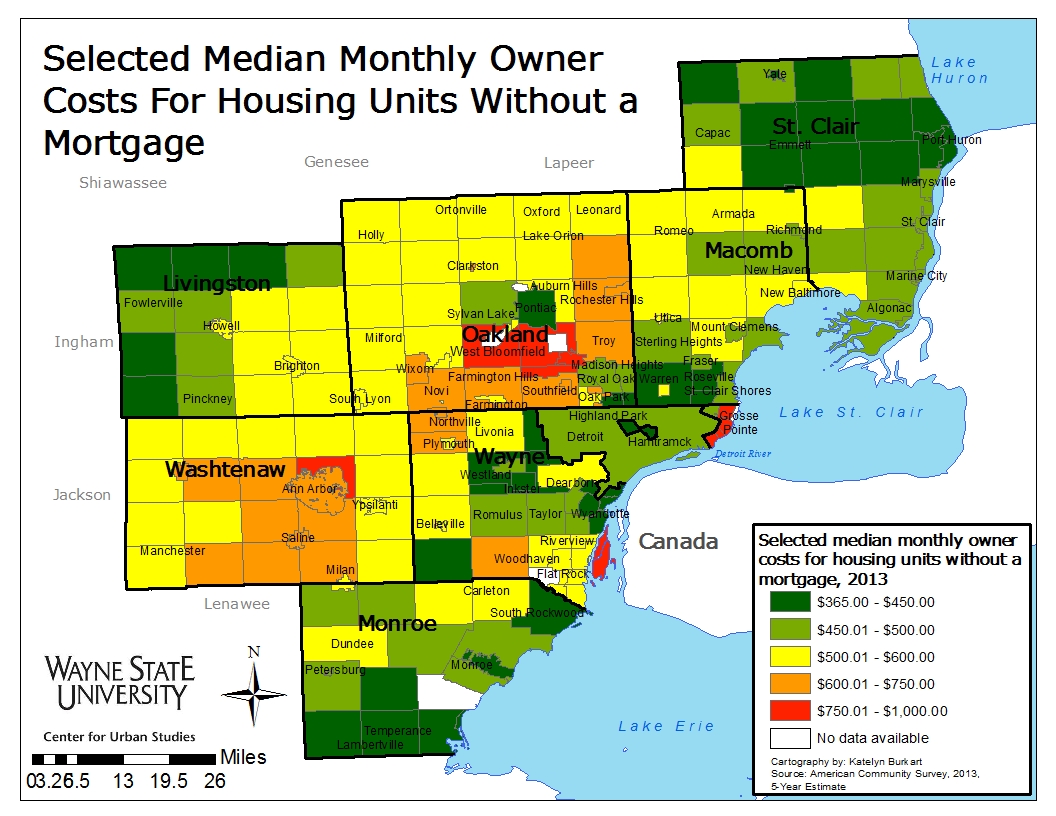
Homeowners actually have substantial costs above and beyond their mortgage. The Census Bureau includes: the U.S. Census bureau includes the sum of real estate taxes, various insurance costs, utilities, fuels, mobile home costs and condominium fees. The monthly median housing cost for units without a mortgage are notably smaller, ranging between $365 and $1,000. Additionally, many of the same communities with high median monthly housing unit costs with a mortgage also had high median monthly housing unit costs without a mortgage.

OwnerCosts35pctorHigher

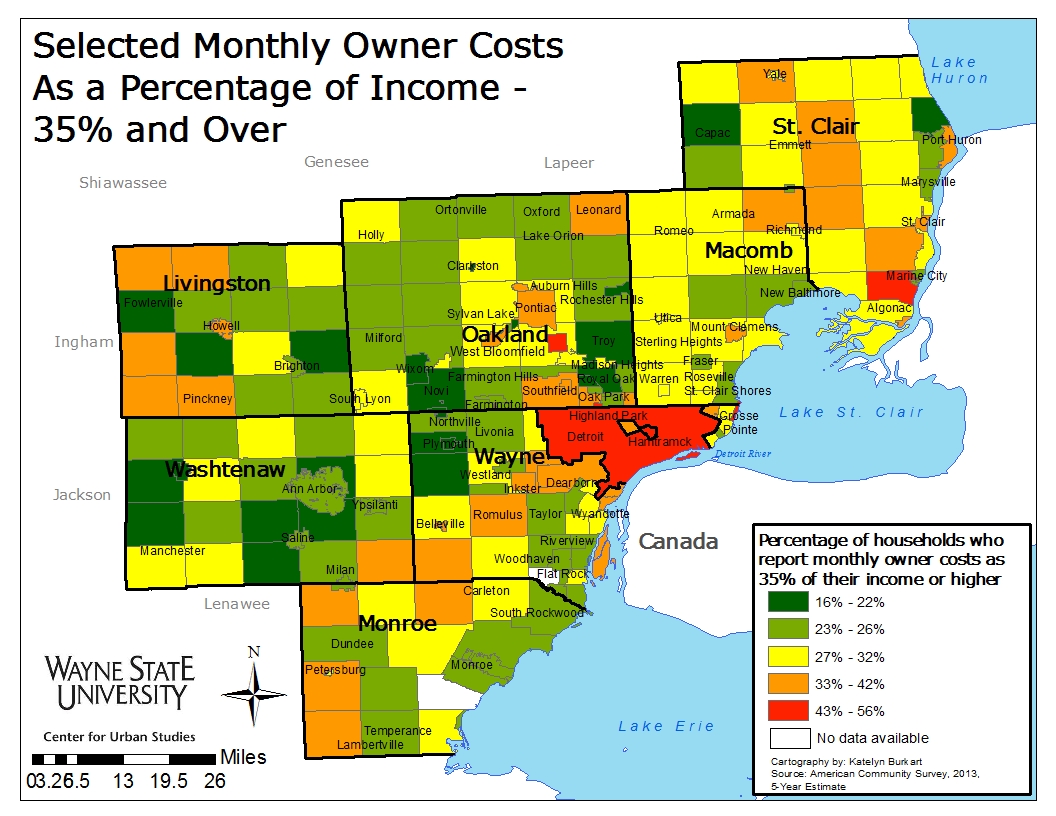
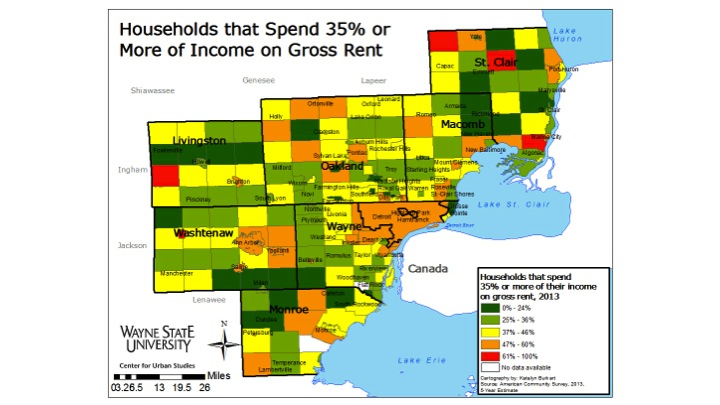
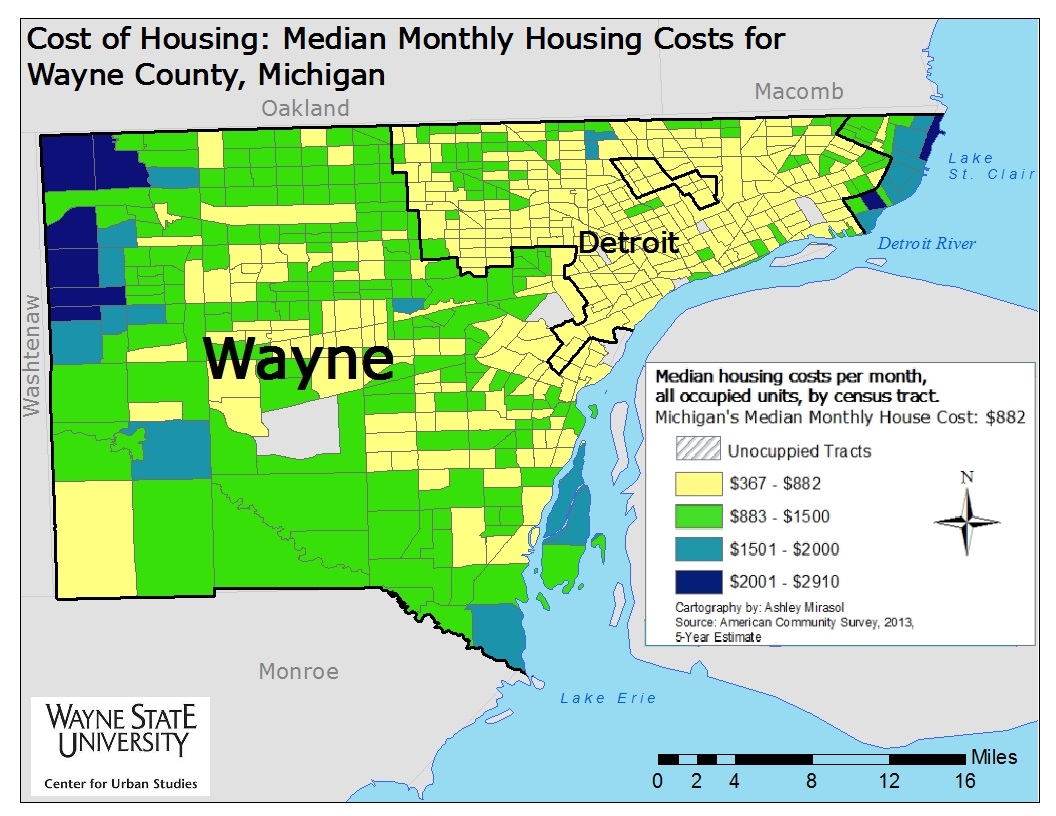
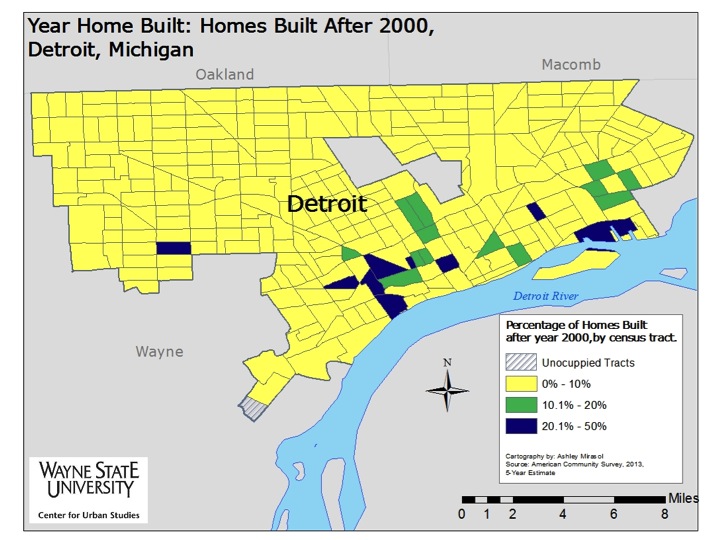
In the city of Detroit, about 65 percent of homeowners reported selected monthly owner costs (mortgage, taxes, utilities) between $700 and $1,499. These housing costs took up between 32 percent and 68 percent of the average Detroiter’s income, which was $26,325 in 2013. This is why more than 43 percent of Detroiter’s with a mortgage reported that it took up more than 35 percent of their income.

Only Marine City, Hamtramck and Bloomfield Hills also had more than 43 percent of their homeowners report that 35 percent or more of their income went to monthly owner costs.

In general many of the highest income communities had some of the lowest overall housing costs relative to income.

OwnerCostsLessthan20pctincome

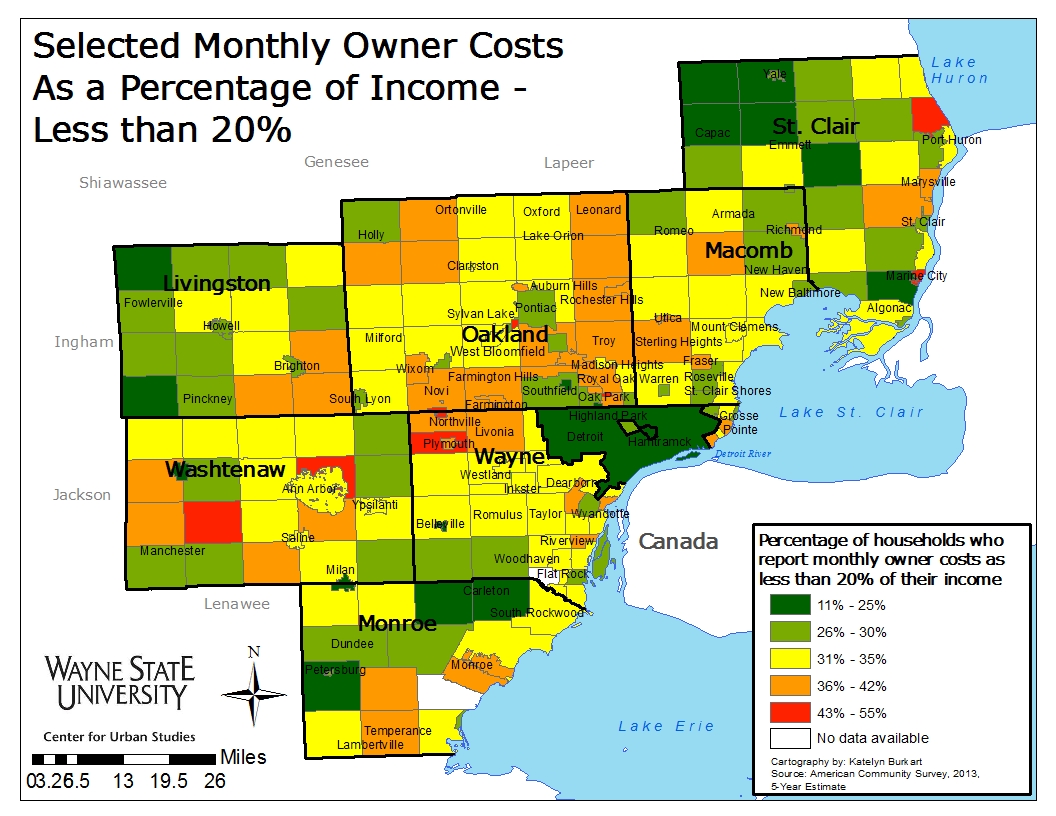
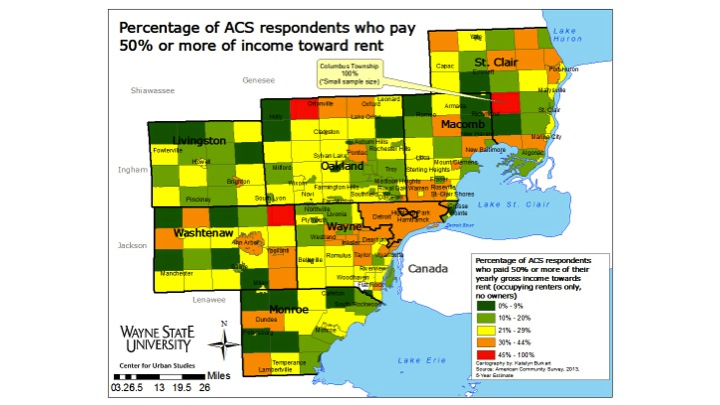
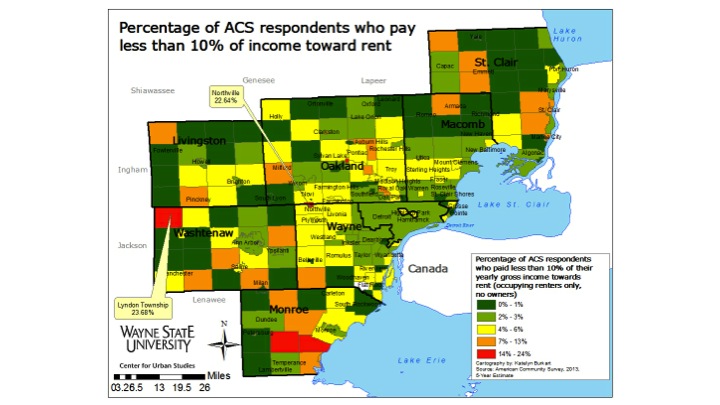
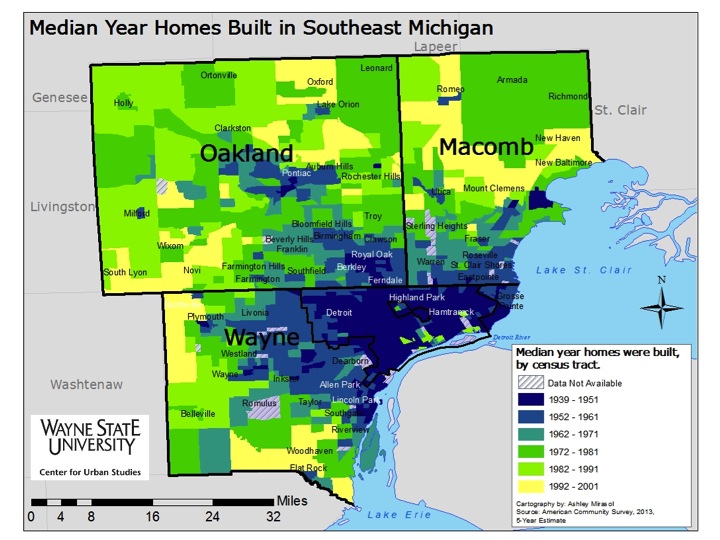
Effectively this is inverse of the previous map. Here we show the percent of homeowners who are paying less than 20 percent of their income for housing costs. There are five communities where more than 43 percent of homeowners reported their monthly housing costs to be less than 20 percent of their income. Many of these are, again, higher income communities. Some, however, including, Marine City, Port Huron, Plymouth and Ann Arbor are among the communities with the oldest housing stock, meaning that while their utility fees and taxes may not have decreased since the house was built, the mortgages could have been paid off by some of the owners due to the extended time they have owned the home.

High rental burden evident through Southeastern Michigan

In Southeastern Michigan, there were 11 communities with a median rental cost above $1,200 per unit, yet none of these municipalities had more than 46 percent of their tenants paying more than 35 percent of their income on gross rent. Regionally, the median household income ranges between about $75,000 and $100,000 at the municipal level. According to the U.S. Department of Housing and Urban Development, no more than a third of a household’s income should go toward rent. To highlight how a community’s median income compares to the percentage of rent of that income a household pays we have made three different maps:

  • Households that spend 35 percent or more of income on rent
  • Households that spend 50 percent or more of income on rent
  • Households that spend 10 percent or less of income on rent


First though, two basic maps showing median gross rent at the municipal level and median income at the municipal level are below. Gross rent is defined by the U.S. Census Bureau as the “amount of the contract rent plus the estimated average monthly cost of utilities (electricity, gas, and water and sewer) and fuels (oil, coal, kerosene, wood, etc.) if these are paid for by the renter.”

Overall, Lodi Township in Washtenaw County had the highest median gross rent in Southeastern Michigan at $1,571. Two other Washtenaw County townships, Dexter and York, also had median rental costs above $1,200. At the county level, though, it was Livingston County with the highest median rental costs at $917. Howell and Genoa townships in Livingston County had median rental costs of $1,202. Only one community in Wayne County, Grosse Ile Township, had a median rental cost above $1,200 ($1,201). Wayne County had the lowest overall median rental cost at $777.

When looking at the median-income map we see the same communities, with the exception of those in Livingston County, with the highest median rental costs also have some of the highest median incomes. For example, the median income in Lodi Township is about $107,000 a month. A third of that would be about $36,000 a year spent in rent, or close to $3,000 a month. While Lodi Township did have the highest median rental cost in the region at $1,571, that is nearly half of what that one-third threshold would be. In the city of Detroit though, the median household income is $26,325 annually, or about $2,200 a month. With a median gross rent cost of $761, that is almost exactly a third of the average renters’ income. The difference between the highest median income and lowest median income in the region is 100 percent while the difference between the highest median gross rent and lowest median gross rent is 138 percent. This shows us that average rent prices are not in proportion to average incomes.

Slide03

Slide04

In Southeastern Michigan there are 22 communities, or about 10 percent of the region, in which 24 percent or fewer of renters pay less than 35 percent of their income to gross rent. We see that majority of the region’s renters set aside between 25 percent and 46 percent of their income for gross rent costs. There were only five communities in the region where 61 percent or more of the renters spent 35 percent or more of their income on rent. When increasing that threshold to 50 percent, there were only three (Groveland Township, Salem Township and Columbus Township) communities in the region where 45 percent or more of renters spent more than half of their income on rent. When an individual or a family spends for than 30 percent of their gross income on rent this is called rent burden and according to the National Center for Children in Poverty about 80 percent of low income households with children experience it.

Excluding Columbus Township because of the small sample size, the median income for both Groveland and Salem townships range between $75,000 and $100,000 while the median rent ranges between $650 and $1,000.

Slide06

Slide07

Only four communities in Southeastern Michigan had 14 percent of more of renters paying less than 10 percent of their income toward rent in 2013, according to the American Community Survey. Lyndon Township in Livingston County had the highest percentage at 23 percent and Northville, which is on the border of Wayne and Oakland counties, had 22.64 percent. The other two communities were located in Monroe Township.

Slide09


According to the National Center for Children in Poverty urban areas typically experience higher rates of rental burden. However, in Southeastern Michigan we see that there were also several rural communities, such as Groveland Township, where tenants also experienced rental burden.


Lowest median housing costs concentrated in Detroit, surrounding communities

In Michigan, the median monthly housing cost in 2013 was $882, but in the Southeastern Michigan region that cost ranged from about $3,000 a month in areas of Oakland County to about $360 a month in areas of Wayne County.

In the map below we see that Detroit, some of the inner-ring suburbs, and areas along major highways (I-94, I-96) had the highest concentration of median monthly housing costs below that of the state’s in 2013. On the opposite end of the spectrum, the areas with the highest median monthly housing costs were primarily located throughout Oakland County (Bloomfield, Birmingham, etc.) and Washtenaw County (Ann Arbor, Dexter, Lyndon Township).

According to the 2013 American Community Survey, which provided the data for this post, the median monthly housing costs were calculated by dividing “the monthly housing costs distribution into two equal parts: one-half of the cases falling below the median monthly housing costs and one-half above the median. Medians are shown separately for units ‘with a mortgage’ and for units ‘not mortgaged.’ Median monthly housing costs [were] computed on the basis of a standard distribution.”

SE Michigan

In taking a closer look at the tri-county region, we see that 679 census tracts had a median monthly housing cost below $882 in 2013. And, while this trend spanned out into the southern portion of Macomb County (Warren-Eastpointe areas) and southwest of Detroit, there were only about a handful of census tracts in the portion of Oakland County that borders Wayne County where the median monthly housing cost was $882 or less. These areas in southern Oakland County are located in the Hazel Park-Ferndale-Oak Park area.

housingcostTRICOUNTY

Detroit had the largest number of census tracts where the median housing cost per month was at or below the state average of $882 in 2013. There was one census tract in Detroit (Palmer Woods area) where the monthly median housing was nearly double the state average (this tract includes Palmer Woods).

As seen below, median housing costs of $882 and below also spanned into the central portion of Wayne County, in areas such as Inkster, Dearborn and Romulus. With the exception of Sumpter Township, the most western portions of Wayne County had median monthly housing costs of $883 and more. Areas such as Northville and Canton had amongst the highest median housing costs in the county, ranging between $2,001 and $2,709. The only other area in the county with such high median housing costs were the Grosse Pointes.

This week, we took a look at overall median housing costs in region. In the following weeks, we will begin to explore what percentage of an individual’s income goes toward their rent or mortgage.

housingcostWAYNE

Refocusing Housing Policy in Detroit: Moving to Healthy Housing

The majority of families in Detroit face the risk of death, injury, illness and loss of their children’s mental capacity every day because of hazards in their homes. Based upon highly detailed analyses of homes, it is clear that homes are causing burns, falls, asthma, allergies and lead poisoning.

A detailed survey of Detroit homes, conducted by the Center for Urban Studies at Wayne State University, found that over 62 percent of nearly 500 randomly selected homes have at least one high risk hazard that is likely to lead to poor health outcomes. [1] Of these, 4.2 percent of the homes have three or more hazards in these high risk categories. These dangerous housing conditions, combined with high unemployment and continued crime, are driving people to leave the city in droves.

Recent estimates show Detroit is continuing to lose residents at fast clip, about 1,155 residents[2] a month.

The City is working hard on unemployment (and the improvement of the economy as a whole is helping) and on increased and smarter policing. But on housing for existing residents, far more needs to be done, not just by the City, but by the State and the Federal Government.

To stop this decline and avoid the health consequences of dangerous homes, Detroit and policy makers need to focus far more efforts on providing safe and healthy homes.

As of July 2014, Detroit had a total of 252,173 occupied housing units.[3] However, our best estimates—very generous–are that only around 500 a year are being substantially improved to make them healthy and safe places to live, while just over 800 new housing units were built last year.[4] This is an estimated total of 1,300 homes being produced per year. At this pace, it will be many decades before vast majority of Detroit’s residents can live in safe and healthy homes.

What is a reasonable goal for creating healthy homes for Detroit’s children? A modest goal would be to house all of Detroit’s 193,150 children[5] in safe housing within 10 years. Approximately 3 percent of households (or around 6,000 children) already reside in housing built later than 1980[6] and, in most cases, this is relatively safe housing.[7] A total of about 79,400 households with children live in pre-1980 housing, and we estimate 38 percent are in houses that have only minor hazards[8]. That means 49,259 households are living in homes where one or more major hazard puts them at risk every day. Having nearly 50,000 households plagued with one or more hazards is unacceptable, which is why the families residing in these homes need either new or rehabilitated housing, and they need it soon.

Within 10 years—a short time in the policy world—policy makers should be able to address these needs. To avoid deaths, injuries, illness and loss of mental capacity caused by home environments, Detroit needs at least 4,900 new or rehabilitated homes a year. That is 3.8 times the number we estimate that is being produced now. And this is only the number necessary to protect families with children, not other vulnerable populations such as the elderly.

We need to massively expand renovation and construction, specifically, in these ways:

  • First, concentrate on housing with children, the most vulnerable among us, for rehabilitation;
  • Let’s give families with children a priority to relocate to subsidized housing that has been built after 1980 or that has been re-built and remediated, including lead abatement.
  • Make homes healthy through small investments. Some homes can be made healthy for an investment of substantially less than $5,000. The Green & Healthy Homes Initiative Detroit-Wayne County has shown this can be done. We need to do more of this.
  • Work to improve and remove hazards from current houses, rather than new construction. In cases where the abatement of lead hazards is necessary, the work can cost an average of $20,000,[9] still a fraction of the cost of a new construction.
  • Use code enforcement to force rental owners to substantially improve homes. Progress is being made here, but the number of code inspectors, cut sharply in the midst of Detroit’s fiscal difficulties, needs to be expanded substantially.
  • Ensure all new construction in Detroit includes affordable units.
  • Increasingly the private sector is rehabilitating homes in Detroit. These rehabilitations should pass all standards, especially including the removal of asbestos and lead-based paint. Currently, private sector rehabilitations do not have to pass all standards among governmental and lending organizations that control the sale and rehabilitation of many of these homes.
  • Leverage local and state resources, ranging from public entities to non-profit and for-profit organizations, to develop a robust rehabilitation program. Mayor Duggan has made a good start here with his zero interest loan program, but many families cannot meet the income and other requirements required by this program. We need grant programs to assist these low income homeowners.
  • Many thousands of families are living in homes that have black mold and other major damage from the August, 2014 floods across Detroit and other communities in Southeast Michigan. FEMA and other agencies need to invest in these homes to protect people from major health problems.

Healthy Homes Risk Assessments 

These maps below are based on a random sample of 500 homes spread broadly across Detroit. At each house assessors completed a Healthy Homes Rating System assessment that examined 29 potential hazards. This rating system is a HUD-endorsed rating instrument that assesses both the probability of injury and extent of injury from a hazard.  Three of the most frequently occurring and severe hazards were excess cold, mold and dampness and lead paint. The following three maps portray of the areas of Detroit that had the highest levels of hazards.

Lead

HHRSMold Cold


[1] This data is collected using the Healthy Homes Rating System (http://portal.hud.gov/hudportal/HUD?src=/program_offices/healthy_homes/hhrs). According to this system, a “high-risk” hazard is identified by a rating of A, B or C on a scale of A-J, A being highest likelihood of serious injury or death and J being minimal risk.

[2] This calculation is based on the April 1, 2010 estimate based on the Census and a 2014 estimate from SEMCOG, broken down into a monthly estimate by simple division across the months.

[3] SEMCOG Community Profile, City of Detroit (http://www.semcog.org/Data/Apps/comprof/people.cfm?cpid=5)

[4] At best only several hundred houses a year are being improved to systematically reduce health hazards. It is important to note, however, that about 806 new housing units were constructed in Detroit last year.

[5]U.S. Census Bureau, Demographic and Housing Estimates, 2013 American Community Survey 1-Year Estimates, Detroit city, Michigan (http://factfinder2.census.gov/faces/tableservices/jsf/pages/productview.xhtml?pid=ACS_11_5YR_DP04)

[6] U.S. Census Bureau, Households and Families, 2013 American Community Survey 1-Year Estimates, Detroit city, Michigan (http://factfinder.census.gov/faces/tableservices/jsf/pages/productview.xhtml?pid=ACS_13_1YR_S1101&prodType=table), U.S. Census Bureau, Households and Families, 2013 American Community Survey 1-Year Estimates, Detroit city, Michigan (http://factfinder.census.gov/faces/tableservices/jsf/pages/productview.xhtml?pid=ACS_13_1YR_DP04&prodType=table) This is probably an underestimate as we were unable to obtain of precise occupancy data for post-1980 housing.

[7] It is also important to know that lead paint was banned for use in residences in 1978 and taken off the shelves in 1980.

[8] This estimate is based on the results from the Healthy Homes Rating System being conducted in Detroit.

[9] This cost may include the replacement of all windows within the home as this is a major source of lead.

Region’s oldest homes primarily concentrated in Detroit

Vacancy data shows that the region’s oldest homes face higher rates of abandonment. And Detroit has the biggest challenge in this regard. However, data in this post shows that many suburban and rural communities also have an aging housing infrastructure. These homes will require increasing amounts of investment to remain safe and habitable. The maps below show that a number of communities had an average housing stock of greater than 50 years old. For instance, the city of Detroit’s average year that a house was built was 1939. In the maps below we see that majority of the region’s housing stock was built between 1972 and 1991, but that Wayne County and the Woodward Corridor has older housing on average than other areas.

SEMCOG Housing Age


Slide04

housingDETROITmediantr (1)

Throughout the seven-county region, with the exception of the city of Detroit, we see that the median age of the housing stock is between 24 and 43 years (meaning they were built between 1972 and 1991). This fact corresponds with the beginning of population loss in Detroit (1960s), when residents began to move in large numbers to the suburbs. Other regional communities, such as Royal Oak, Pontiac and Livonia, neared their population peaks in the 1970s (view our previous post on the growth and decline of the region’s population here).

In addition, the maps shows us that Detroit’s median housing age is between 64 and 76 (meaning they were built between 1939 and 1951). It was during 1950 when Detroit’s population peaked at 1.8 million, so it is logical to think that a large portion of its housing stock was built leading up to that population peak.

Other areas where the median age of housing ranges between 64 and 76 years of age include Port Huron, Pontiac, Hamtramck and Highland Park. Hamtramck and Highland Park experienced population growth through the 1930s, largely as a result of the Dodge Main Plant and Highland Park Plant automotive facilities being built in those respective cities. Pontiac was also home to an automotive plant and experienced population growth during the same time as Detroit. Pontiac is also the county seat for Oakland County.

(For more information regarding the population growth of the municipalities mentioned above and the reasoning behind such growth click here).

HousingyearTRICOUNTY1939 (2)

housingyrDETROIT1939

The city of Detroit had the largest total number of of homes built before 1939, with nearly 120,000 still standing, representing 32.8 percent of the city’s housing current housing stock. However, the majority of the region had 30 percent or less of its housing stock built prior to 1939 at the city level. Older communities such as Hamtramck, Highland Park, Romeo, Ferndale, Pontiac and Plymouth had significant older housing stocks when compared to other suburbs.

Another area where more than 50 percent of the housing stock was built prior to 1939 was Mount Clemens, one of the region’s oldest cities (it was established in 1818 and became a city in 1879). Mount Clemens is the county seat for Macomb County and was popular vacation spot for many throughout the late 1800s and early 1900s because of its mineral baths.

Slide10

Metro-Detroit Housing afte 2000

Detroit Housing after 2000

Throughout the seven-county region, we see only a small percentage Census tracts with more than 10% of homes built after 2000. The Canton area in western Wayne County had the highest percentage of newer homes as of 2013, with more than 70 percent of the area having housing stock built after 2000. In Detroit, there are census tracts near Belle Isle, Corktown and on the West Side that are more than 20 percent homes built after 2000.

Other areas in the region where more than 50 percent of the housing stock was built after 2000 are Macomb Township (which has been named one of Macomb County’s fastest growing community), Shelby Township, Holly, Howell, Monroe and communities surrounding Ann Arbor.

Overall, while there are some newly developed areas in the region, the majority of Southeastern Michigan’s housing stock was standing long before 2000. In addition, the newly developed areas tend to be outside suburbs.