Beyond the city proper, most early land annexations involved taking control of land that was undeveloped or farmed. At that time most of Wayne, Oakland, and Macomb counties were covered in swampy areas and drainage of these swamps allowed settlement into the new areas of Southeast Michigan.
Villages vs. City – Cities incorporate in order to have more power than a village designation. Villages are not autonomous to the townships they reside in and is vulnerable to annexation by neighboring cities that are looking to increase their tax base. Villages benefit from joining larger cities because they can take advantage of their infrastructure and city services. Throughout the development of the City of Detroit and Metro area, many smaller villages were formed. The ability to stand up to annexation came down to a village’s resources and the residents voting to join or form a larger city.
After 1909 – annexations were made much harder. Home Rules for cities and villages made it easier for the surrounding communities to both incorporate and avoid joining the City of Detroit. These home rules have set up something of a “turf war” with residents/politicians creating a dysfunctional system where they compete over resources, rather than working together as a regional unit.
This post examines how Detroit grew in size from 1806 to 1926. However, there are still questions as to what caused the city to stop annexing. In future posts we will further delve into what caused the city to stop annexing additional lands and what consequences the city of Detroit has experienced because of this.
For a close up of the images in the slideshow please scroll to the bottom of this post.
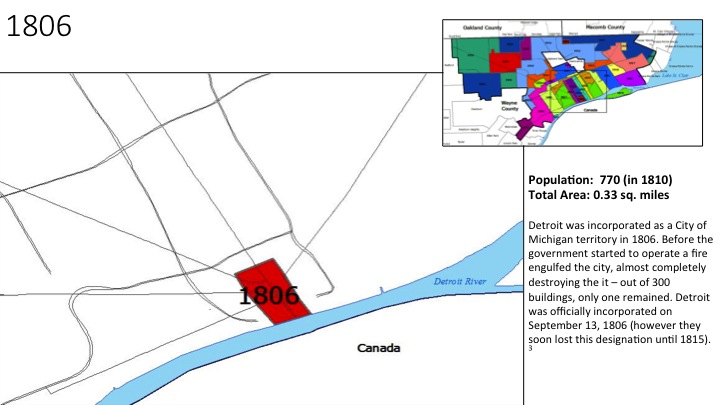
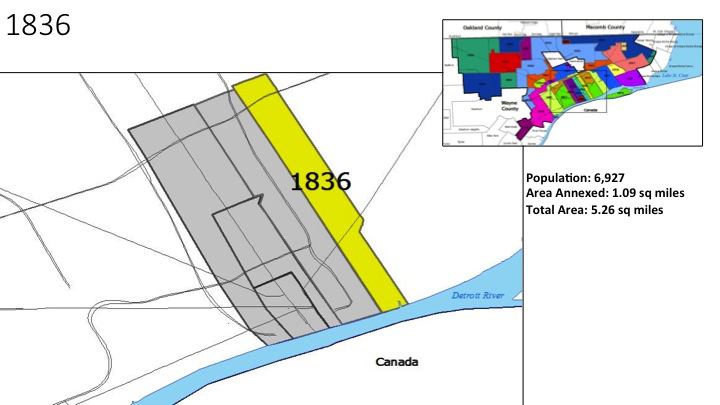
1806
Detroit was incorporated as a City of Michigan territory in 1806. Before the government started to operate a fire engulfed the city, almost completely destroying the it – out of 300 buildings, only one remained. Detroit was officially incorporated on September 13, 1806 (however they soon lost this designation until 1815).

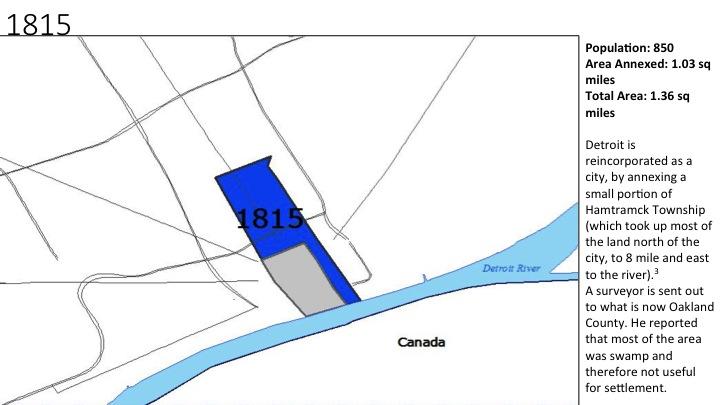
1815
Detroit is reincorporated as a city, by annexing a small portion of Hamtramck Township (which took up most of the land north of the city, to 8 mile and east to the river).3 �A surveyor is sent out to what is now Oakland County. He reported that most of the area was swamp and therefore not useful for settlement.
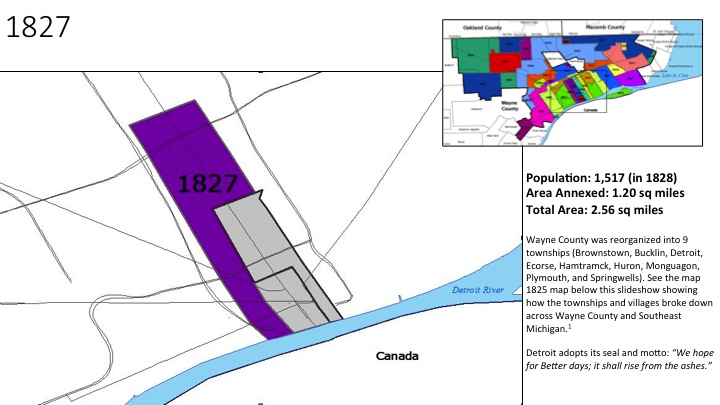
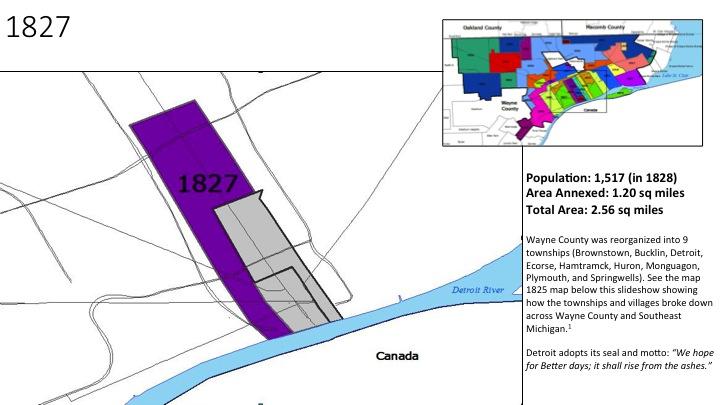
1827
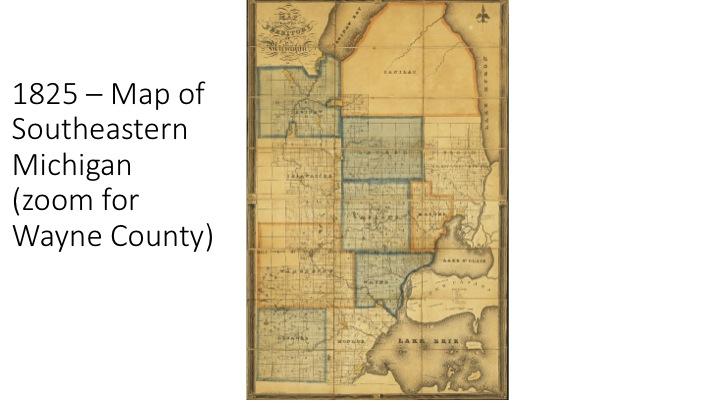
Wayne County was reorganized into 9 townships (Brownstown, Bucklin, Detroit, Ecorse, Hamtramck, Huron, Monguagon, Plymouth, and Springwells). See the map 1825 map below this slideshow showing how the townships and villages broke down across Wayne County and Southeast Michigan.1
Detroit adopts its seal and motto: “We hope for Better days; it shall rise from the ashes.”
Slide07
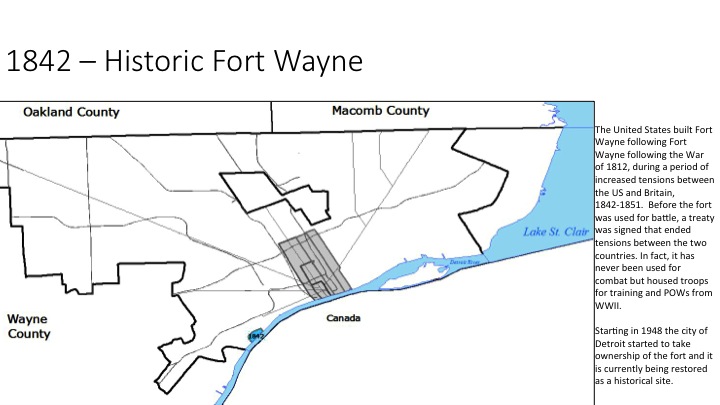
The United States built Fort Wayne following Fort Wayne following the War of 1812, during a period of increased tensions between the US and Britain, 1842-1851. Before the fort was used for battle, a treaty was signed that ended tensions between the two countries. In fact, it has never been used for combat but housed troops for training and POWs from WWII.
Starting in 1948 the city of Detroit started to take ownership of the fort and it is currently being restored as a historical site.

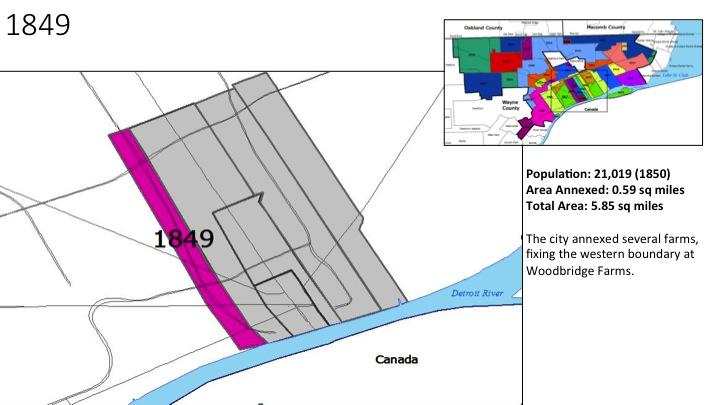
1849
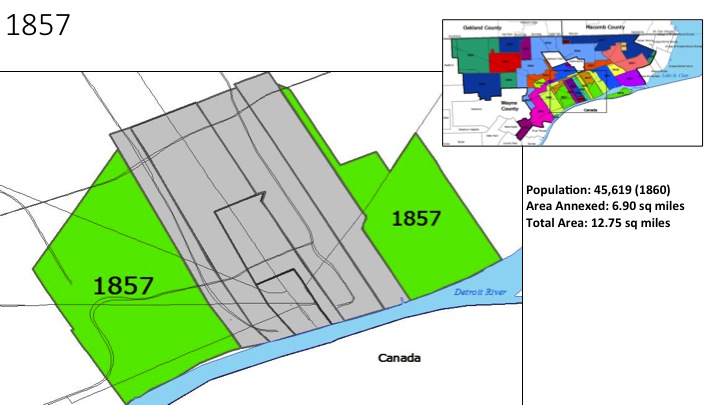
The city annexed several farms, fixing the western boundary at Woodbridge Farms.

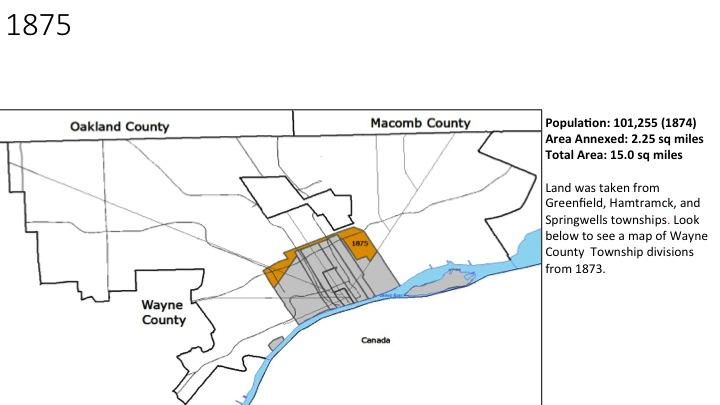
1875
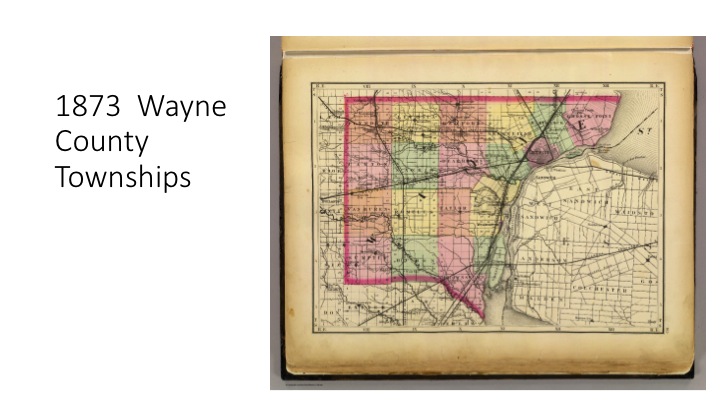
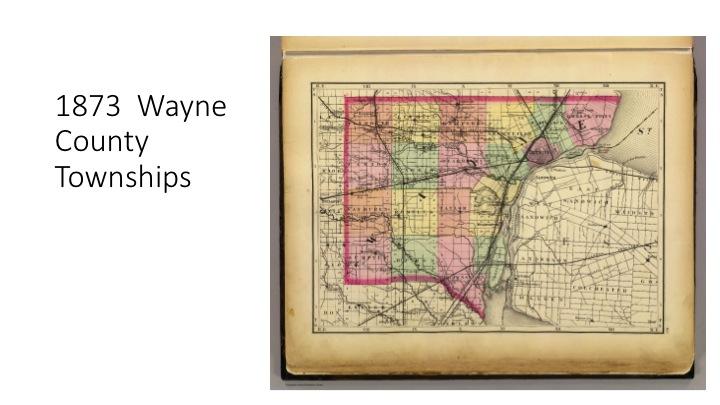
Land was taken from Greenfield, Hamtramck, and Springwells townships. Look below to see a map of Wayne County Township divisions from 1873.
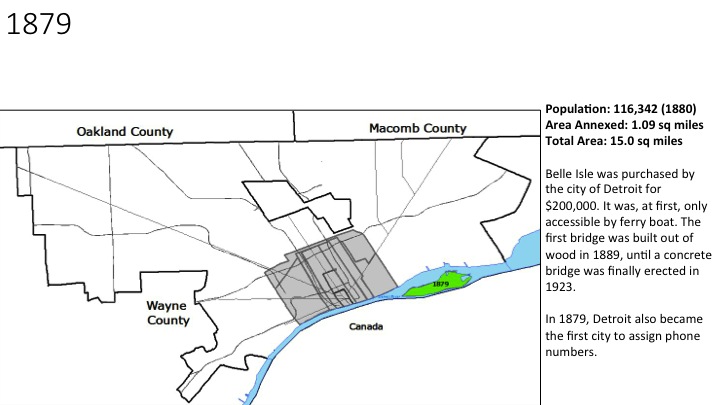
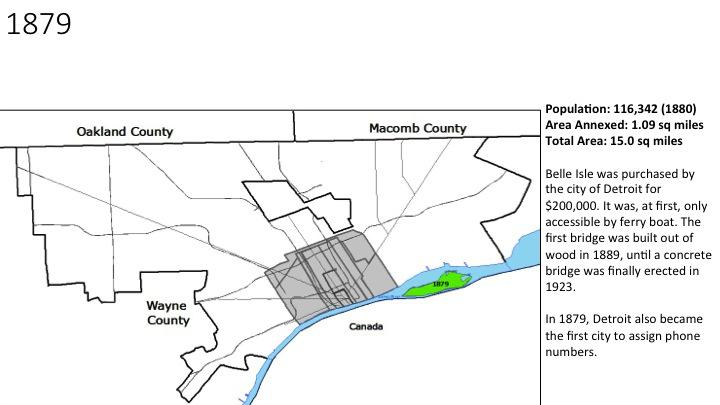
1879
Belle Isle was purchased by the city of Detroit for 0,000. It was, at first, only accessible by ferry boat. The first bridge was built out of wood in 1889, until a concrete bridge was finally erected in 1923.
In 1879, Detroit also became the first city to assign phone numbers.
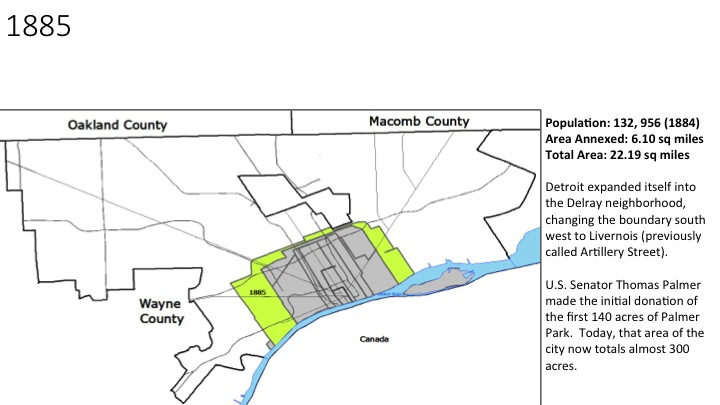
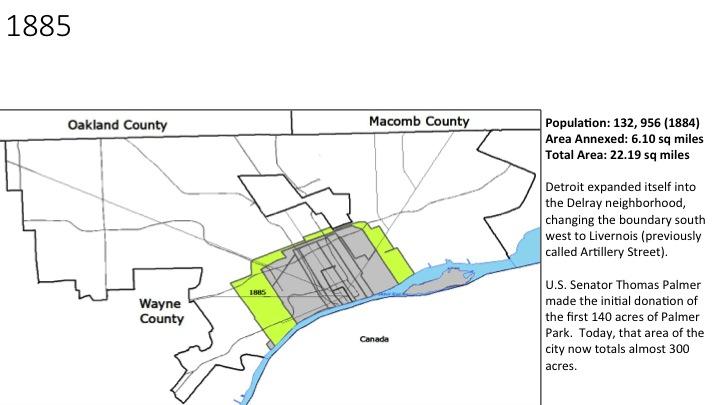
1885
Detroit expanded itself into the Delray neighborhood, changing the boundary south west to Livernois (previously called Artillery Street).
U.S. Senator Thomas Palmer made the initial donation of the first 140 acres of Palmer Park. Today, that area of the city now totals almost 300 acres.
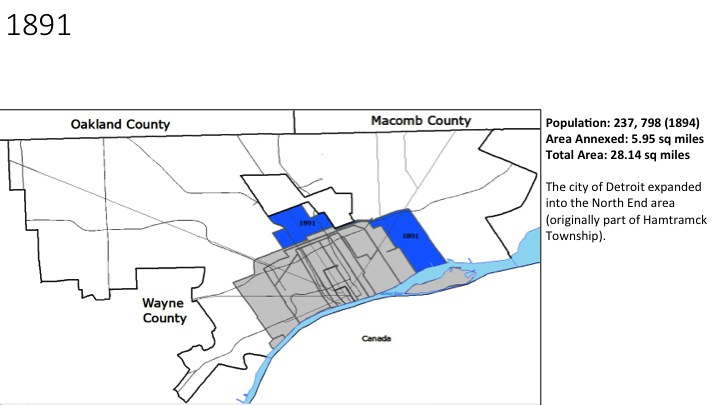
1891
The city of Detroit expanded into the North End area (originally part of Hamtramck Township).
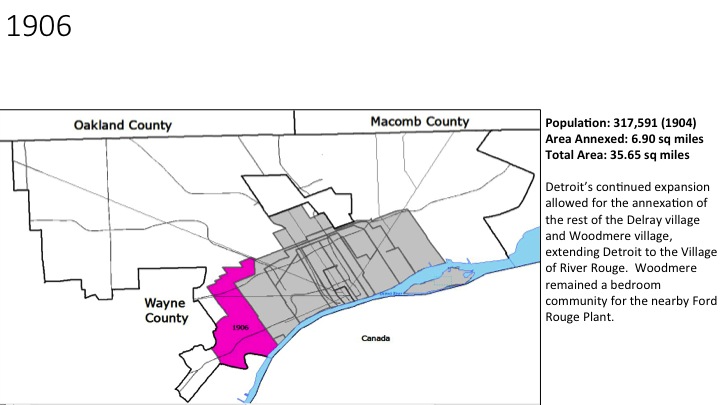
1906
Detroit’s continued expansion allowed for the annexation of the rest of the Delray village and Woodmere village, extending Detroit to the Village of River Rouge. Woodmere remained a bedroom community for the nearby Ford Rouge Plant.

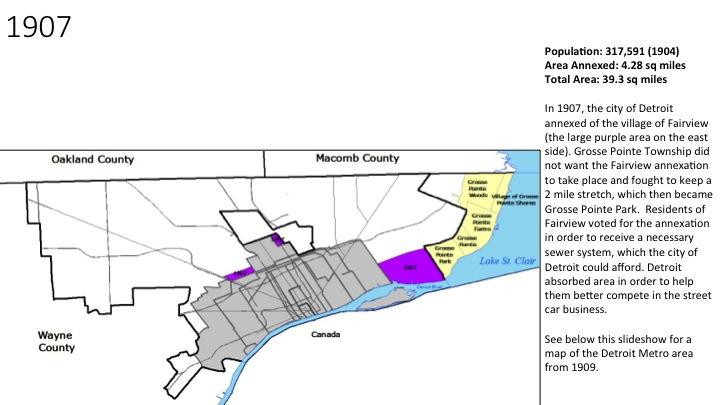
1907
In 1907, the city of Detroit annexed of the village of Fairview (the large purple area on the east side). Grosse Pointe Township did not want the Fairview annexation to take place and fought to keep a 2 mile stretch, which then became Grosse Pointe Park. Residents of Fairview voted for the annexation in order to receive a necessary sewer system, which the city of Detroit could afford. Detroit absorbed area in order to help them better compete in the street car business.
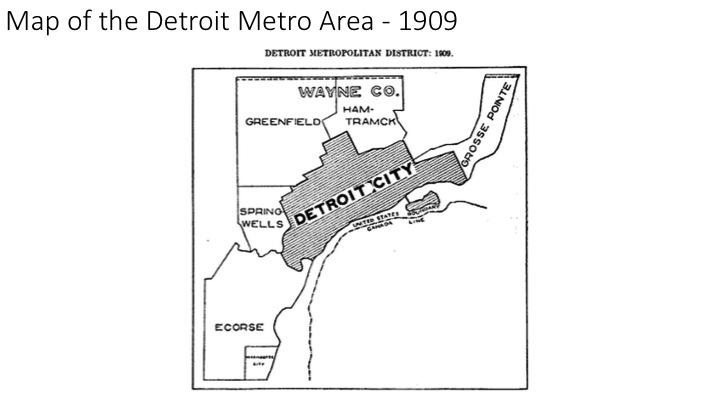
See below this slideshow for a map of the Detroit Metro area from 1909.
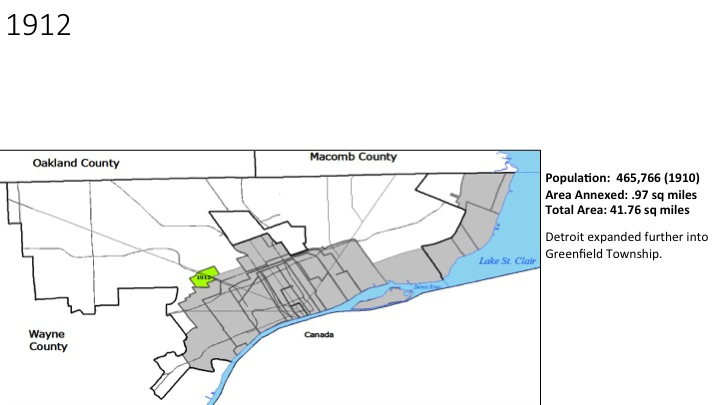
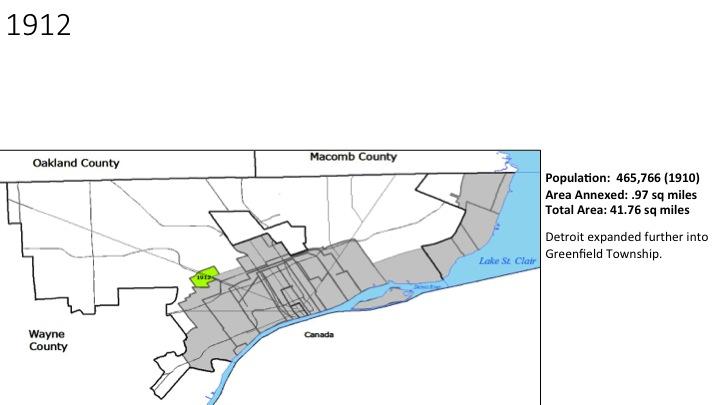
1912
Detroit expanded further into Greenfield Township.
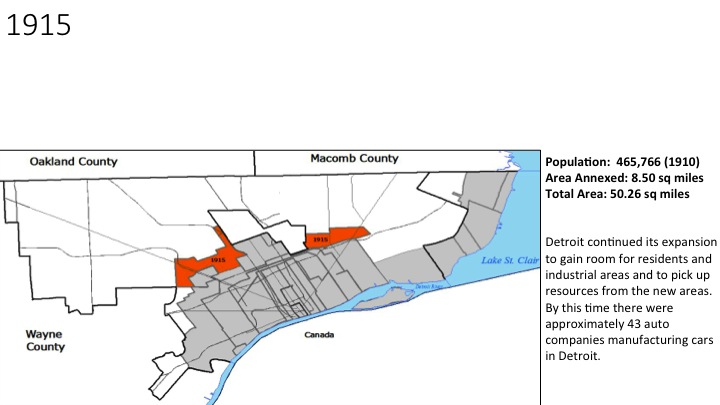
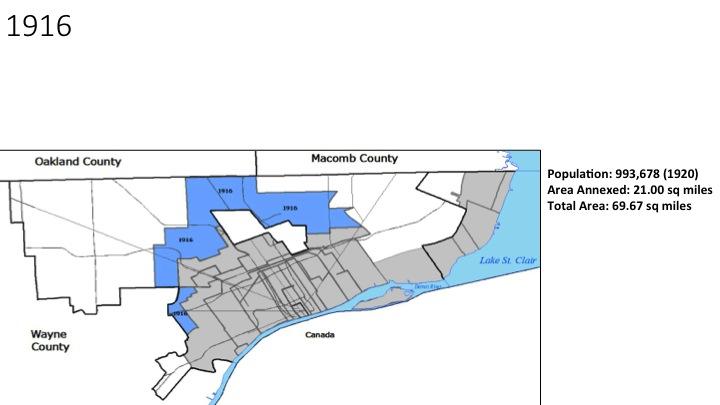
1915
Detroit continued its expansion to gain room for residents and industrial areas and to pick up resources from the new areas. By this time there were approximately 43 auto companies manufacturing cars in Detroit.
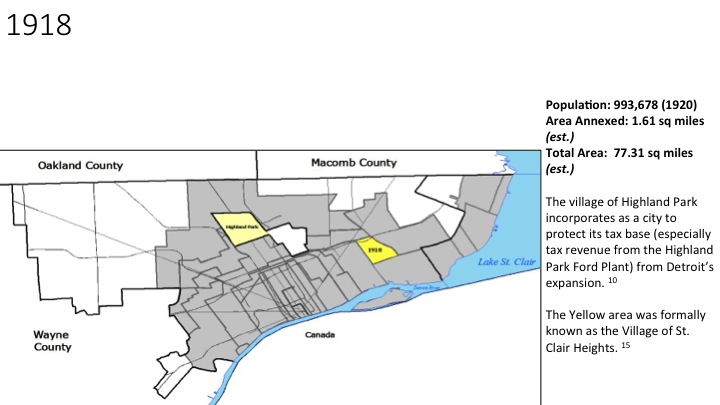
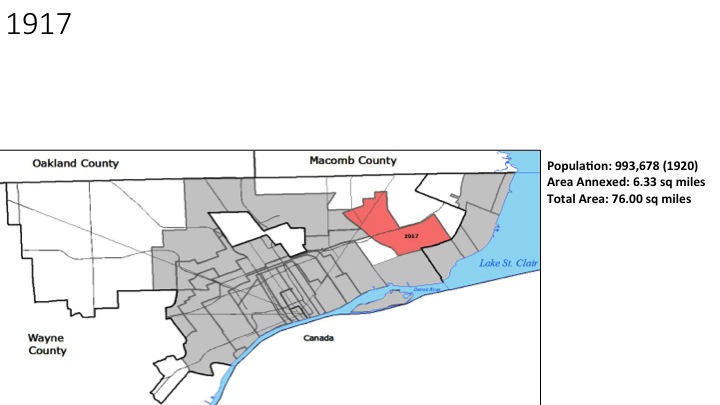
1918
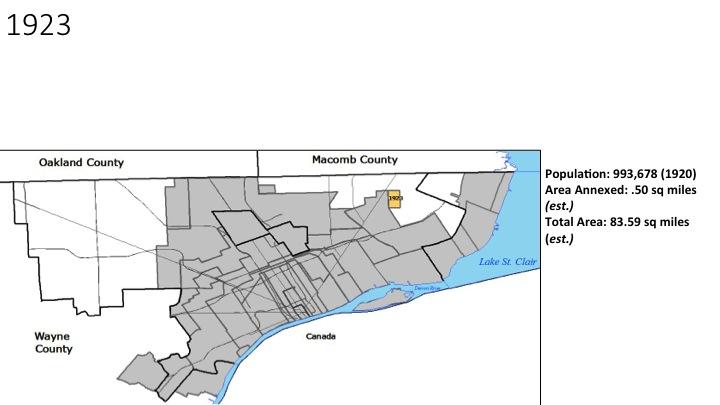
The village of Highland Park incorporated as a city to protect its tax base (especially tax revenue from the Highland Park Ford Plant) from Detroit’s expansion.
The Yellow area was formally known as the village of St. Clair Heights.

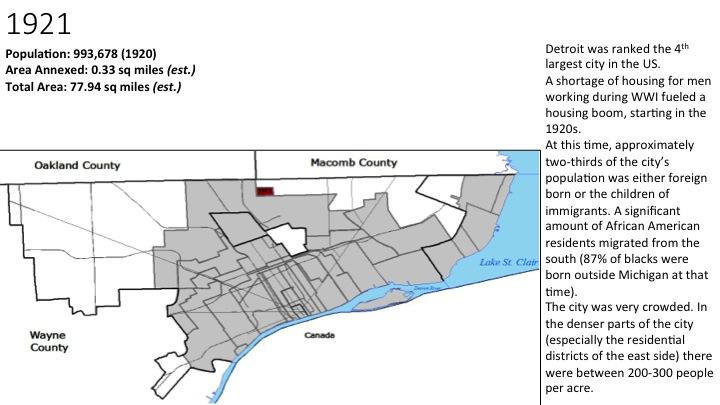
1921
Detroit was ranked the 4th largest city in the US.
A shortage of housing for men working during WWI fueled a housing boom, starting in the 1920s.
At this time, approximately two-thirds of the city’s population was either foreign born or the children of immigrants. A significant amount of African American residents migrated from the south (87% of blacks were born outside Michigan at that time).
The city was very crowded. In the denser parts of the city (especially the residential districts of the east side) there were between 200-300 people per acre.
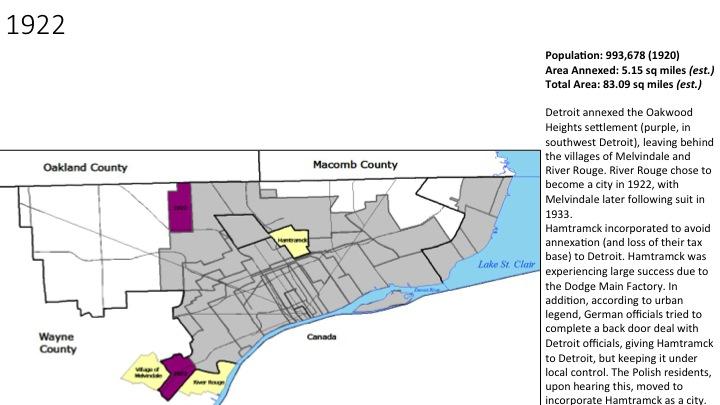
1922
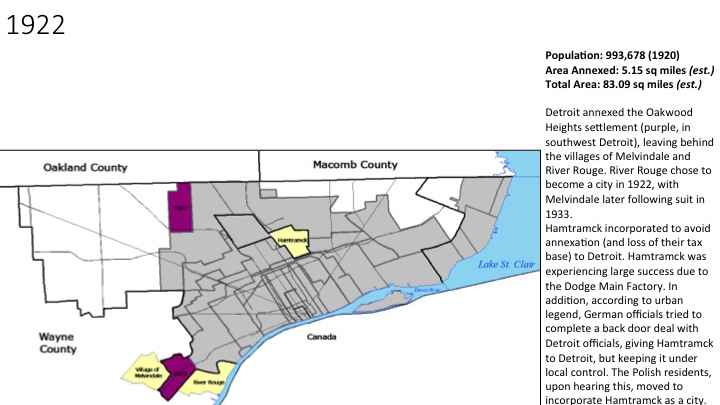
Population: 993,678 (1920)
Area Annexed: 5.15 sq miles (est.)
Total Area: 83.09 sq miles (est.)
Detroit annexed the Oakwood Heights settlement (purple, in southwest Detroit), leaving behind the villages of Melvindale and River Rouge. River Rouge chose to become a city in 1922, with Melvindale later following suit in 1933.
Hamtramck incorporated to avoid annexation (and loss of their tax base) to Detroit. Hamtramck was experiencing large success due to the Dodge Main Factory. In addition, according to urban legend, German officials tried to complete a back door deal with Detroit officials, giving Hamtramck to Detroit, but keeping it under local control. The Polish residents, upon hearing this, moved to incorporate Hamtramck as a city.

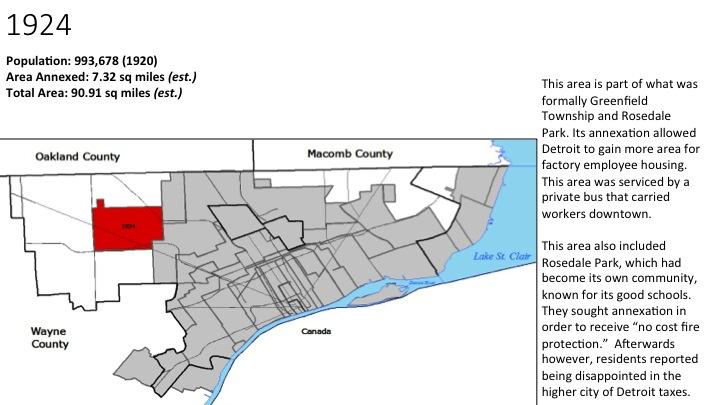
1924
This area is part of what was formally Greenfield Township and Rosedale Park. Its annexation allowed Detroit to gain more area for factory employee housing. This area was serviced by a private bus that carried workers downtown.
This area also included Rosedale Park, which had become its own community, known for its good schools. They sought annexation in order to receive “no cost fire protection.” Afterwards however, residents reported being disappointed in the higher city of Detroit taxes.

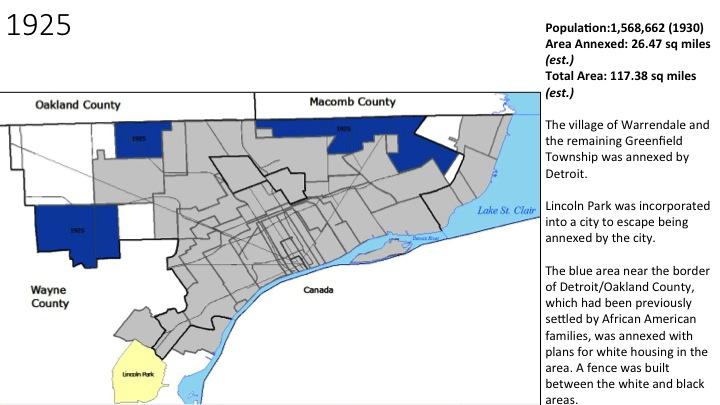
1925
The village of Warrendale and the remaining Greenfield Township was annexed by Detroit.
Lincoln Park was incorporated into a city to escape being annexed by the city.
The blue area near the border of Detroit/Oakland County, which had been previously settled by African American families, was annexed with plans for white housing in the area. A fence was built between the white and black areas.

1929
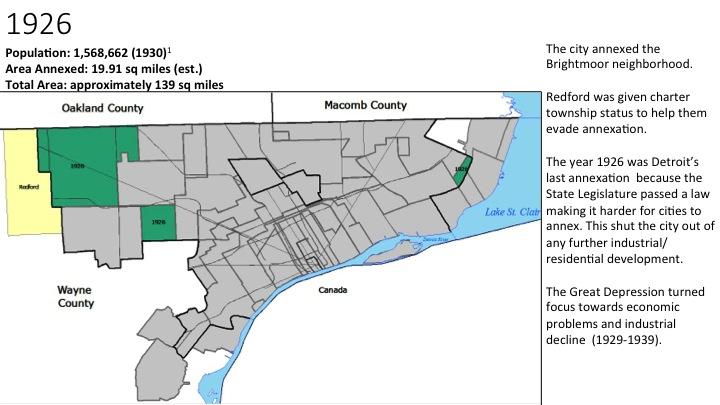
The city annexed the Brightmoor neighborhood.
Redford was given charter township status to help them evade annexation.
The year 1926 was Detroit’s last annexation because the State Legislature passed a law making it harder for cities to annex. This shut the city out of any further industrial/residential development.
The Great Depression turned focus towards economic problems and industrial decline (1929-1939).
Detroit Annexation Images


WORKS CITED
1.When Detroit Was Young by Clarence M. Burton
2.Weber, P (2013). The rise and fall of Detroit: A timeline. The Week. Retrieved from: http://theweek.com/articles/461968/rise-fall-detroit-timeline
3.The Detroit Historical Society. (2015). A Timeline of Detroit. Retrieved from: http://detroithistorical.org/learn/timeline-detroit/early-american-detroit-1787-182
4.Kowalski, G. (2002). Hamtramck: The Driven City. Arcadia Publishing. Chicago, IL.
5.Historic Fort Wayne Coalition. (2011). Historic Fort Wayne’s History. Retrieved from: http://www.historicfortwaynecoalition.com/fortabout.html
6. Burton, C., Stocking, W., Miller, G ((YYYY). The City of Detroit, Michigan, 1701-1922
7.Checklist of Printed Maps of the Middle West to 1900, 5-2112; Karpinski, 478; Phillips, 1960; Phillips Maps of America, p. 427; Miles, Michigan atlases and plat books, 2; LeGear, Atlases of the United States, L1754
8.The Detroit Historical Society. (2015). A Timeline of Detroit. Retrieved from: http://detroithistorical.org/learn/timeline-detroit/early-american-detroit-1787-1820
9.Belle Isle Conservancy. (2015). History of The Park. Retrieved from: http://belleisleconservancy.org/learn-more/history-of-the-park/
10.http://www.gphistorical.org/timeline.html
11.http://www.modeldmedia.com/features/fairview17008.aspx
12.Sauer, E.A., Perry, C.M. (1917). Perry’s Guide of Detroit and Suburbs: A Complete Reference to the Location of Streets, Steam, and Electric Car lines, Corner House Numbers, Etc. and the Latest Information about the City, It’s Manufactories, Churches, Schools, Parks and Public Buildings. Sauer and Perry: Unknown.
13.https://books.google.com/books?id=yTQdAQAAIAAJ&pg=PA43&lpg=PA43&dq=village+of+st.+clair+heights+detroit+annexation+1918&source=bl&ots=I3LnEWPRbV&sig=srY9tNUN2HxI26GUXCoXo9zmv-M&hl=en&sa=X&ei=7PFAVYzlDIixsAXyjIHgDw&ved=0CC0Q6AEwAw#v=onepage&q=village%20of%20st.%20clair%20heights%20detroit%20annexation%201918&f=false
14.Farley, R., Sheldon, D., Holzer, H. (2000). Detroit Divided. Russell Sage Foundation: New York, NY.
15.Kowalski, G. (2002). Hamtramck: The Driven City. Arcadia Publishing. Chicago, IL.
16.Oliver, Z, (1982). The Changing Face of Inequality: Urbanization, Industial Development and Immigrants in Detroit, 1880-1920. University of Chicago Press. Chicago, IL
17.http://www.detroittransithistory.info/Routes/Tireman-JoyHistory.html
18.Crabgrass Frontier: The Suburbanization of the United States Paperback – April 16, 1987 by Kenneth T. Jackson; http://detroit1701.org/Carver%20Elementary%20School.html
19.Map of the surveyed part of the territory of Michigan.(1825). Made by Orange Risdon. Engraved in Albany, New York by Rawdon, Clark & Co, and published by Orange Risdon. Taken from https://www.lib.msu.edu/branches/map/michigan/#OtherLocalMaps
20.Checklist of Printed Maps of the Middle West to 1900, 5-2112; Karpinski, 478; Phillips, 1960; Phillips Maps of America, p. 427; Miles, Michigan atlases and plat books, 2; LeGear, Atlases of the United States, L1754
21.Bureau of the Census. (1910). Thirteenth Census of the United States Taken in the Year 1910: Manufacturers, 1909, General Report.
22.Board of County Auditors, Detroit Michigan (1926). Manual: County of Wayne- Michigan: 1926. DetroitMichigan. Retrieved from: https://archive.org/details/manualcountyofwa00wayn on May 26, 2015.