Monroe Most Obese County in Southeastern Michigan

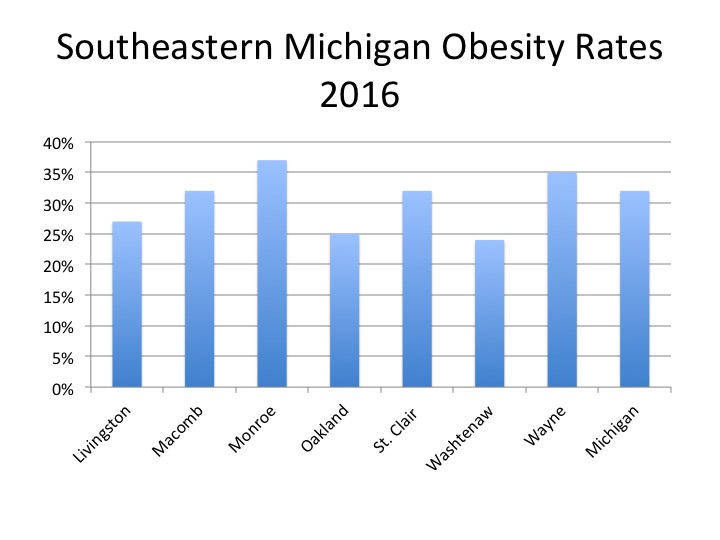
The obesity rate in Michigan was at 32.3 percent in 2018, which is the most recent data from the United Health Foundation, which produces an annual federal health survey. This rate, according to the foundation, has been stable for the last several years but Michigan ranks as the 16th most obese state in the nation. At the county level, the most recent obesity data that is available is from 2015, and that data shows that of the seven counties in the region four of them are at or above the state’s obesity rate. Monroe County had the highest obesity rate regionally at 37 percent, followed by Wayne County at 34 percent. Macomb and St. Clair counties both had obesity rates of 32 percent. Washtenaw County had the lowest obesity rate at 24 percent.

Obesity can be linked to several factors, including overeating, medications, certain diseases and lack of physical inactivity. Those who are obese are also more likely to have certain diseases, including diabetes, heart disease and stroke. Of course obesity is not the only factor contributing to these diseases. Below we explore the percentage of people who are physically inactive in Southeastern Michigan and the mortality rates of diseases linked to obesity.

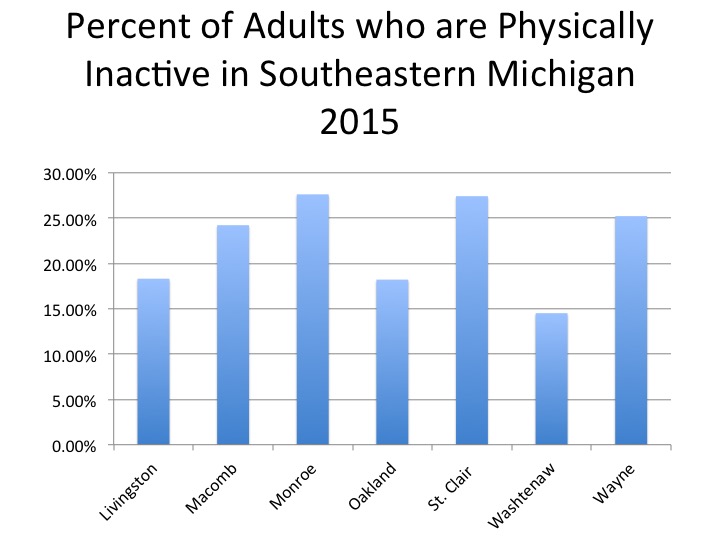
Physical inactivity is one of the contributing factors  to obesity. Presented below is the percentage of residents in each county in Southeastern Michigan who said they do less than 30 minutes of physical activity at least three times a week in 2015. As is shown in the chart below, Monroe County had the highest percentage of physically inactive residents at 27.6 percent; Monroe County also had the highest obesity rate. St. Clair County had the second highest rate of physically inactive residents at 27.4 percent. Washtenaw County had the lowest percentage of residents who are physically inactive at 14.5 percent. Washtenaw County also had the lowest obesity rate.

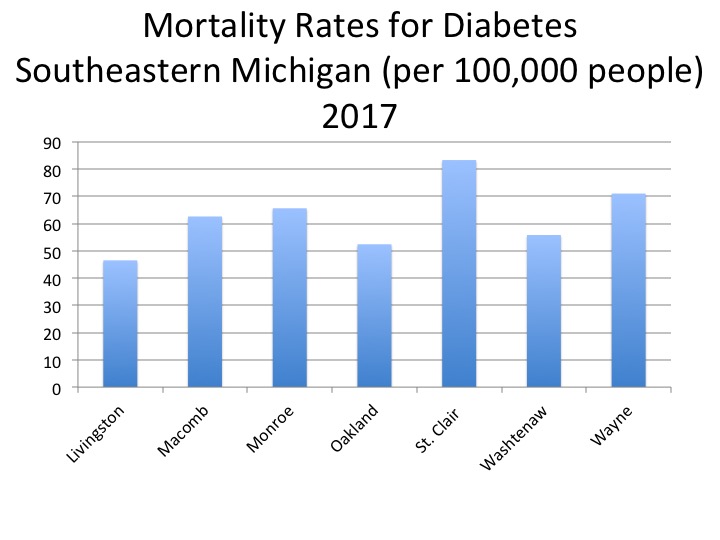
With obesity comes several health risks, including coronary heart disease, stroke, type 2 diabetes, mental illnesses (depression, anxiety) and an overall low quality of life. The three charts below show the mortality rates per 100,000 people for diabetes, heart disease and stroke. Of course the mortality rates displayed below are not directly produced by obesity. However, note that the counties with higher obesity rates tend to have higher mortality rates for the diseases discussed.

For mortality rates linked to diabetes, St. Clair County had the highest rate at 83.3 deaths per 100,000 people, followed by Wayne County at 71 deaths per 100,000 people and then Monroe County at 65.6 diabetes related deaths per 100,000 people. Livingston County had the lowest rate at 45.6 diabetes related deaths per 100,000 people.

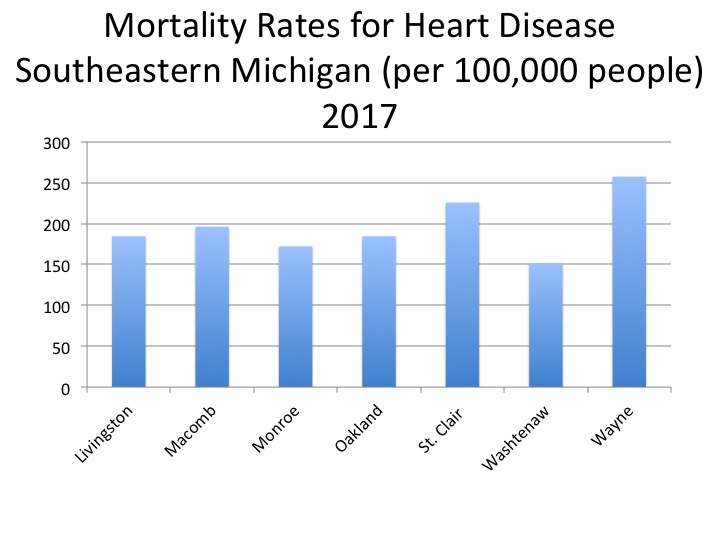
Overall, heart disease has a much higher mortality rate than diabetes, and the county with the highest heart disease related mortality rate in 2017 was Wayne County at 257.4 per 100,000 people. Following Wayne County was St. Clair County with a rate at 225.7 deaths per 100,000 people and Macomb County with a heart disease mortality rate of 196.1 deaths per 100,000 people. Washtenaw County had the lowest rate at 151.7 deaths per 100,000 people.

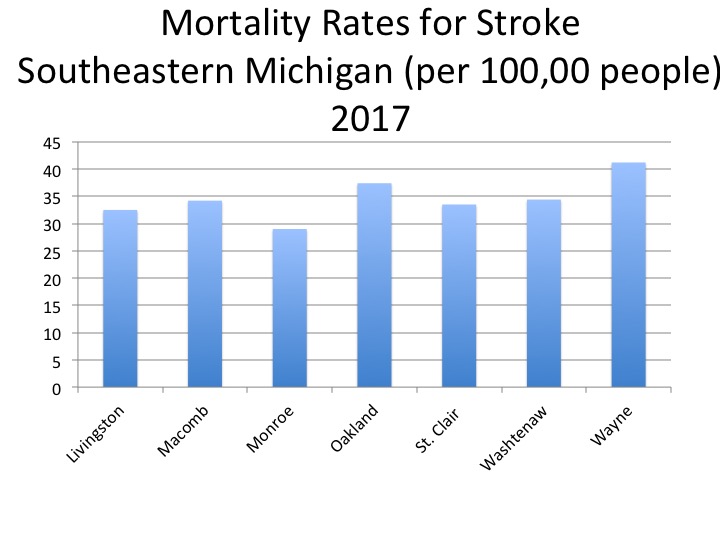
Strokes had the lowest mortality rate of the three diseases discussed here. Wayne County had the highest rate at 41.2 deaths per 100,000. Oakland County had the second highest mortality rate from strokes at 37.4 deaths per 100,000, and Washtenaw County had the third highest rate at 34.4 deaths per 100,000 people. Monroe County had the lowest rate at 29 deaths per 100,000 people.

Overall, this post highlights obesity rates in Southeastern Michigan, along with one of the causes of obesity and diseases linked to it. Ways to prevent obesity include:

  1. Being physically active;

2. Being cognizant of both caloric intake and the type of foods making up your diet;

3. Being aware of how your emotional state affects your eating habits and how to ensure that these habits do not become unhealthy.

DIA Seeks Millage Renewal

Throughout the Metro-Detroit region there are multiple millages being levied to support regional entities, most of which were born out of Detroit’s bankruptcy and the economic downturn. When some of these millages were originally levied, the initial intentions expressed to the public were that they were for only a specific amount of time, such as with the Detroit Institute of Authority (DIA). However, the Detroit Zoo for example passed a 0.1 millage in 2008, and then came back to voters in 2016, two years before the 10 year millage was set to expire, and asked for a renewal. The 0.1 millage renewal passed, and this public support for the Detroit Zoo continues to be levied; the cost of the Zoo millage for a home valued at $100,000 ($50,000 taxable value), is $5. We have also seen the Suburban Mobility Authority for Regional Transportation (SMART) continuously seek millage renewals and increases, the most recent being a 1 mill renewal for four years that was approved by voters in 2018.

Now, as the end of 2019 nears, the Detroit Institute of Arts (DIA) recently announced it is up against the clock to put millage renewal language on the March 2020 ballot. The 10-year millage was originally approved by voters in Macomb, Oakland and Wayne counties in 2012, and it was stated at that time that it was a one time request, allowing the museum time to build up its endowment for long-term financial support of operations, according to news articles of 2012 and present. Now seven years into the one-time millage, DIA officials have announced a 10-year renewal is necessary to continue offering the services the public has come to expect. In order to do this the three Art Authorities in Macomb, Oakland and Wayne counties (which were born out of articles of incorporation crafted and approved by the corresponding Board of Commissioners) must approve the ballot language. Just last week the Wayne County Art Authority approved putting the 0.2 mill renewal on the ballot, Oakland County is expected to debate the potential millage renewal later this month and the Macomb Art Authority will do so on Dec. 3.

As discussions again begin to ramp up over whether another regional millage renewal is necessary, it is important to consider what benefits the current tax dollars levied for the DIA may have created the region. In addition to free general admission for Macomb, Oakland and Wayne residents additional benefits can be covered under three main areas: investment in schools (free field trips with bussing, teacher professional development, and curriculum development), investment in the senior population (free group visits for older adults on Thursdays with free transportation and special programs), and investment in community partnerships (Inside/Out program, partnerships with area non-profits).

The first chart below shows the amount of money invested into the schools in the region by county and by year. In total, between 2013 and 2018 392,231 students in the tri-county region have had access to the school programs now offered by the DIA, with that investment totaling about $4.3 million. Of the three counties the most amount of money has been invested into the Wayne County schools, with that total being about $2.2 million. Wayne County has the highest population of the three counties.  It should also be noted though that investment into these various programs in the counties requires participation from the residents.

When looking at the amount invested in the senior programs since 2013 that total is about $1.7 million with the total number of seniors being reached by these special programs being 32,422. The largest investment with the senior programs since the millage has been in Oakland County with a total of  $725,362 being invested into the senior population.

Finally, the area where the most investment has been made is in the community partnerships area. Between 2013 and 2018 about $5.3 million was invested. The largest investment was in Oakland County at about $2 million. In Wayne County $1.9 million was invested, and in Macomb County about $1.3 million was invested.

It appears a new trend is emerging where millages will be needed to support regional entities and interests (the Zoo, the DIA, transit) along with day-to-day services in some cities and counties. For example, in Detroit there are currently discussions about a March ballot proposal to levy additional funds to move blight removal in the city along at a much faster pace. In Macomb County residents will asked to decide if they want to pay additional taxes in order to build a new jail. So it may be even more important for taxpayers to understand what additional taxes are appearing on their tax bill and what their priorities are. In the coming weeks we will look at the additional taxes residents pay in certain communities throughout the region to shed further light on what tax bills are now looking like.

Detroit Vacancies Decline Over Long-Term, Slow Uptick Recently in Numbers

New information on vacancies in Detroit provides a mixed picture. There were 1,490 fewer vacant Detroit properties of all kinds between September 2018 and September 2019, according to the U.S. Postal Service. However, between June 2019 and September 2019 the number of residential vacancies increased by 61 (discussed below). Overall in the month of September of 2019 there were 82,738 vacant addresses.

Although there was a decrease in the number of vacant addresses, the percentage of vacant addresses in Detroit has remained between 21 and 22 percent since June of 2011. Vacancy rates reached 20 percent in December of 2010. The peak vacancy rate in Detroit, according to U.S. Postal Service data, was in March of 2015 when it was 22.8 percent; at that time it was equivalent to 88,017 vacant addresses.

Looking backward, (we have USPS data back through 2005) the lowest vacancy rate in Detroit was in December of 2005. At that point, the rate was 10.03 percent, and that was equivalent to 38,981 vacant properties. So, overall we witnessed more than a doubling of vacancies with a gradual decline to 82,738 from a peak of 88,017.

When examining only residential vacancy rates that rate was 21.34 percent in September of 2019, which was equivalent to 74,818 vacant residential addresses. The residential vacancy rate between September of 2019 and 2018 decreased by less than 1 percent, and the total number decreased by 2,239 residential addresses. The five-year difference was a decrease of 7,230 residential vacancies. The highest residential vacancy rate was 23.5 percent in March of 2015; the lowest residential vacancy rate was in February of 2008 at 15.8 percent. Following the peak residential vacancy rate in 2015, those numbers have been on the decline.

In addition to these changes, in September of 2019 there was not a change in the number of “no stat” addresses–properties denoted by mail carriers as being either “vacant” or “no-stat.” In September of 2019 the percent of no-stat properties was 6.2 percent.  These no-stat properties are ones that carriers on urban routes mark as vacant once no resident has collected mail for 90 days. Addresses in rural areas that appear to be vacant for 90 days are labeled no-stat, as are addresses for properties that are still under construction. So, urban addresses labeled are those a carrier deems as unlikely to be occupied again any time soon. That is, both areas where property is changing to other uses and areas of severe decline may have no-stat addresses.

The maps below demonstrate both the overall Detroit address vacancy rates (including residential and business vacancy rates) by Census Tract for September 2019 (first map) and the change in vacancy rates between September 2019 and September 2018 (second map). In total, there were about 65 Census Tracts in Detroit with total vacancy rates above 35 percent. The Census Tract with the highest vacancy rate in September of 2019 was located north of I-94, between there and I-96, with a rate of 55.8 percent. There were two large clusters of Census Tracts with vacancy rates above 35 percent, one cluster was located along I-96 south and west of the Davison Freeway, and the other was located on the eastside of the city along Gratiot Avenue.

While most of the Census Tracts in the City experienced a decrease in the number of vacancies from September 2018 to September 2019, there were about 40 tracts scattered all across the city that had an increase. The Census Tract with the highest increase was located on the City’s far west side and there was an increase of 7.2 percent. The tract with the largest vacancy rate decrease was located in Southwest Detroit and there was a decrease of 11.1 percent.

In addition to the U.S. Postal Service tracking vacancy data so does the U.S. Census Bureau. The chart below shows the differences that each agency reports in vacancy rates. The Census Bureau only tracks vacant houses while the U.S. Postal Service tracks residential properties, businesses and total vacancy rates. In the chart below only residential rates are examined. As the data shows, the Census regularly has higher residential vacancy rates as compared to the U.S. Postal Service. The most recent data for the Census data (2017) shows that the City’s residential vacancy rate was 29.2 percent and that was in 2017. The Postal Service’s equivalent rate was 22.4 percent at that time. The Census data is based on a sample of about 72,000 housing units. The U.S. Postal Service data is collected by postal service workers, if a residence is deemed occupied it means it requires mail service.  It is deemed vacant if it does not require mail service. One potential reason for the difference in vacancy rates is the fact that the Census data is based on samples while the U.S. Postal Service relies on postal carrier’s actual observations of the properties. 

Problem Solving Courts Aim to Address Substance Use and Mental Health Illnesses

In Michigan there are specific courts known as “Problem Solving Courts” that are designed to address an offender’s problem. These courts often serve as an alternative to an individual serving time in jail or prison and, typically, focus on offenders with substance use and/or mental health illnesses. The different types of Problem Solving Courts are adult and juvenile drug courts, adult and juvenile mental health courts and veteran courts. These court programs are offered at the circuit court level and the district court level. In this post we will show what Problem Solving Courts exist in each county and where.

These Problem Solving Courts are additional dockets added on to a judges’ normal caseload, and running them at the district and circuit court levels does not cost locals more, beyond the need for secure internet, according to the State Court Administrator’s Office. It is through this office that additional support and training is offered. In addition to these programs providing resources for individuals to regain sobriety and a more stable life, these courts are also viewed as a cost saving measure to communities because they keep individuals out of jail. 

In total, in 2018, there were 128 drug/sobriety treatment courts in Michigan, and about 3,000 people were discharged from one of these programs. These courts do not all follow the same model, as some only accept offenders with driving under the influence charges, and others target offenders with drug related felonies. They all, though, adhere to specific guidelines to help offenders attain long-term sobriety.

Of that 128 drug/sobriety courts in the state, 31 of them were located in Southeastern Michigan, seven at the circuit court level and 24 at the district court level. Looking further into these drug courts, there are five just focused on offenders with driving under the influence charges, and two that are solely focused on juveniles. When looking at the location of the courts, Wayne County had the most drug treatment courts in 2018 at 11 followed by Oakland County with 10.  St. Clair and Monroe counties did not have any drug treatment courts.

According to the state, 65 percent of the participants throughout Michigan successfully graduated from a drug/sobriety court and 29 percent were unsuccessfully discharged due to non-compliance, absconding or a new offense.

Mental Health Courts are another type of Problem Solving Court offered in Michigan, and in 2018 there were 33 total mental health courts. In Southeastern Michigan there were 11 different mental health courts, one of which was for juveniles in Wayne County. There were four total mental health courts in Wayne County in 2018, two in Macomb County, and one each in the five other counties in the region.

According to the state, of the 1,414 participants in the mental court program 57 percent successfully completed the program. Additional data shows that unemployment for adult participants in circuit court mental health programs decreased by more than 50 percent, and unemployment decreased by more than 66 percent for participants at the district court level. Information from the state court system also showed that graduates were half as likely to commit another crime within three years of being admitted into a mental health court program.

Veteran Treatment Courts are another type of Problem Solving Court in Michigan, and in 2018 there were 25 across the state with 596 active participants. Of the active veterans involved in the program, 71 percent successfully completed their programs in 2018.  In Southeastern Michigan there were 14 Veteran Treatment Courts with five located in Wayne County, four in Oakland County, two in Macomb County and one each in Livingston, Monroe and Washtenaw counties.