Drug Death Rates Increase Across Southeastern Michigan

Macomb County had the highest rate of drug related deaths in 2014 coming in at 30.9 per 100,000 people, according to the Michigan Department of Health and Human Services. Wayne County’s overall rate was 27.4 per 100,000 people. If one looks at Wayne County, excluding the City of Detroit, then out-Wayne had the highest rate of drug related deaths in Southeastern Michigan at 31.3. Detroit’s rate was 21, about equal with Oakland County at 20.8. Regionally, Washtenaw County had the lowest rate of drug deaths in 2014 at 18.5 per 100,000 people.

drugdeaths2

slide3

Livingston County experienced the highest percent change in drug related deaths at 253 percent. In 2005 Livingston County’s rate was 7.8 and by 2014 that number increased to 27.5. Although Washtenaw County had the lowest rate of drug related deaths in 2014, like the other counties in the region, it experienced an increase in drug deaths since 2005. The increase in drug related deaths, regionally and across the state, is partially because of the increased use in opioids and heroin. Just this month the Detroit Free Press reported 19 people in Wayne County died from an elephant tranquillizer-carfentanil-that was mixed with the heroin or other street drugs.


While drug related deaths for the counties increased regionally, the City of Detroit experienced a 19 percent decrease. In 2014 the City’s drug related death per 100,000 people rate was 21, which was higher than both Oakland and Macomb counties. In 2005 the rate for the City was 26.


According to the Michigan Department of Health and Human Services the increase in drug poisoning deaths began in 2012. For heroin alone, the rate of related deaths increased from 2.3 per 100,000 people in 2012 to 4.5 in 2014. Statewide, it was individuals between the ages of 25-34 who had the highest death rate involving heroin. According to the Michigan Department of Health and Human services in 2014 11.4 per 100,000 individuals died from a drug poisoning involving heroin and 12 per 100,000 individuals in the 35-44 age bracket died from a drug poisoning involving opioids-which include heroin and pain killers.

Michigan’s Most Financially Struggling Cities Experience Largest Decreases in Revenue Sharing Funds

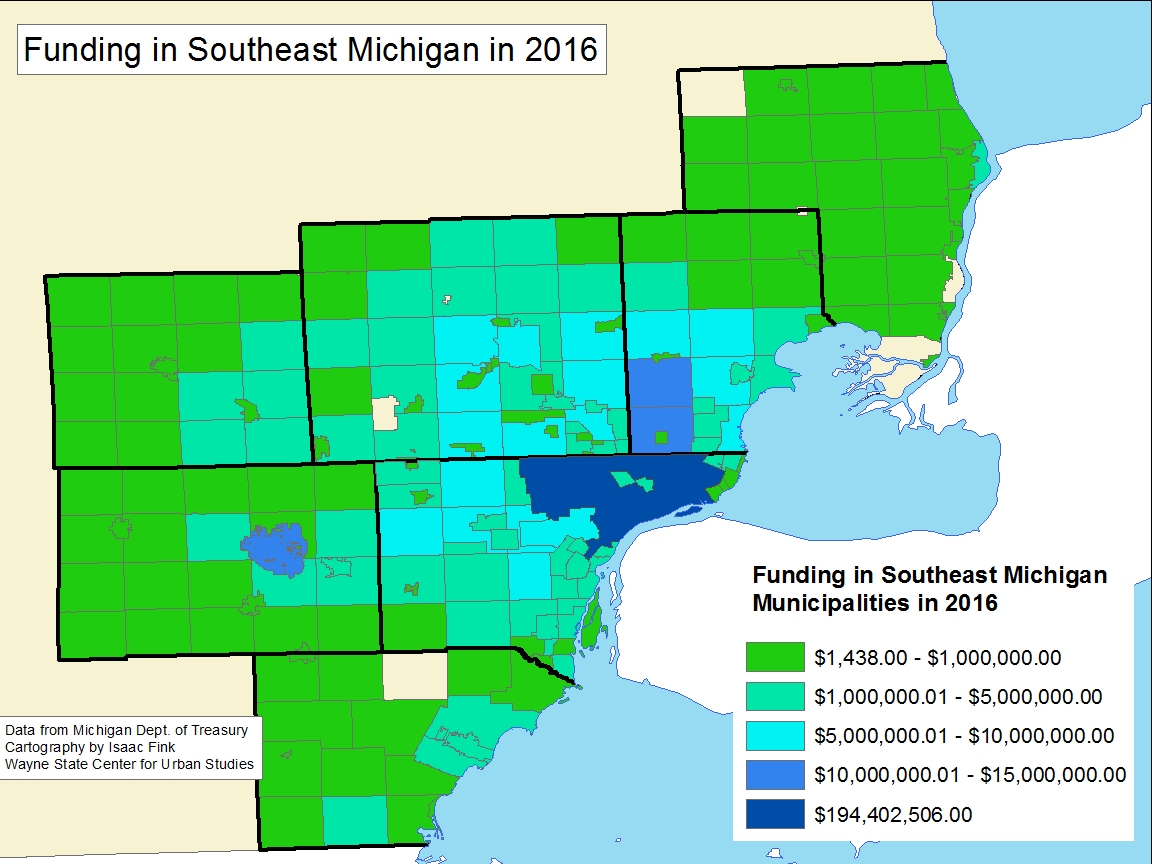
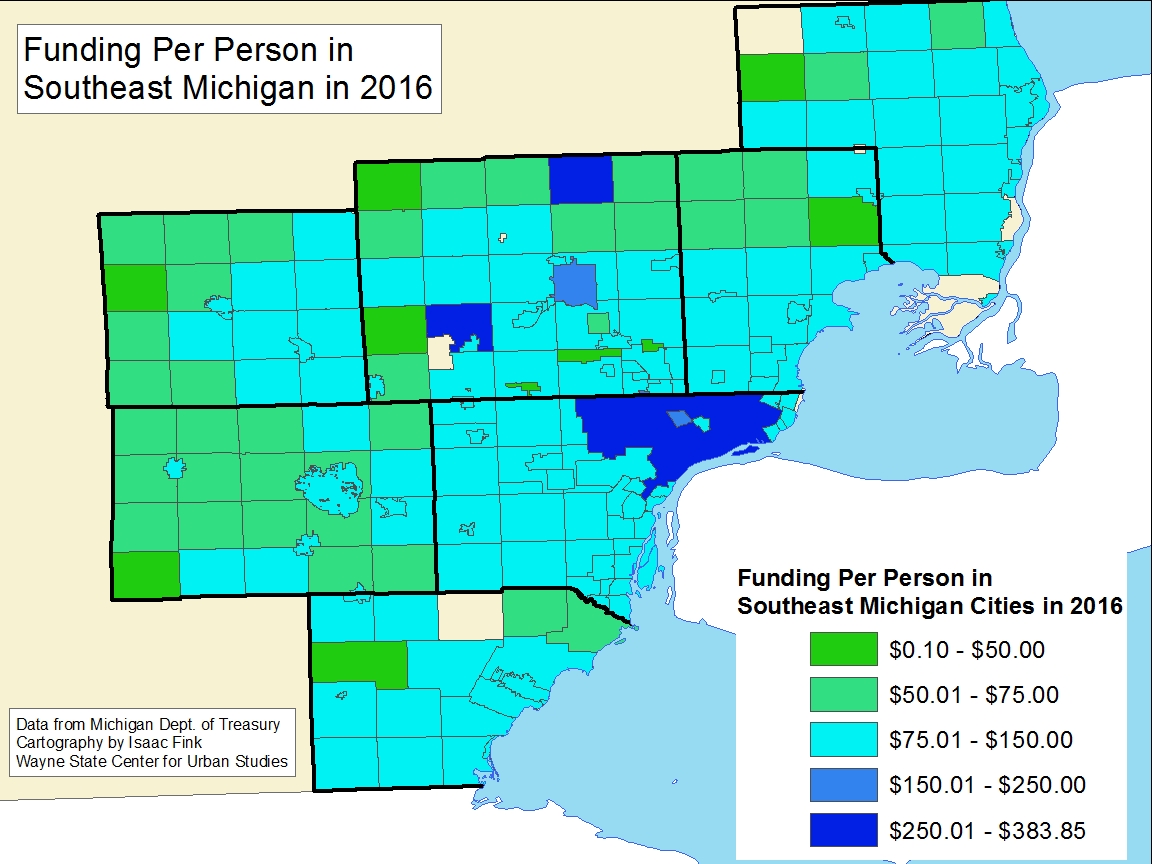
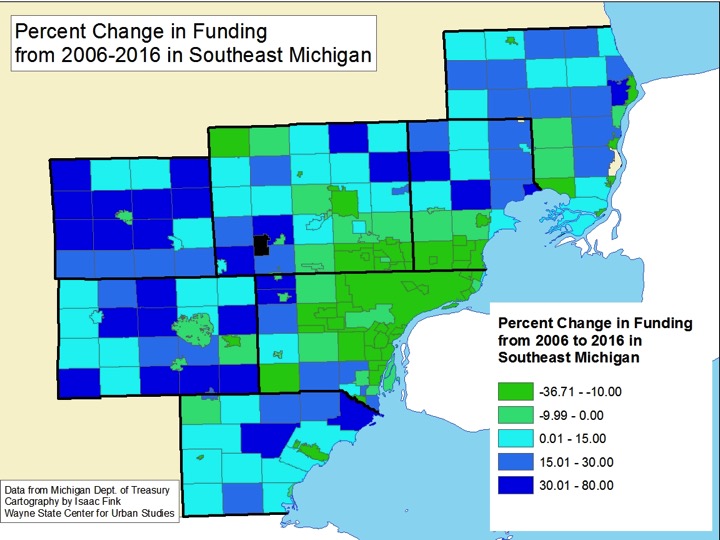
In comparing total Revenue Sharing Funds distributed throughout Southeastern Michigan between 2006 and 2016 we see that the city of Detroit, and those surrounding it, have suffered the most significant loss in Revenue Sharing Funds.

The City of Detroit experienced a 31 percent loss in total Revenue Sharing Funds between 2006 and 2016, without adjusting for inflation. This loss was the second largest in the region.

As discussed in our previous post, total Revenue Sharing in Michigan combines two payments, one for Constitutional Revenue Sharing and one for Statutory Revenue Sharing. The Constitutional Revenue Sharing formula is part of the State’s Constitution while Statutory Revenue Sharing formulas are subject to regular legislative modification.

slide1

In 2006 the City of Detroit received $281,074,148 in total Revenue Sharing Funds and in 2016 that number was $194,402,506, without adjusting for inflation. When adjusting for inflation at a rate of 19.5 percent the funds Detroit received in 2006 are equivalent to $335,883,607 in today’s dollars. This means there is a $141,481,101 difference between the amount of total Revenue Sharing Funds Distributed to Detroit in 2006 and 2016.

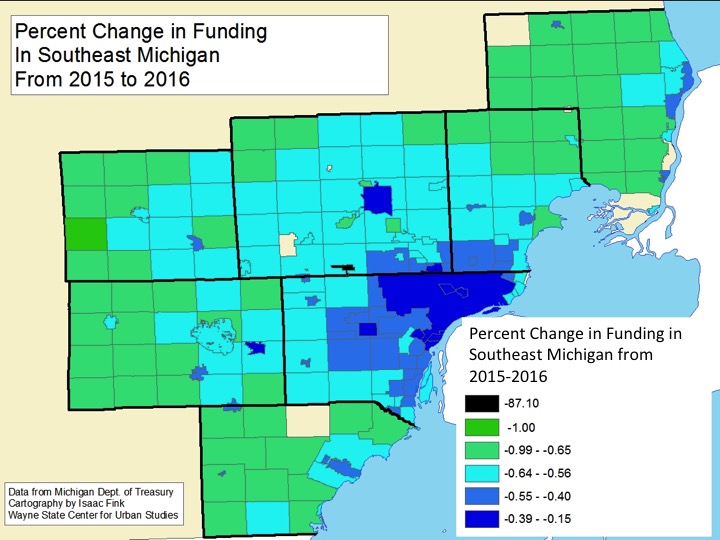
As noted, Detroit and the municipalities surrounding it experienced the largest decreases in Revenue Sharing Funds when comparing 2006 and 2016. In Livingston County we see that only two municipalities-Fowlerville and the City of Howell-experienced a decrease in the amount of funds distributed to them when comparing 2006 and 2016. Every other municipality in that County experienced an increase between 3 percent (City of Brighton) and 68 percent(Marion Township), without adjusting for inflation.

In Wayne County, the opposite was true when comparing the amount of funds distributed for 2006 and 2016; 81 percent of the municipalities in the region’s largest County experienced a decrease in the amount of Revenue Sharing Funds received. As noted, Detroit experienced one of the largest decreases, both in the county and in the region. It was Highland Park though that experienced the overall largest decrease in Wayne County, and the region, though. The funds Highland Park received in 2006 were 33 percent greater than what it received in 2016, without adjusting for inflation. When adjusting for inflation we see the decrease increase to about 39 percent. Other financially struggling communities, such as Ecorse an Inkster, also experienced a greater decrease in Revenue Sharing funds than many of their counterparts. Ecorse and Inkster both experienced a 25 percent decrease when comparing 2006 and 2016 funds, without adjusting for inflation. Also, it should be noted, Highland Park, Ecorse and Inkster were recipients of the FY 2016 $5 million Financially Distressed Cities, Villages and Townships Grant Program. Without being recipients of this grant the decrease in Revenue Sharing would have been greater for them.

Macomb Township is a notable community that has experienced Revenue Sharing Fund increases. Without adjusting for inflation this growing Macomb County township experienced a 77 percent increase when comparing 2006 and 2016 funds. In 2000 the township had a population of 50,478 and in 2010 that number was 79,580.

In order to better understand the shift in payment distribution below are the Constitutional and Statutory formulas for 2006 and 2016. Also presented is how we calculated in the inflation rate to best show how 2006 Revenue Sharing payments compare to those made in 2016.


Total Revenue Sharing Formula=Constitutional Payment + Statutory Payment


2006

Constitutional Revenue Sharing Example:

For the 2006 Constitutional Revenue Sharing the distribution rate was 68.6619. For a municipalities’ total annual Constitutional Revenue Sharing payment to be calculated, the total rate is multiplied by the 2000 population for each city, village and township. 

  • 2006 Statutory Revenue Sharing Payment=2000 population X 68.6619
  • 2006 Detroit Constitutional Revenue Sharing Payment of $65,176,004 = 949,231 X 68.6619

Statutory Revenue Sharing Example:

The Statutory Revenue Sharing Formula for 2006 is based on the previous year’s Statutory Revenue Sharing funds. For 2006, the formula states that a municipality will receive about 99 percent of the Statutory Revenue Sharing Funds it received in 2005.

  • 2006 Statutory Revenue Sharing Payment=2005 Statutory Revenue Sharing payment x 86467
  • 2006 Detroit Statutory Payment= $220,151,807 x .9886467=$217,652,357
  • Actual Statutory Funds Distributed in 2006: $215,898,144

***When using the formulas Detroit should have received $282,828,361 in total Revenue Sharing Funds in 2006, instead it received $281,074,148. According to the Michigan Department of Treasury, the amount of funds distributed is based on actual revenues received by the State and the State’s budget. This could, at least in part, explain the difference in funds received and funds expected.


2016

Constitutional Revenue Sharing Example:

For the 2016 Constitutional Revenue Sharing the distribution rate was 75.694800 For a municipalities’ total annual Constitutional Revenue Sharing payment to calculated, the total rate is multiplied by the 2010 population for each city, village and township.

  • 2016 Constitutional Revenue Sharing Payment= 2010 Population x 75.6984
  • 2016 Detroit Constitutional Revenue Sharing Payment of $53,939,054= 712,552 x 75.698400


Statutory Revenue Sharing Example:

The 2016 Statutory Revenue Sharing Formula is based off the amount of Statutory funds a municipality received in 2010, along with their compliance with Accountability measures. If these requirements were, met a municipality was eligible to receive up to 78.51044 percent of their 2010 total statutory payment, or a payment equal to the population multiplied by $2.64659-whichever was greater. The formula for 2010 statutory payments was the total amount a municipality received in FY 2009 multiplied by 88.94 percent, less the FY 2010 Constitutional amount, multiplied by the FY 2010 statutory payment percentage, according to the Michigan Department of Treasury.

  • 2016 Statutory Revenue Sharing Payment=2010 Statutory Revenue Sharing payment x .7851044 (max eligible percentage of 2010 Statutory Payment)
  • 2016 Detroit Statutory Payment= $178,910,540 x .7851044=$140,463,452


Inflation Adjustment

To better compare the 2006 Revenue Sharing Funds distributed versus the 2016 Revenue Sharing funds we applied the Consumer Price Index inflation rate of 19.5 percent.

2006 Constitutional Revenue Sharing Inflation Adjustment Example

  • Adjusting for inflation= 2000 population X [(68.6619 X .1950)+ 68.6619]
  • Adjusting for inflation= 949,231 X [(68.6619 X .195) + 68.6619 ]= $77,885,324

2006 Statutory Revenue Sharing Inflation Adjustment Example:

  • Adjusting for inflation=2005 Statutory Revenue Sharing payment x [(.9886467 x .195) + .988647]
  • Adjusting for inflation=$220,151,807x [(.9886467 x .195) + .988647] =$260,094,567


Overall, we see that some of Michigan’s most finically hit cities have experienced the greatest decline in state funding. While population does play an evident role in the amount of Revenue Sharing funds a community receives, we also know that Statutory Revenue Sharing Funds are diverted from the local municipalities to instead support the state budget. In addition, while at first glance distribution rates for the Constitutional Revenue Sharing may appear larger now than in the past, these rates do not account for inflation. For example, the 2006 Constitutional Distribution Rate of 66.6619 is equivalent to 82.0509 when adjust for inflation in 2016; this is about seven points higher than the actual 2016 Constitutional Distribution Rate. This further demonstrates how communities throughout Southeastern Michigan, and the state as a whole, have been experiencing a loss in Revenue Sharing Funds.

Southeastern Michigan Revenue Sharing Declines Between 2015 and 2016

Municipalities across Michigan have experienced a decline in Revenue Sharing funds in recent years as monies have been diverted toward the State’s General Fund. Between Fiscal Year 2015 and 2016 the municipalities in Southeastern Michigan experienced an average decline in revenue sharing of 0.59 percent. For Fiscal Year 2017 though, the state is expecting to increase revenue sharing monies by 1.2 percent in Southeastern Michigan, on average. The purpose of this post is to show how Revenue Sharing payments declined between 2015 and 2016 and how the capita disbursement varies between communities.

The funding map below refers to the total amount of Revenue Sharing each municipality received in 2016-this total combines both the Constitutional and Revenue Sharing Funds. For the Constitutional Revenue Sharing Payment there is a total distribution rate, which has declined over the last several years. For FY 2016 the rate was 75.694800 and in FY 2015 that rate was 76.1932l; in FY 2017 it is projected to be 76. 921299. For a municipalities’ total annual Constitutional Revenue Sharing payment to calculated, the total rate is multiplied by the 2010 population for each city, village and township, despite the fact some municipalities’ populations may have increased since then. The state determines the Constitutional Rate using 15 percent of the gross 4-percent sales-tax collections (the other 2 percent of Michigan’s gross sales-tax collections are designated for educational purposes). This means 15 percent of state sales tax revenue should be distributed to Michigan’s municipalities. Using Detroit as an example, the 2010 population was 712,552. This is multiplied by 75.698400, bringing the total Constitutional Revenue Sharing amount that Detroit was to be awarded in 2016 to $53,939,054. Detroit’s Constitutional Revenue Sharing payment for 2016 accounted for about 28 percent of the Revenue Sharing Funds it was awarded.

Example:

  • 2016 Constitutional Revenue Sharing Payment= 2010 Population x 75.6984
  • 2016 Detroit Constitutional Revenue Sharing Payment of $53,939,054= 712,552 x 75.698400

In addition to Constitutional Revenue Sharing, there is also Statutory Revenue Sharing, which for Fiscal Years 2015, 2016 and 2017 have been called CVT (City, Village and Township) Payments. For 2015 and 2016, according to the Michigan Department of Treasury, payments were based on whether or not a municipality met specific Accountability and Transparency requirements. If these requirements were, met a municipality was eligible to receive up to 78.51044 percent of their 2010 total statutory payment, or a payment equal to the population multiplied by $2.64659-whichever was greater. The formula for 2010 statutory payments was the total amount a municipality received in FY 2009 multiplied by 88.94 percent, less the FY 2010 Constitutional amount, multiplied by the FY 2010 statutory payment percentage, according to the Michigan Department of Treasury.

For the City of Detroit it was awarded $140,463,452 in Statutory Revenue Sharing in 2016. This number was calculated by multiplying its total 2010 Statutory Revenue Sharing payment of $178,910,540 by .7851044 (max eligible percentage of 2010 Statutory Payment). In total, Detroit’s Statutory Revenue Sharing Payment accounted for 72 percent of its total Revenue Sharing Payment.

Example:

  • 2016 Statutory Revenue Sharing Payment=2010 Statutory Revenue Sharing payment x .7851044 (max eligible percentage of 2010 Statutory Payment)
  • 2016 Detroit Statutory Payment= $178,910,540 x .7851044=$140,463,452

While Michigan’s Constitutional Revenue Sharing remains enshrined in the State’s Constitution, Statutory Revenue Sharing formulas are subject to regular legislative modification.  Constitutional Revenue Sharing rates can decrease when overall revenue declines, as it tends to during recessions, or when the population of a municipality declines. However, Constitutional Revenue Sharing payments are not subject to the changes Statutory Revenue Sharing payments experience. For example, just between 2014 and 2015 Statutory Revenue Sharing payments went from being called Economic Vitality Incentive Program Payments, where a municipality could receive up to 76.18459 percent of its 2010 Statutory Payment if it met three conditions (Accountability and Transparency, Consolidation of Services, and Employee Compensation) to City, Village and Township Revenue Sharing Payments. As noted above, the current Statutory Payment formula is based on whether or not a municipality met only Accountability and Transparency requirements. Also the percentage rate is 78.51044 percent of a communities’ 2010 total statutory payment. As noted above, there were no changes between the 2015 and 2016 Statutory Revenue Sharing formula.

As shown below, Revenue Sharing payments vary between municipalities, at least in part, due to the fact the Constitutional Revenue Sharing rates are based off of population numbers. Revenue Sharing payments for FY 2016 ranged between about $20,000 (Emmett Village in St. Clair County with a population of 323) to above $194 million (Detroit with a population of about 700,000). As the map shows, Detroit had the largest Revenue Sharing payment in the region, with Ann Arbor, Warren and Sterling Heights coming in behind Detroit for payment amounts. The more rural communities, with the lesser populations, also received lesser total Revenue Sharing payments.

funding-per-city_2016_jpeg

As noted, the average overall Revenue Sharing decline in Southeastern Michigan between 2015 and 2016 was .59 percent. While the map below shows the overall Revenue Sharing payment change between 2015 and 2016, the contributing factor was the decrease in the Constitutional Revenue Sharing rate between 2015 and 2016; the Statutory Revenue Sharing formula remained the same. Also, one of the more notable trends demonstrated in the second map, below, is that municipalities in the region currently, or previously, deemed financially unstable experienced less of a decline in Revenue Sharing than majority of the other municipalities in the region. This is due to FY 2016 $5 million Financially Distressed Cities, Villages and Townships Grant Program, which was created to help financially struggling municipalities move toward financial stability. As part of this program, the Michigan Legislature mandated that a single municipality should not receive more than $2 million. Cities such as Ecorse, Inkster and Highland Park were recipients of this grant, boosting the total amount of Revenue Sharing funds they were appropriated.

Inkster experienced a .38 percent decline, Ecorse experienced a .34 percent decline, and Highland Park experienced a .23 percent decline. Although Detroit was not a recipient of this grant, it experienced a .18 percent decline; the smallest in the region.

slide02

In 2016 the projected amount of Revenue Sharing Detroit was to receive was $194,402,506, as demonstrated in the first map above. This translates to $279.54 per person in the city, which is shown in the map below. That number was calculated by taking the projected 2016 Revenue Sharing dollars and dividing it by the most recent population numbers provided by the U.S. Census Bureau. The only other community in the region that received a higher per capita amount of Revenue Sharing dollars was Oxford Township in Oakland County ($383). In total, there were 27 municipalities throughout the region with a per capita Revenue Sharing amount above $100 per person.

funding-per-person_2016_jpeg-2

In the our next post, we will take a deeper look as to how Revenue Sharing payments have declined over time in Southeastern Michigan. We know that payments have declined over the last several years and will be able to see some of the hardest hit communities in Southeastern Michigan.

Business Vacancies and Employment Increase in Detroit

  • The unemployment rate across the state has remained stagnant while the rate in the city of Detroit has inched upward(monthly);
  • The number of employed Detroit residents increased, as did the City’s labor force (monthly);
  • The business vacancy rate in Detroit has experienced an overall increase since 2012;
  • The Purchasing Manager’s Index for Southeastern Michigan increased from May to June 2016 (monthly);
  • Commodity Price Index decreased for Southeastern Michigan (monthly);
  • Standard and Poor’s Case-Shiller Home Price Index for the Detroit Metropolitan Statistical Area shows home prices continue to gradually increase on a month-to-month basis and experience larger growth when compared on an annual basis.slide03

According to the most recent data provided by the Michigan Department of Technology, Management and Budget, the unemployment rate for the State of Michigan remained steady at 4.5 percent through August 2016. During this same period, unemployment in the City of Detroit increased to 11.5 after hitting an annual low of 9.1 in April.slide05

According to quarterly data provided the U.S. Postal Service, the June 2016 business vacancy rate in the City of Detroit was 25.7 percent, which was equivalent to 7,608 vacant businesses out of 29,648 total businesses. Of the data provided, the lowest business vacancy rate in the City of Detroit was in September of 2012. That rate was 23.3; there were 6,925 vacant addresses of the 29,696 addresses.

The business vacancy rate in the City has steadily grown over the last four years, except between March-December 2015 when it declined. In December of 2015 the rate dropped to a low of 24.3.

slide07

In July of 2016 the number of employed Detroit residents rose to 218,587, an increase of 1,054 from June. Between July of 2016 and July of 2015 there was a total increase of 8,117 employed Detroit residents, according to the Michigan Department of Technology, Management and Budget.

Along with the the number of employed Detroit residents increasing over the last year, so has the labor force. Between July of 2016 and July and 2015 the labor force increased by 37,556 to a total of 249,815.

slide09

The Purchasing Manger’s Index (PMI) is a composite index derived from five indicators of economic activity: new orders, production, employment, supplier deliveries, and inventories. A PMI above 50 indicates the economy is expanding.

According to the most recent data released on Southeast Michigan’s Manager’s Index, the PMI for August 2016 was 66, an increase of 8.5 points from the prior month. The August 2016 PMI was an increase of 9.4 from the previous year.  With this increase, the PMI for August is considered strong, especially due to the increase in new orders.

slide11

The August 2016 Commodity Price Index decreased 9.3 points from July but increased 5 points from the prior year. The July 2016 Commodity Price Index reached an annual high due to pricing pressures and stronger demands at that time. The August decrease represents decreased pressure and demand.

slide13

The above charts show the Standard and Poor’s Case-Shiller Home Price Index for the Detroit Metropolitan Statistical Area. The index includes the price for homes that have sold but does not include the price of new home construction, condos, or homes that have been remodeled.

According to the index, the average price of single-family dwellings sold in Metro Detroit was $107,900 in June 2016. This was an increase from $102,710 from June of 2015 and an increase from $97,340 from June of 2014.