Here we present some overall COVID-19 data for background, then present a series of economic indicators, which have largely been driven by COVID-19 since March. The global, national and local economy has been impacted by COVID-19 throughout 2020. In Michigan, the state began reporting cases in March and shortly following the first few hundred cases, unemployment numbers began to spike. Since then, there has been some economic stabilization but much uncertainty remains, both economically and for the overall health of our population.
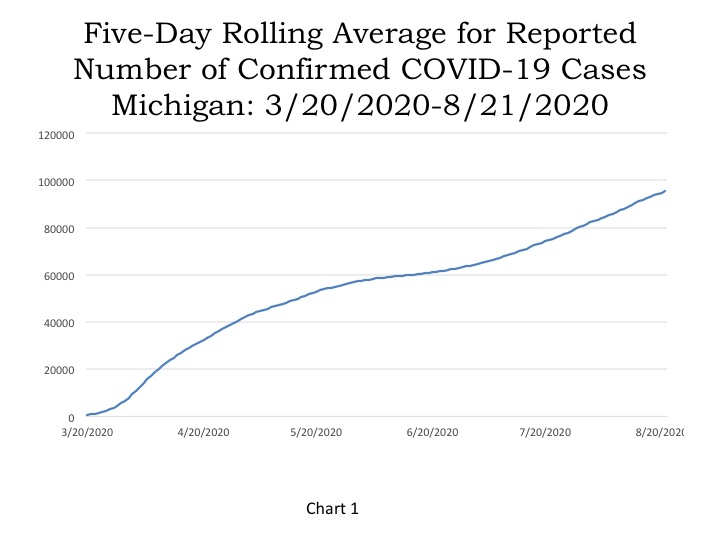
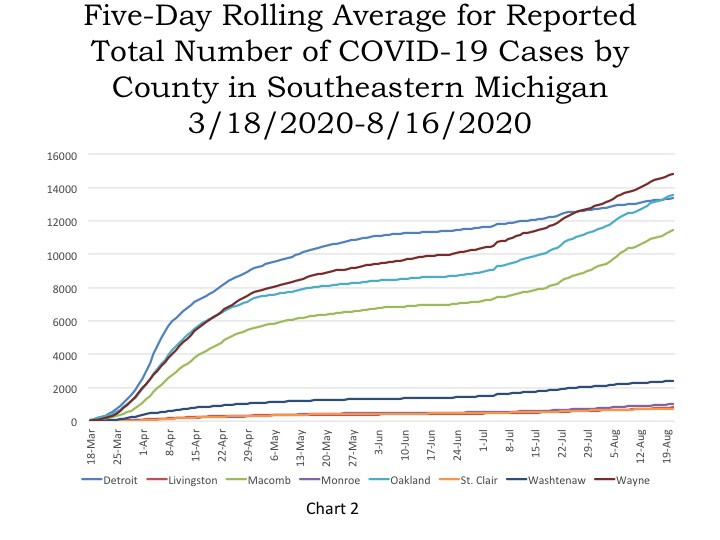
On Aug. 23 the State of Michigan reported a cumulative total of 96,792 COVID cases, an increase of 738 cases from the day prior. This is a substantial rise from Michigan’s low point of 180. When looking at the five-day rolling average for the number of cases, which provides a smoother, more accurate look, 95,372 cases were reported as of Aug. 21. In Wayne County (without Detroit numbers) 14,846 cases were reported-the most in the region. Oakland County reported the second highest numbers at 13,571 and Detroit reported 13,334 cases.
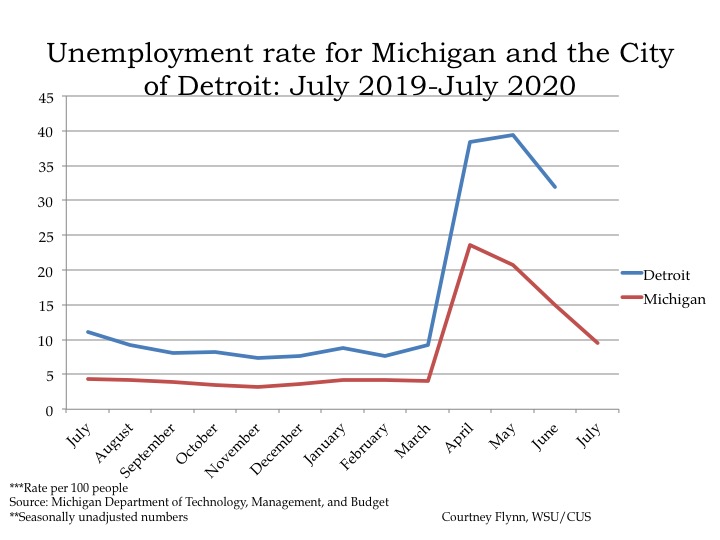
Unemployment numbers have mapped COVID-19 numbers—each rising and falling together. But unemployment remains far higher than this time last year. In July of 2020 the State of Michigan reported an unemployment rate of 9.5 percent, and in July of 2019 it was reported at 4.3 percent. For Michigan, the unemployment rate reached its highest in April of 2020 at 23.6 percent. The City of Detroit, which regularly posts higher unemployment rates than the State, continued to do so at much higher rates following the first reports of COVID. In May of 2020 Detroit reported a 39.4 percent unemployment rate, which then decreased to 31.9 percent in June (July data at the local level is not yet available from the State). While there was a decrease, these rates are still extraordinarily higher than the year prior.
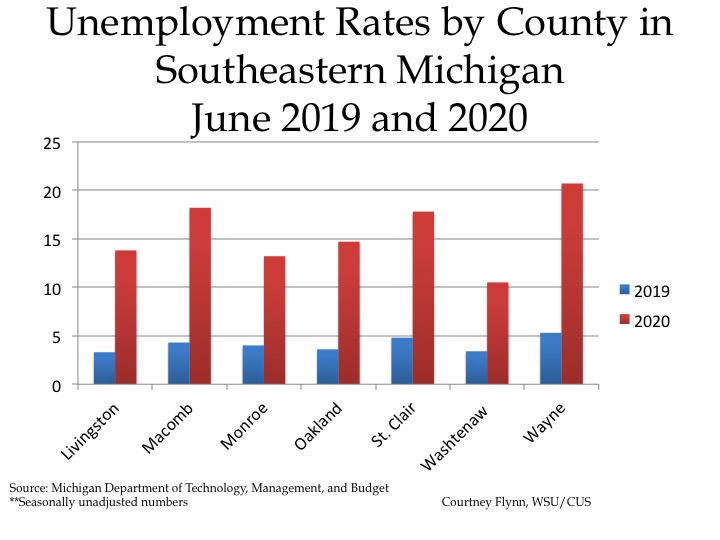
To break out these drastic changes in unemployment, we show how the rates changed for the counties in Southeastern Michigan from June of 2019 to June of 2020.
In June of 2019 Wayne County posted the highest unemployment rate at 5.3 percent and Livingston County posted the lowest at 3.3 percent. Fast forward to June of 2020 and the lowest unemployment rate reported in Southeastern Michigan was Washtenaw County at 10.5 percent; Wayne County reported the highest rate at 20.7 percent. Wayne County also has the highest number of COVID cases in the region, and throughout the state at the county level.
In March of 2020 many businesses were temporarily shuttered by Gov. Gretchen Whitmer’s orders to help protect the population. And, as COVID case numbers have become more manageable for the health care systems and better systems have been put in place to slow the spread of the virus, more businesses have been reopening. However, restrictions still apply in how businesses can operate and recommendations are still remain in place over whether people should be frequenting businesses for pleasure over necessity. All of these factors, along with individuals’ personal beliefs, have all certainly had an impact on the economy.
COVID is certain to have lasting impacts on our economy and we will continue to provide updates on this in terms of unemployment, the housing market and government funding.
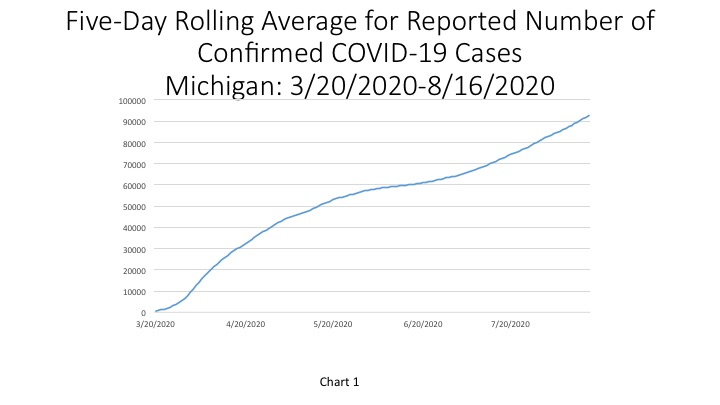
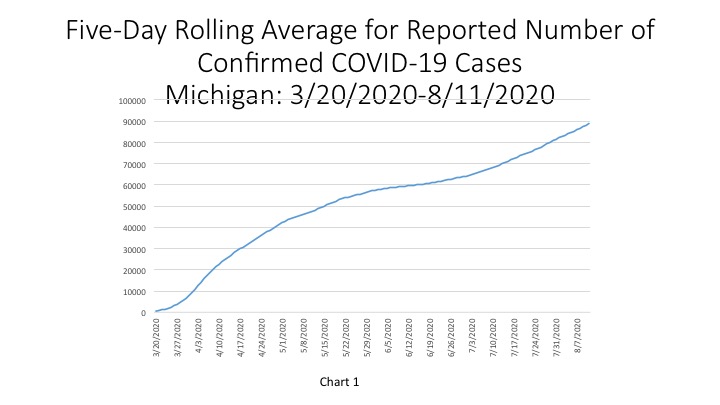
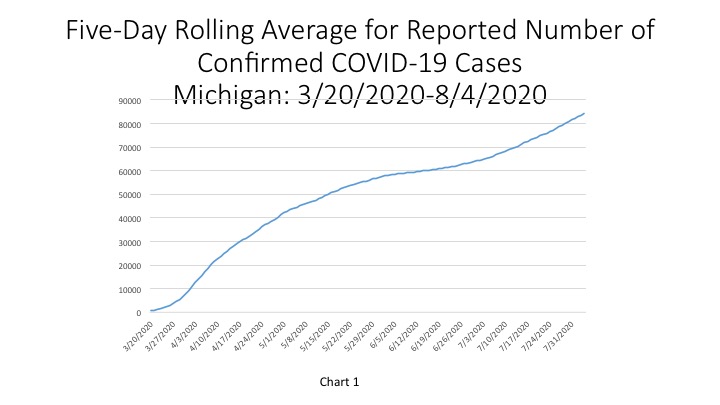
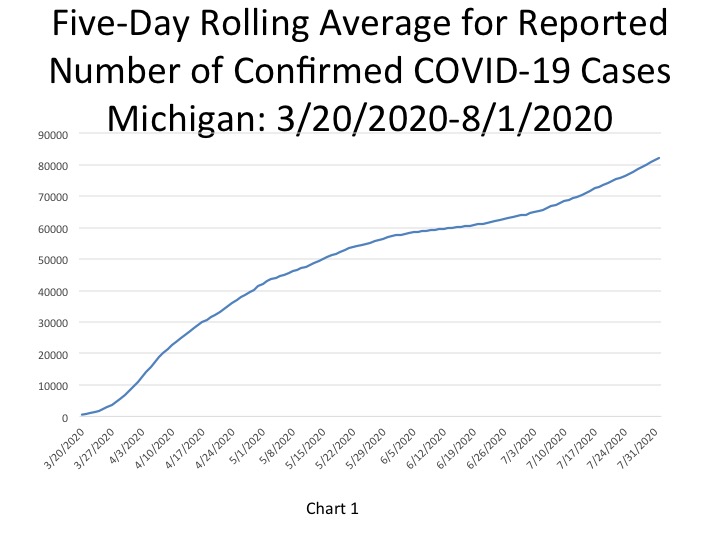
On Aug. 16, 2020 the State of Michigan reported 93,662 total COVID-19 cases, an increase of 477 from the day prior. The number of new daily cases reported statewide on Aug. 16 is 11 more than what was reported on Aug. 15. New daily case numbers have been declining in recent days. In Chart 1 we show that the State total for the cumulative number of COVID cases on Aug. 16 was 92,572–a five-day rolling average. The five-day rolling average for the total number of COVID cases (Chart 1) reflects a smoother curve and adjusts for fluctuations in testing and/or the quality of reporting or failure to report.
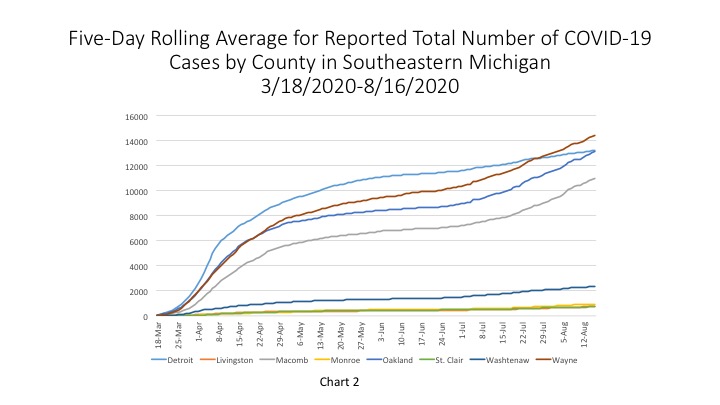
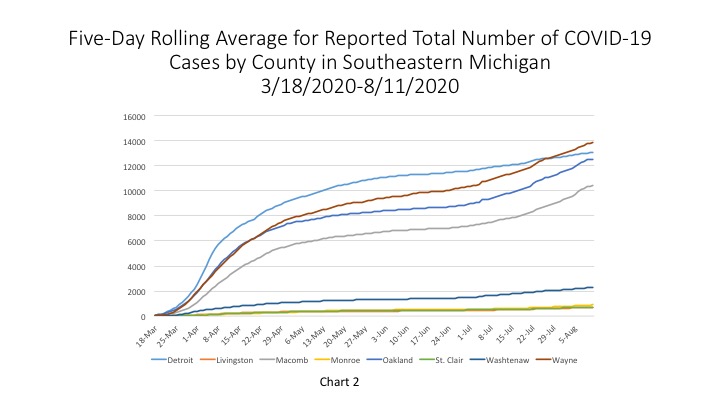
Chart 2 shows that, based on the five-day rolling averages, the growth of new COVID cases in Southeastern Michigan continues to increase, particularly in the counties surrounding Detroit. On Aug. 16, Wayne County reported the highest number of cases in the region at 14,445. Oakland County reported 13,153 cases, which was just under Detroit’s 13,238 case total, and Macomb County reported 11,004.
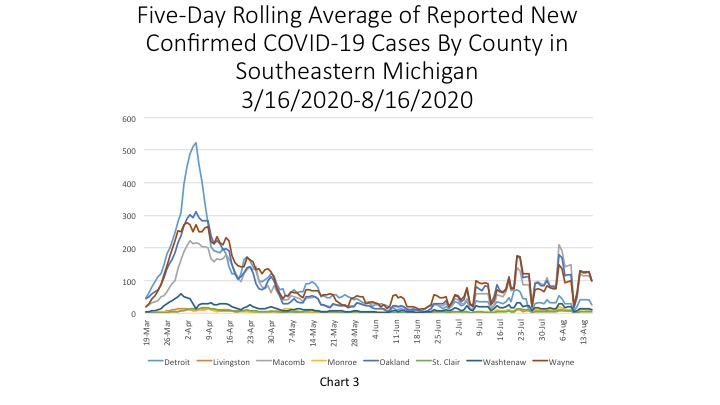
Charts 3 and 3.1 (which is just a closer look at the data) show that Wayne, Oakland and Macomb counties all had the highest number of new daily cases on Aug. 16, according to the five-day rolling average. Wayne and Macomb counties each reported 100 new cases and Oakland County reported 99 new cases. This is consistent with what Dr. Joneigh Khaldun, Michigan’s Chief Medical Executive said yesterday; she stated that it is the counties surrounding Detroit (Macomb, Monroe, Oakland and Wayne counties) that are causing the region to see a spike in case numbers.
The daily data highlighted in these posts is from Michigan.gov/coronavirus, where data is updated daily at 3 p.m. Historical data were supplied from covidtracking.com, which republishes COVID data from the State. Additionally, the case totals do not reflect the number of people who have recovered, just those who have been infected. In early June the State changed how it reports its data on the website, making data more accurate in the long-term but more complicated to track as well. The State regularly updates older data and as we continue to publish regular updates on COVID the State’s changes to past data many not always be reflected in our posts. The data published in new posts is accurate for the day we received it on though.
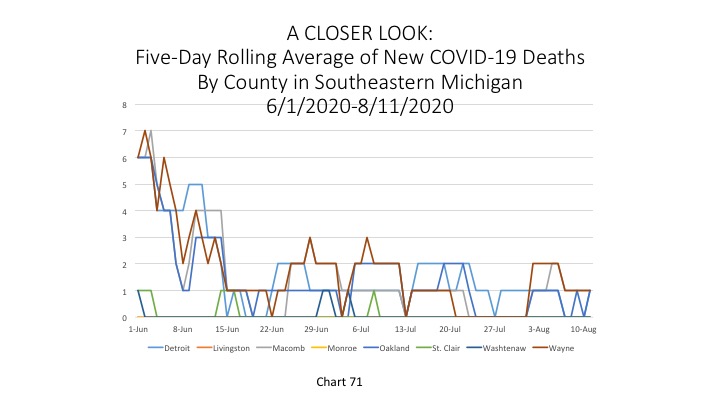
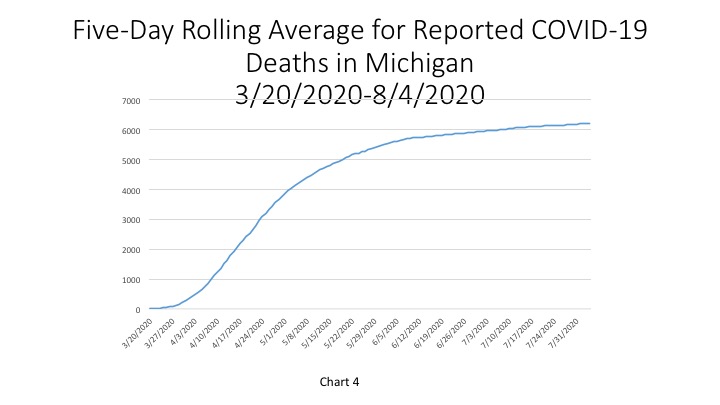
In Chart 4, the five-day rolling average, shows the number of deaths in the State of Michigan reached 6,321 on Aug. 16. The actual cumulative COVID-19 deaths on Aug. 18 was 6,340, an increase of 15 deaths from the prior day. However, of those 15 deaths, 7 were added to the daily total after death certificates were compared to the COVID database. Furthermore, of those 15 deaths 11 occurred in Southeastern Michigan.
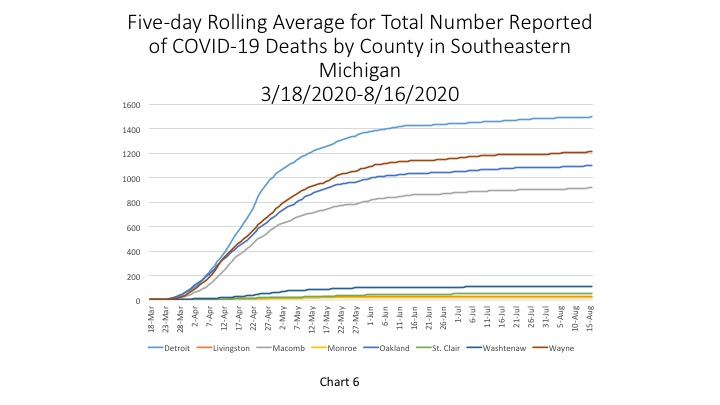
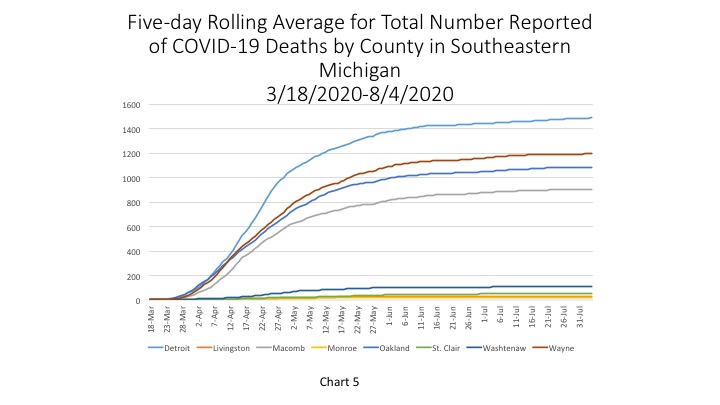
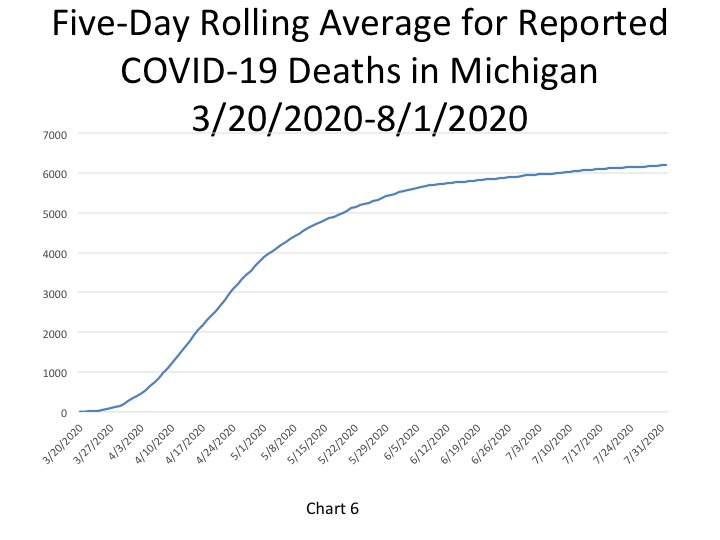
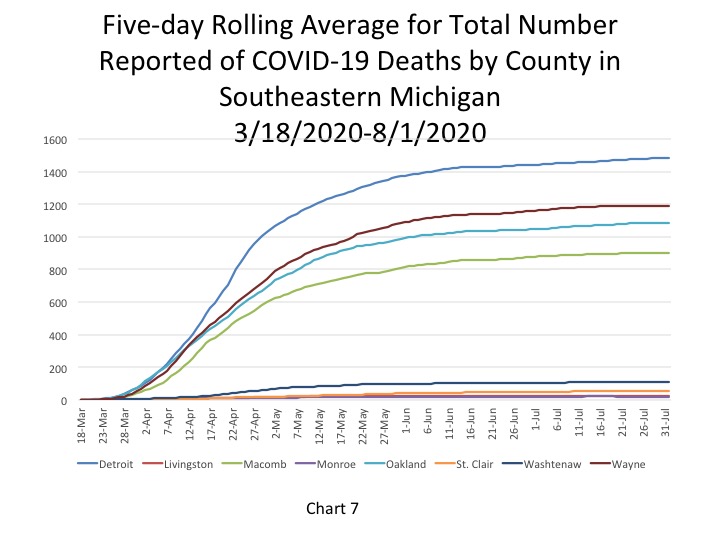
Chart 6 (a 5-day rolling average) further hones in on how COVID related deaths have significantly flattened out, but that of those occurring the majority are in Southeastern Michigan. On Aug. 16, the City of Detroit reported 1,496 cumulative deaths (the most in the region). Wayne County had the second highest total at 1,211 deaths on Aug. 16.
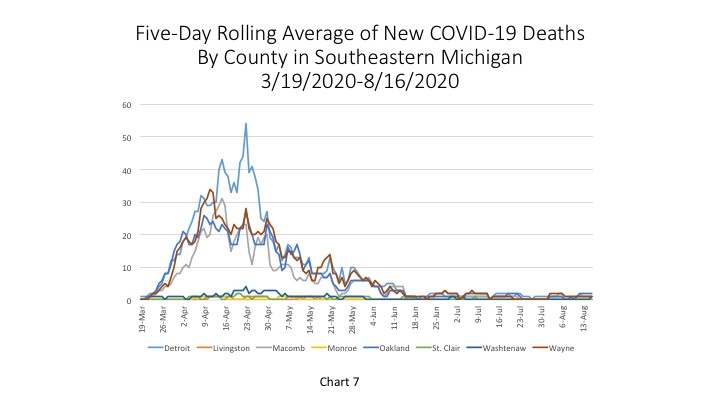
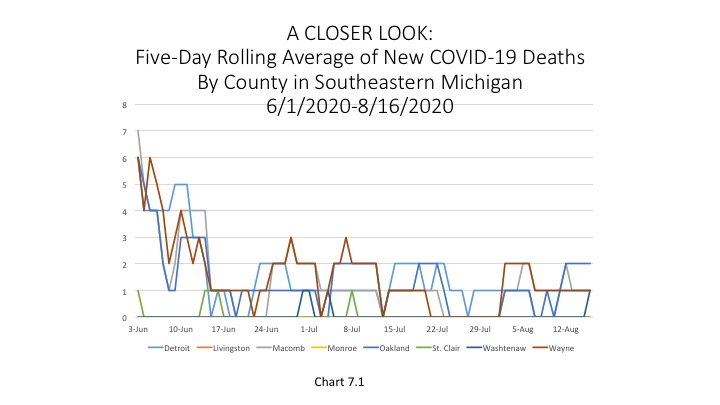
Charts 7 and Chart 7.1 shows how, on Aug. 16 Oakland County reported the highest number of deaths at 2 and Detroit, Macomb, Oakland and Washtenaw counties each reported 1 death.
In addition to deaths remaining low and daily case numbers declining, Dr. Khaldun also said on Aug. 14 positive case rates are declining across the region. This too brings about some optimism. However, she also warned that trends must be watched to best determine our community responses. And, despite the recent positive trends we continue to see signs that we will be dealing with this pandemic long after the summer months. For example, just yesterday Michigan State University announced that it was pivoting to online classes. School districts across the State are also continuing to grapple with how they will proceed with the upcoming school year. So, while a few days of low new case and death numbers provide hope, the long-term approach to quelling this pandemic must be to carefully protect our children, the frail elderly and public health in general.
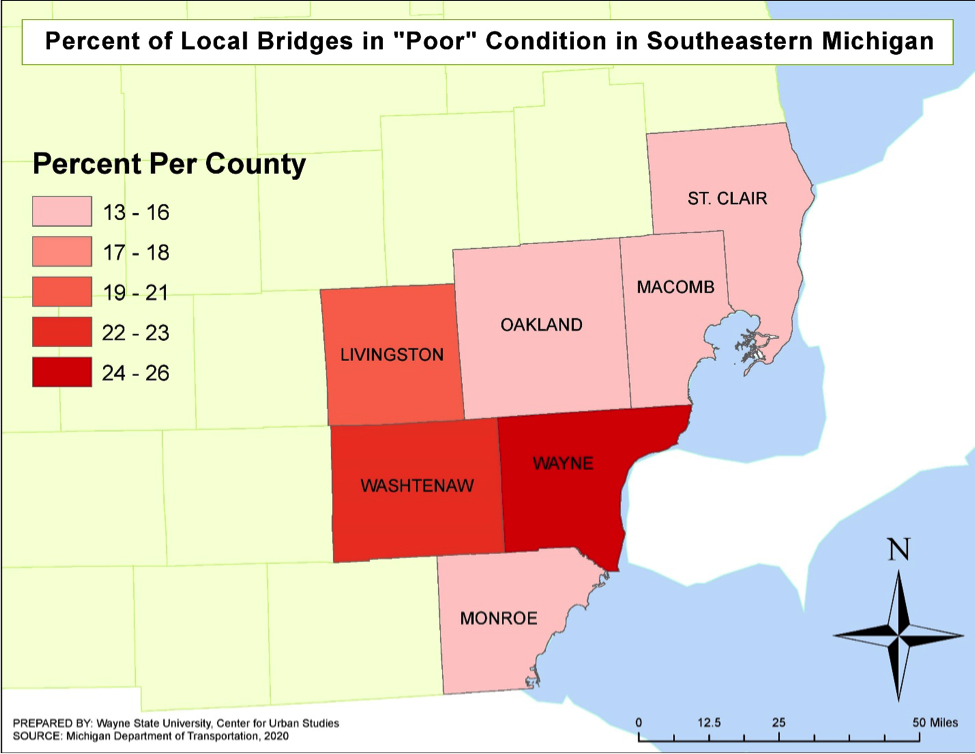
Last week we highlighted the condition of bridges maintained by the State Michigan through the Department of Transportation, this week we look at the condition of bridges maintained by the local entities, which are typically counties. Act 51 Funds are also used to maintain and build bridges at the local level, however, it is the local entities that are prioritizing the road/bridge projects rather than the State. Additionally, the local entities also have the ability to levy additional taxes to pay for the upkeep of their locally controlled infrastructure.
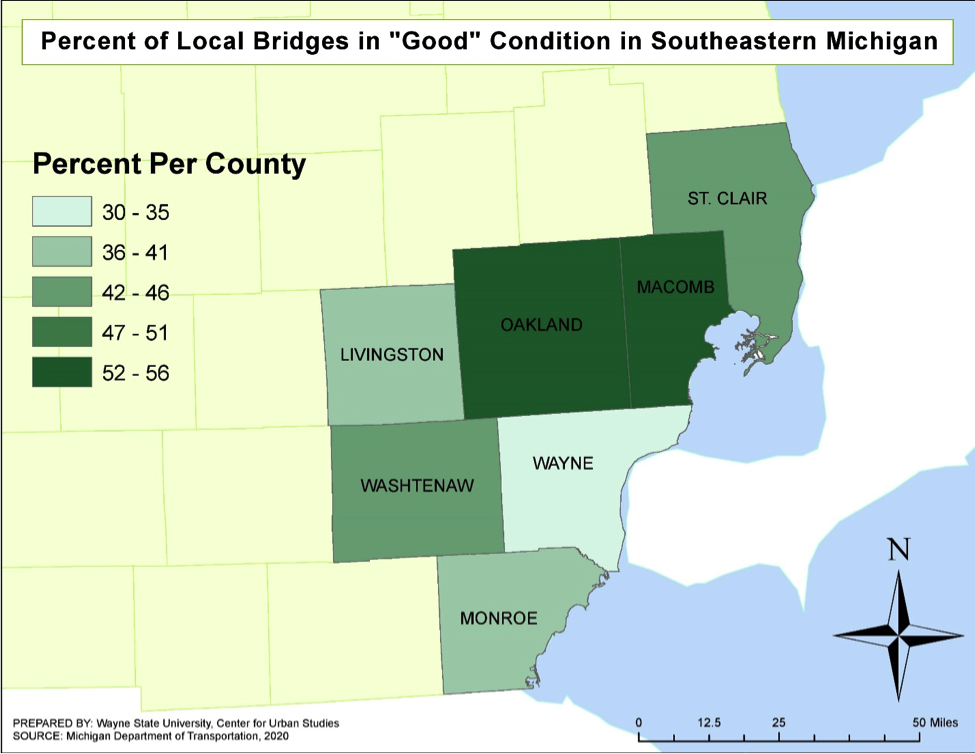
In the first map below we see that Macomb County has the highest percentage of bridges that are deemed to be in good condition at 56.1 percent, followed by Oakland County where 52.9 percent of the bridges are in good condition. Wayne County has the lowest percentage of its bridges deemed in good condition at 30 percent. According to the National Bridge Inventory database, a bridge is considered to be in good condition when it only requires routine maintenance.
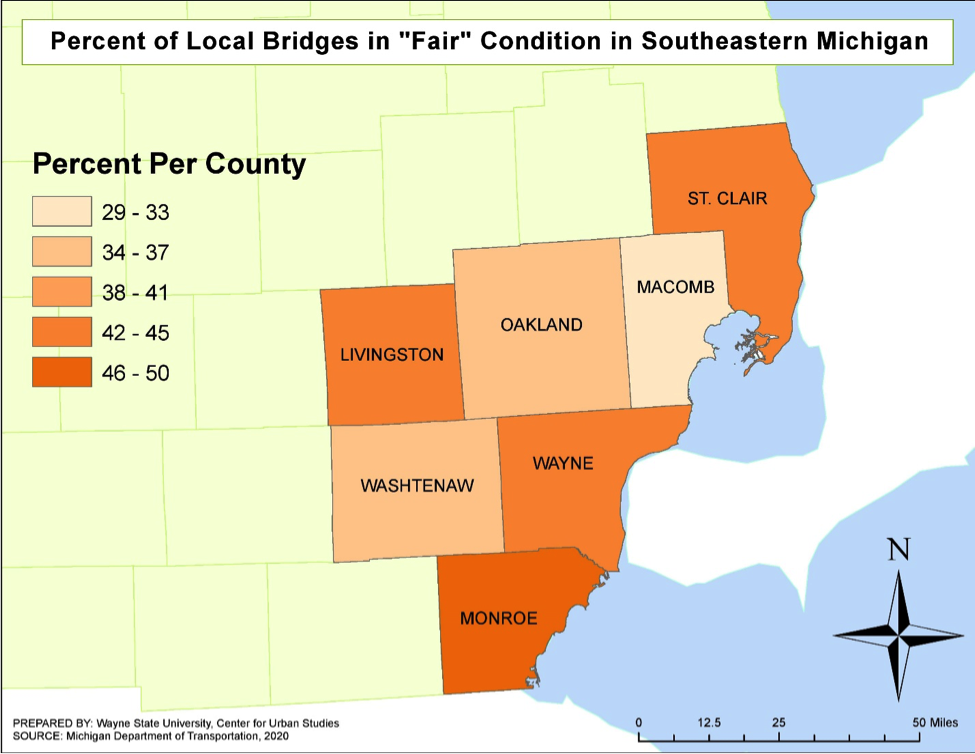
For the bridges deemed in fair condition, Monroe County has the highest percentage in the region at 49.5 percent. In Wayne County, 43.8 percent of the locally controlled bridges are in fair condition, meaning majority of the local bridges in the county are in that condition. Regionally, Macomb County has the lowest percentage of bridges in fair condition at 28 percent. A bridge is considered to be in fair condition when preventative maintenance and/or minor rehabilitation is needed.
Regionally, Wayne County has the highest percentage of bridges in poor condition at 26 percent, followed by Washtenaw County where 22.5 percent of local bridges are in that condition. St. Clair County has lowest percentage of locally controlled bridges in poor condition at 13 percent. A bridge is considered to be in bad condition when major or emergency rehabilitation is required or if a bridge is closed due to its condition.
Overall, the data shows that only three of the seven counties in Southeastern Michigan have majority of their locally controlled bridges deemed to be in good condition. The remaining four counties-Livingston, Monroe, Washtenaw and Wayne counties-all have majority of their local bridges deemed to be in fair condition. While this is better than majority of them being in poor condition, it does show signs that the local government entities should continue to monitor the conditions of the local bridges, and truly all the local infrastructure, to best prioritize regular maintenance and rehabilitation work to extend the overall life of structures for as long as safely possible.
Furthermore, when comparing the overall conditions of the bridges overseen at the local level versus those overseen by MDOT, six of the seven counties in Southeastern Michigan had majority of their bridges deemed to be in fair condition, and all at highest percentages than the locally controlled ones (majority of Washtenaw County’s MDOT bridges were in good condition, but it also had the highest percentage of MDOT bridges in poor condition). What this likely shows is the State has done a better job at regular maintenance on this section of infrastructure to ensure the bridges remain stable, but some of the locals (Oakland, Macomb and St. Clair counties) have been able to utilize their local funding better to put more of their bridges into the good category. How funding is divided up for infrastructure projects at the State and local level is based on many things including, immediate needs, guidelines set forth by the State of Federal government, public outcry and politics
Michigan reported 1,121 new COVID cases on Aug. 13, 2020-the highest number of new daily cases reported since May 14. The number of new daily cases reported on Aug. 13 is more than double the amount of daily cases reported the day before, which was 515. In total, Michigan reported 90,392 cases on Aug. 13. In Chart 1 we show that the State total for the number of COVID cases on Aug. 11 was 88,756–a five-day rolling average. The five-day rolling average for the total number of COVID cases (Chart 1) reflects a smoother curve and adjusts for fluctuations in testing and/or the quality of reporting or failure to report.
Chart 2 shows that, based on the five-day rolling averages, the growth of new COVID cases in Southeastern Michigan continues to increase. However, the chart also shows that the growth of COVID cases in Detroit has somewhat stabilized compared to the growth of cases in Wayne, Oakland and Macomb counties. On Aug. 11, Wayne County reported the highest cumulative number of cases in the region at 13,845. Oakland County reported 12,541 cases and Macomb County reported 10,435. Detroit reported 13,049 cumulative COVID cases on Aug. 11.
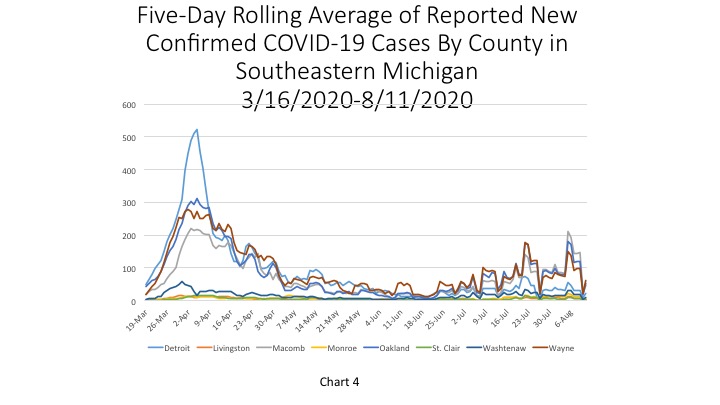
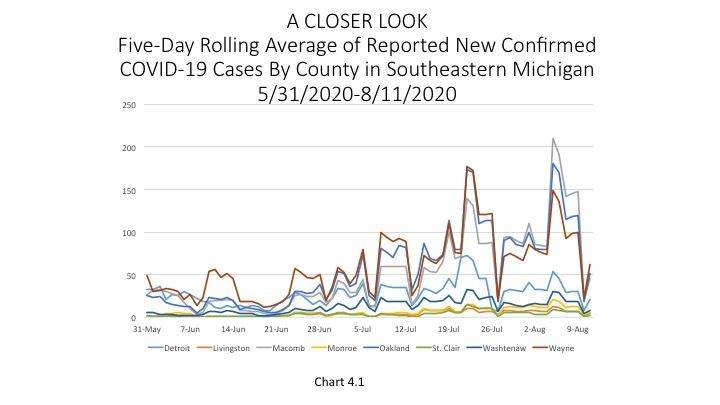
In addition to having the highest number of total COVID cases Wayne County in the region, Charts 4 and 4.1 (which is just a closer look at the data) shows that it also had the highest number of new daily cases on Aug. 11. Wayne County reported 62 new cases on Aug. 11. Oakland County reported 51 new daily cases, Macomb County reported 46 and Detroit reported 21 new cases, according to the five-day rolling averages.
The daily data highlighted in these posts is from Michigan.gov/coronavirus, where data is updated daily at 3 p.m. Historical data were supplied from covidtracking.com, which republishes COVID data from the State. Additionally, the case totals do not reflect the number of people who have recovered, just those who have been infected. In early June the State changed how it reports its data on the website, making data more accurate in the long-term but more complicated to track as well. The State regularly updates older data and as we continue to publish regular updates on COVID the State’s changes to past data many not always be reflected in our posts. The data published in new posts is accurate for the day we received it on though.
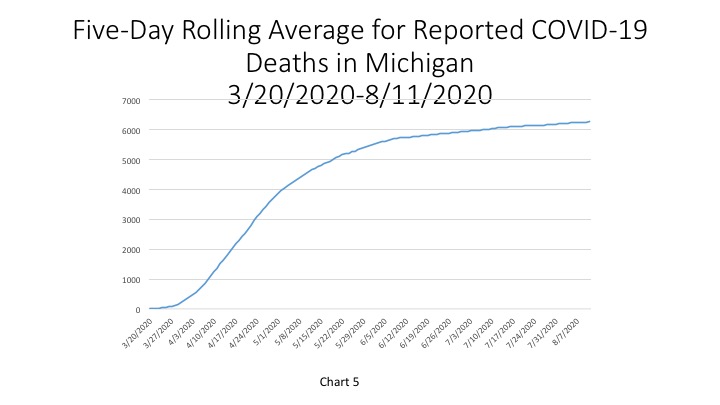
In Chart 5, the five-day rolling average for the number of deaths in Michigan, shows the number of deaths in the State of Michigan reached 6,266 on Aug. 11. The actual cumulative COVID-19 deaths on Aug. 13 was 6,289, an increase of 16 deaths from the prior day. However, of those 16 deaths, 9 were added to the daily total after death certificates were compared to the COVID database. Furthermore, of those 16 deaths 8 occurred in Southeastern Michigan.
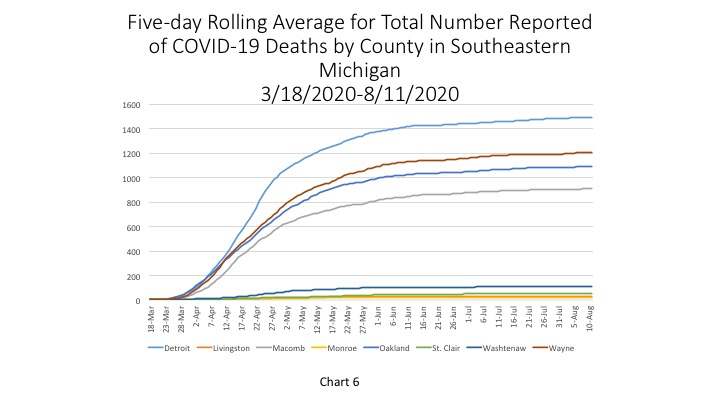
Chart 6 (a 5-day rolling average) shows that the numbers of COVID related deaths has significantly flattened out in Southeastern Michigan. On Aug. 11, the City of Detroit reported 1,491 deaths. Wayne County had the second highest total at 1,205 deaths on Aug. 11.
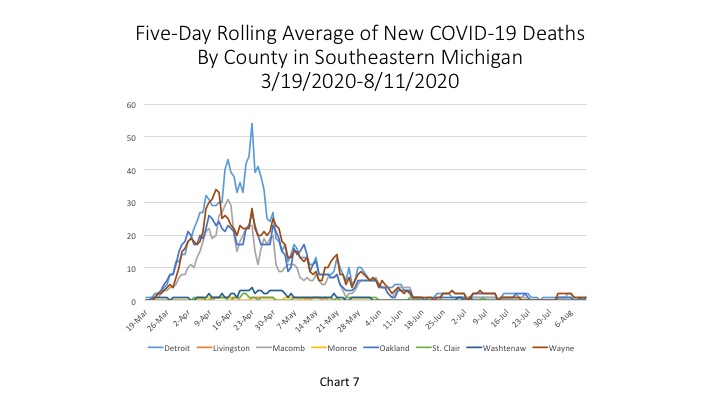
Charts 7 and Chart 7.1 shows how, on Aug. 11 Detroit, Macomb, Oakland and Wayne counties each reported 1 death.
While Michigan reported the highest number of new daily cases on Aug. 13 the Michigan Department of Health and Human Services also reported that the State didn’t see a large increase in its positive case rate and that it had the highest number of tests reported back on Wednesday since the pandemic began. Furthermore, a recent Mlive article highlights how Michigan recently ranked 40th in the seven-day average of new coronavirus cases per capita, and 40th in percent testing positive on coronavirus diagnostic tests.
The number of new daily cases reported on Aug. 13 remains concerning and a tell-tale sign that we must remain committed to health and safety recommendations set by the State of Michigan and the Centers of Disease Control. By following these guidelines we can continue to control the spread. Gov. Gretchen Whitmer announced today further plans to help slow the spread by providing 4 million free masks to the State’s most vulnerable population.
From roads to dams to bridges, infrastructure in Michigan is in desperate need of funding. Just recently, a Wayne County owned and operated bridge that allows people to travel to and from Grosse Ile was shut down for at least six months so that a portion of the bridge could be removed and replaced. This is just one of many examples of failing infrastructure in Southeastern Michigan, and throughout the State as a whole. In this post we show what percentage of the Michigan Department of Transportation controlled bridges in Southeastern Michigan are in good, fair and poor condition. The data is from the Michigan Department of Transportation for 2020.
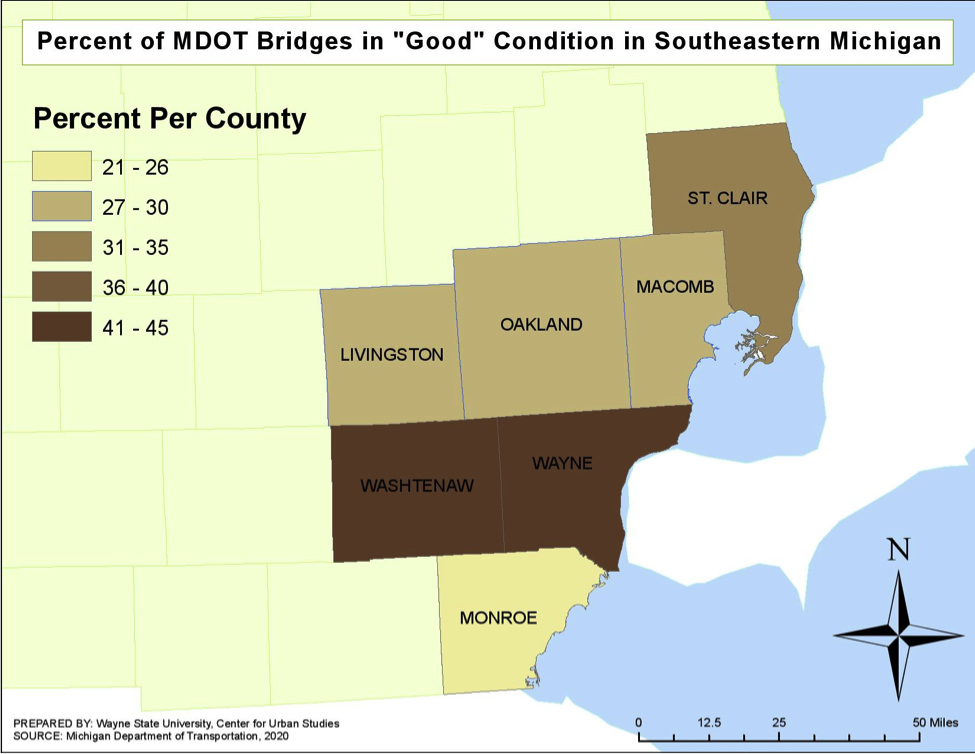
In the first map we see the percentage of MDOT bridges in each county that are considered to be in good condition. According to the National Bridge Inventory database, a bridge is considered to be in good condition when it only requires routine maintenance. Wayne County has the highest percentage at 44.5 percent, followed by Washtenaw County at 43.5 percent. Monroe County has the lowest percentage of bridges considered to be in good condition at 21 percent.
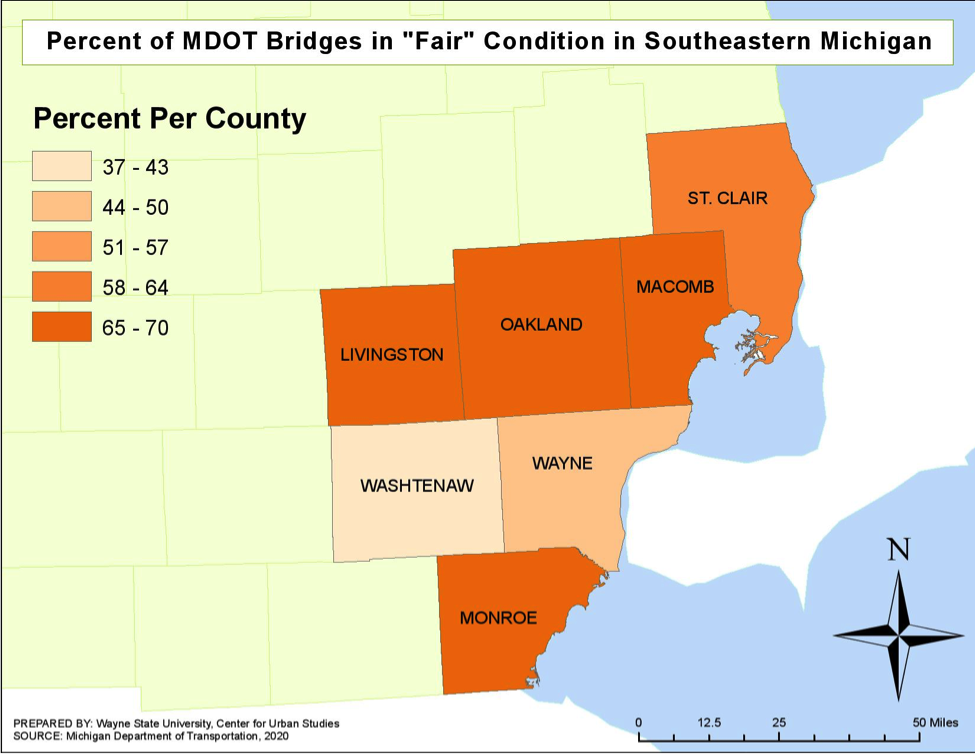
Monroe County was one of four counties in the region to have more than 66 percent of its bridges considered to be in fair condition. Both Monroe and Oakland counties have 66.1 percent of their bridges considered to be in fair condition, but Macomb County has the highest percentage of bridges in fair condition at 70.2 percent. In Livingston County 66.5 percent of the roads are in fair condition. A bridge is considered to be in fair condition when preventative maintenance and/or minor rehabilitation is needed.
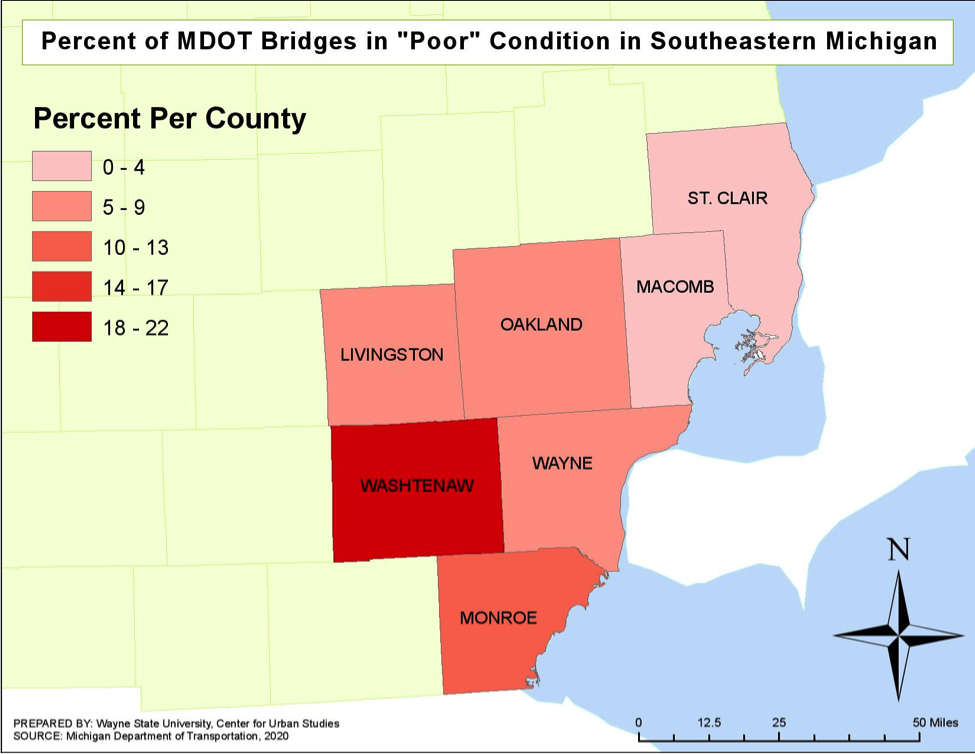
Washtenaw County has highest percentage of bridges in poor condition at 22.5 percent, followed by Monroe County with 12.9 percent of the bridges in poor condition. Macomb County reported that 0 percent of the bridges there are in poor condition. A bridge is considered to be in bad condition when major or emergency rehabilitation is required or if a bridge is closed due to its condition.
There is no question that Michigan’s infrastructure funding needs an overhaul so the citizens or out-of-towners traveling on roadways and bridges in the State are safe. Earlier in 2020 it was announced that the Michigan Department of Transportation planned to spend $7.3 billion on state highways and bridges over the next five years; this is an increase from the $3.8 billion that had originally been planned. The $3.5 billion increase is a result of a bond initiative Gov. Gretchen Whitmer announced. The majority of road and bridge funding in the State is received through federal and state tax dollars. Keep watching, though, because some of this funding may threatened because of the Covid-19 pandemic and the effect it is having on budgets.
On Aug. 6, the State of Michigan reported a total of 85,429 cases, an increase of 726 cases from the day prior. In terms of the number of new daily cases, the 726 new COVID cases reported on Aug. 6 is an increase from the 657 new cases reported on Aug. 5. In Chart 1 we show that the State total for the number of COVID cases on Aug. 4 was 84,071–a five-day rolling average. The five-day rolling average for the total number of COVID cases (Chart 1) reflects a smoother curve and adjusts for fluctuations in testing and/or the quality of reporting or failure to report.
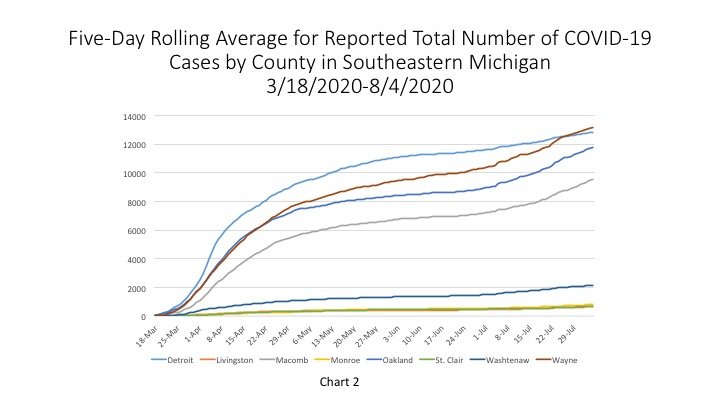
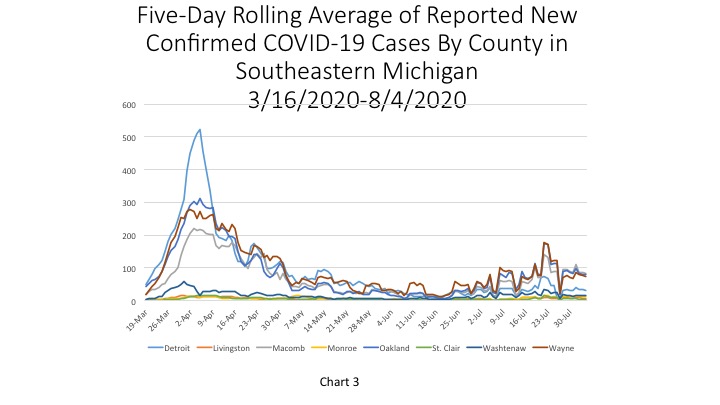
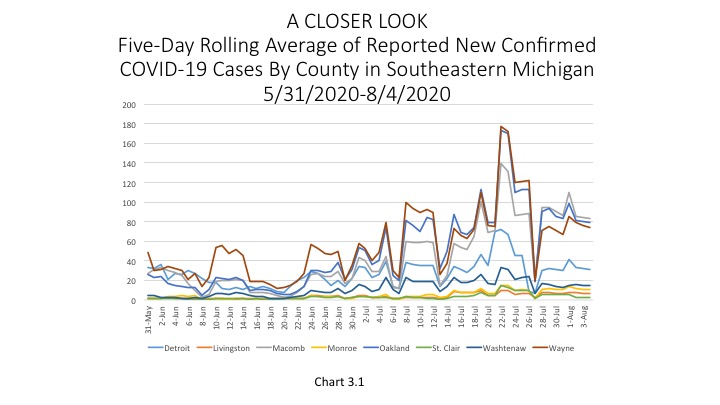
Chart 2 shows that, based on the five-day rolling averages, the growth of new COVID cases in Southeastern Michigan continues to increase, with the total number of cases in Wayne County continuing to rise above the other counties in the region. On Aug. 4, Wayne County’s numbers reached 13,187. Detroit reported 12,833 COVID cases on Aug. 4. Oakland County reported 11,769 cases and Macomb County reported 9,531. While the number of COVID cases in Wayne County is the highest in the region, Charts 3 and 3.1 (which is just a closer look at the data) shows that Macomb County has recently had the highest number of new daily COVID cases. According to the five-day rolling average, Macomb County reported 79 new cases. On Wednesday, Macomb County was labeled as one of three hot spot counties in the State, which is certainly related to the high number of new daily cases the County is reporting. Also on Aug. 4, Wayne County reported 74 new cases and Detroit reported 31 new COVID cases.
The daily data highlighted in these posts is from Michigan.gov/coronavirus, where data is updated daily at 3 p.m. Historical data were supplied from covidtracking.com, which republishes COVID data from the State. Additionally, the case totals do not reflect the number of people who have recovered, just those who have been infected. In early June the State changed how it reports its data on the website, making data more accurate in the long-term but more complicated to track as well. The State regularly updates older data and as we continue to publish regular updates on COVID the State’s changes to past data many not always be reflected in our posts. The data published in new posts is accurate for the day we received it on though.
In Chart 4, the five-day rolling average for the number of deaths in Michigan, shows the number of deaths in the State of Michigan reached 6,221 on Aug. 4. The actual cumulative COVID-19 deaths on Aug. 6 was 6,246, an increase of 26 deaths from the prior day. However, of those 26 deaths, 17 were added to the daily total after death certificates were compared to the COVID database. Furthermore, of those 26 deaths 1 occurred in Southeastern Michigan.
Chart 5 (a 5-day rolling average) further hones in on how majority the number of COVID related deaths has significantly flattened out in Southeastern Michigan. On Aug. 4, the City of Detroit reported 1,488 deaths. Wayne County had the second highest total at 1,197 deaths on Aug. 4.
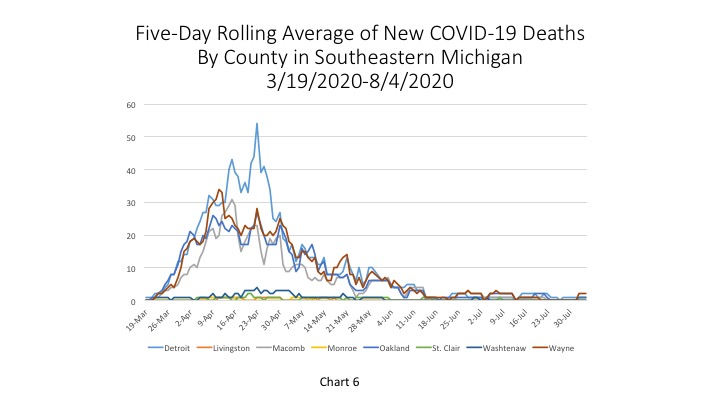
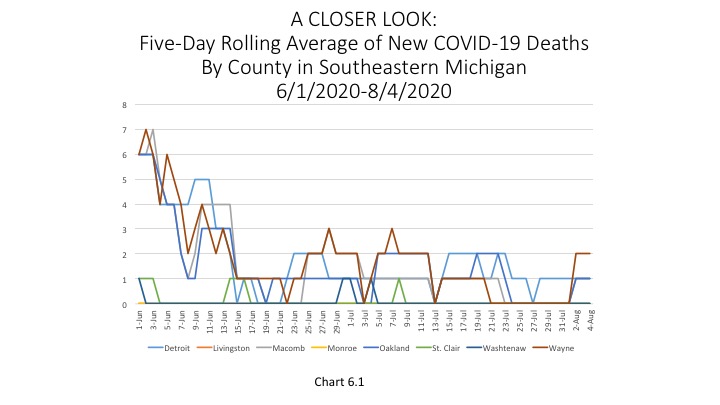
Charts 6 and Chart 6.1 shows how, on average, the number of daily COVID deaths has not risen above 2 since July 7. On Aug. 4, Wayne County reported the highest number of deaths at 2.
While the State of Michigan reported 726 new COVID cases on Aug. 6 Michigan’s Chief Medical Examiner Dr. Joneigh Khaldun said we are starting to see a plateau in the number of cases. She warned though that this does not mean citizens should ease up on restrictions, such as social distancing and wearing masks. Furthermore, while most of the State is seeing a plateau, Dr. Khaldun also noted that the Grand Rapids and Kalamazoo regions are still experiencing higher daily case numbers than other regions in the State, but those too are beginning to decrease.
On Aug. 3, the State of Michigan reported a total of 83,386 cases cases, an increase of 604 cases from the day prior. In terms of the number of new daily cases, the 604 new COVID cases reported on Aug. 3 is an increase from the 426 new cases reported on Aug. 2. Of the new 604 new COVID cases, 380 were documented in Southeastern Michigan. In total, 71 percent of the new COVID cases were in Southeastern Michigan, meaning case numbers are increasing at a higher rate locally. In Chart 1 we show that the State total for the number of COVID cases on Aug. 1 was 82,206–a five-day rolling average. The five-day rolling average for the total number of COVID cases (Chart 1) reflects a smoother curve and adjusts for fluctuations in testing and/or the quality of reporting or failure to report.
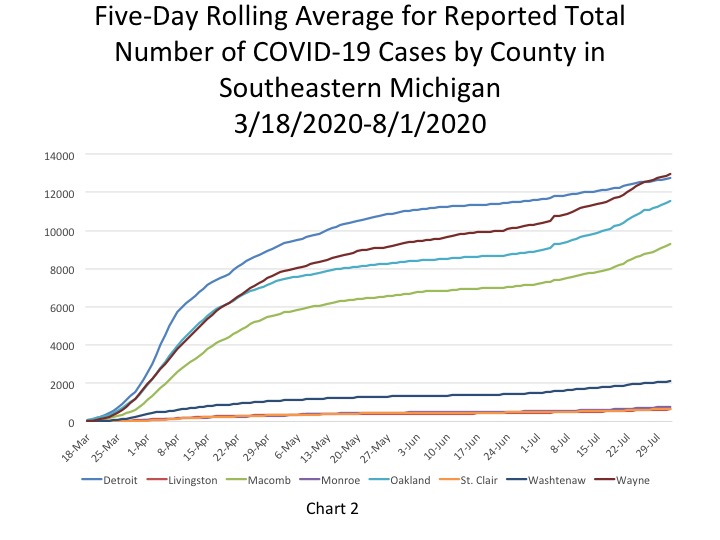
Chart 2 shows that, based on the five-day rolling averages, the growth of new COVID cases in Southeastern Michigan continues to increase, with the total number of cases in Wayne County now surpassing those being reported in Detroit. On Aug. 1, Wayne County’s numbers reached 12,959. Detroit reported 12,737 COVID cases on Aug. 1. Oakland County reported 11,529 cases and Macomb County reported 9,280.
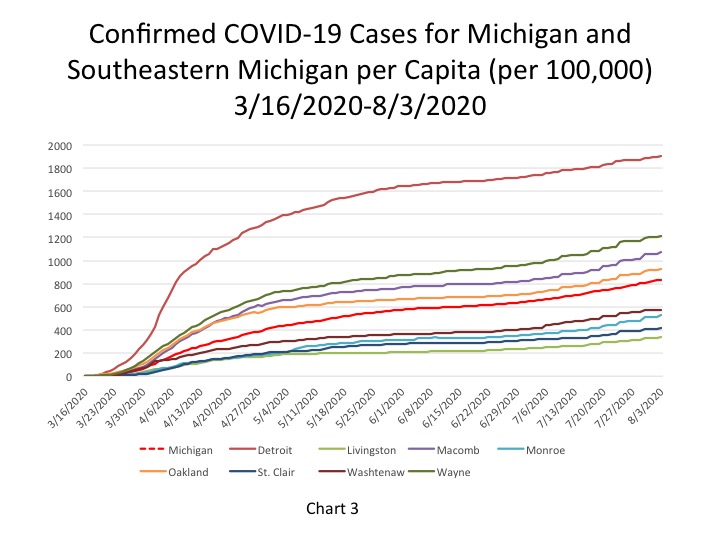
The City of Detroit had 1,901 COVID cases per 100,000 people as of Aug. 3, an increase from 1,893 on Aug. 2 (Chart 3). This is based upon a reported increase of 55 new COVID cases between Aug. 2 and Aug. 3, bringing the total number of COVID cases in Detroit to 12,788. Wayne County reported 1,212 cases per 100,000 people, and Oakland County had 923 cases per 100,000 people. These per capita rates were based upon 13,038 total cases for Wayne and for 11,605 Oakland. Macomb County reported 1,073 cases per 100,000 people, which is based upon 9,384 cases.
The daily data highlighted in these posts is from Michigan.gov/coronavirus, where data is updated daily at 3 p.m. Historical data were supplied from covidtracking.com, which republishes COVID data from the State. Additionally, the case totals do not reflect the number of people who have recovered, just those who have been infected. In early June the State changed how it reports its data on the website, making data more accurate in the long-term but more complicated to track as well. The State regularly updates older data and as we continue to publish regular updates on COVID the State’s changes to past data many not always be reflected in our posts. The data published in new posts is accurate for the day we received it on though.
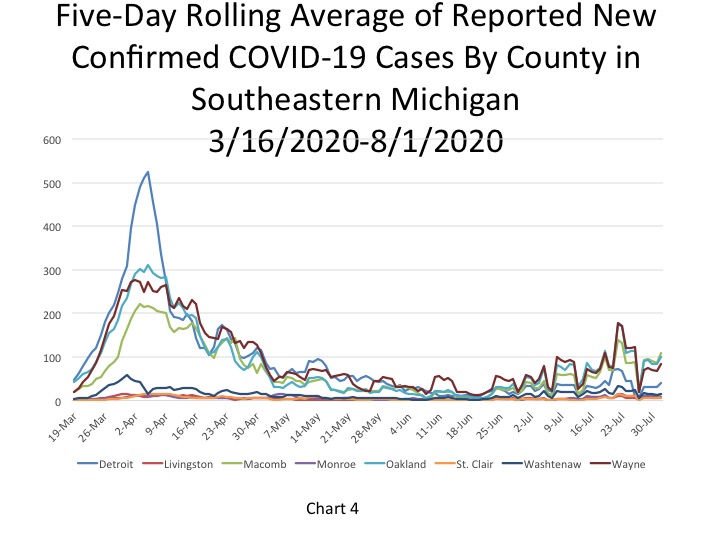
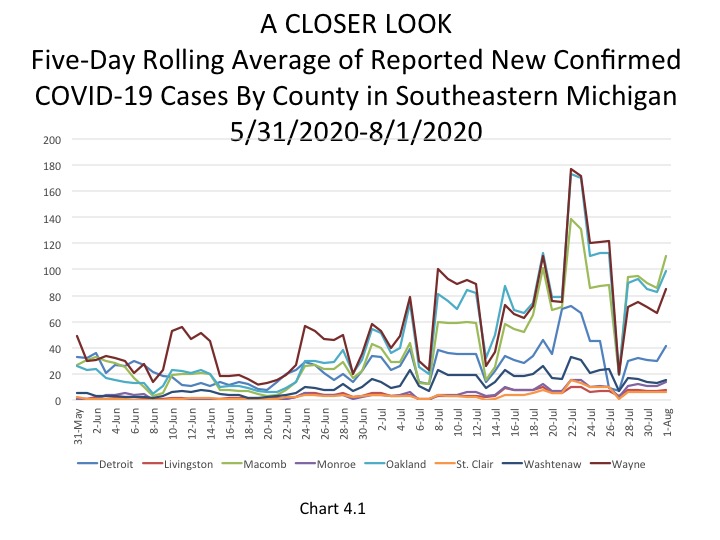
Chart 4 shows that Macomb County has been reporting the highest number of daily cases, according to the five-day rolling average, in about the last week. On Aug. 1, Macomb County reported 110 new daily cases; Chart 4.1 also shows this, but at a more zoomed in level. The charts also show that Detroit reported 41 new cases on Aug. 1, which is lower than the new cases reported out of Oakland and Wayne counties as well. Oakland County reported 99 new cases and Wayne County reported 85. Up until recently Wayne County had been consistently posting the highest new daily case numbers.
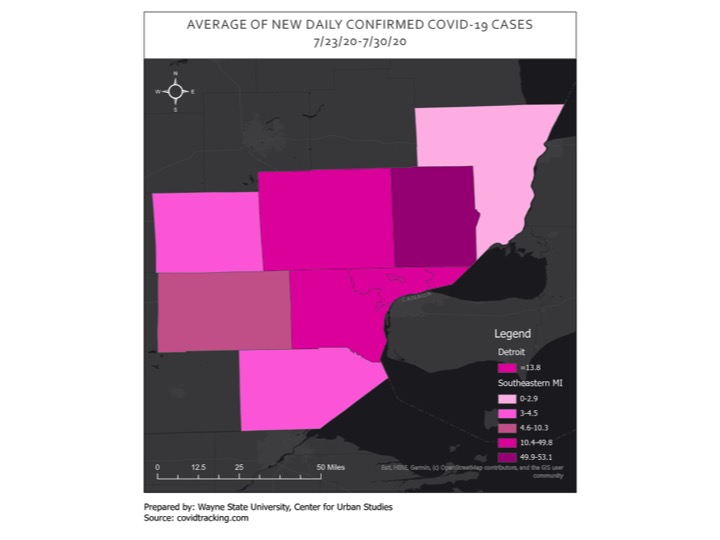
Map 1, which shows the average number of new daily COVID cases between July 23 and July 30 for Southeastern Michigan, highlights how Macomb County had the highest average number of new cases at 53.1, Oakland and Wayne counties were right behind it with an averages of 49.8 and 48.3 new daily cases, respectively. The average number of new cases for the City of Detroit in that time frame was a least half of those numbers; Detroit averaged 13.8 new cases. Comparing the average weekly data and the data from the new daily cases reported for Aug. 1 does show that new daily cases numbers are higher this week, thus far, than last—showcasing that COVID numbers are on the rise again.
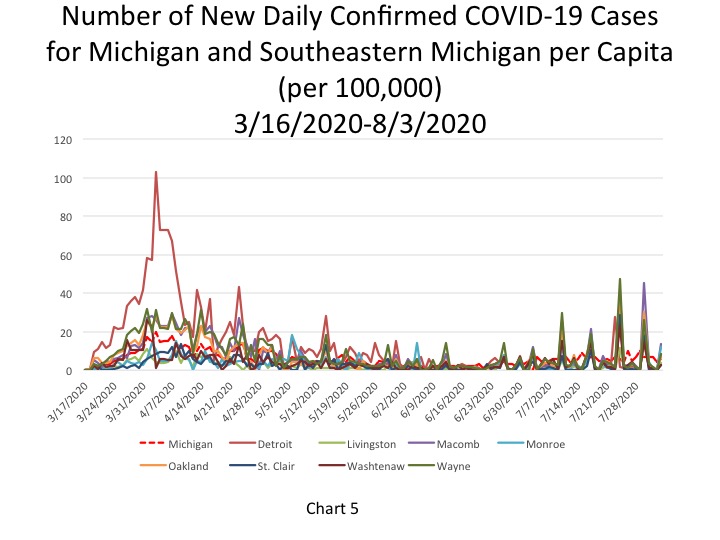
On Aug. 1, the per capita rate for the number of new daily COVID cases per 100,000 people was 6 for the State, which was equivalent to 604 new cases (Chart 5). Macomb County reported the highest per capita rate for the number of new daily COVID cases per 100,000 people at 14, which was equivalent to 120 new cases while Monroe County reported a rate of 12, which was equivalent to 8 new cases. Detroit reported a per capita rate for the number of new daily COVID cases per 100,000 people at 8 (55 new cases) and Wayne County had a rate of 9 (92 new cases).
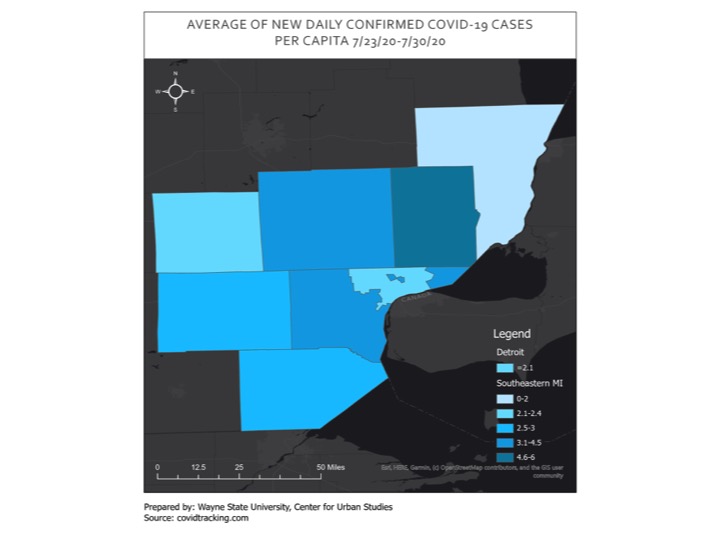
Map 2 mimics the message of Map 1, with Macomb County having the highest average number of daily confirmed COVID cases per 100,000 between July 23 and July 30. During that week Macomb County had an average of 6 daily COVID cases per 100,000 people. Detroit averaged a per capita rate of 2.1 during that time frame.
In Chart 6, the five-day rolling average for the number of deaths in Michigan, shows the number of deaths in the State of Michigan reached 6,203 on Aug. 1. The actual cumulative COVID-19 deaths on Aug. 3 was 6,202, an increase of 6 deaths from the prior day. Of the 6 deaths that were reported on Aug. 3, 1 occurred in Southeastern Michigan.
Chart 7 (a 5-day rolling average) further hones in on how majority the number of COVID related deaths has significantly flattened out in Southeastern Michigan. On Aug. 1, the City of Detroit reported 1,485 deaths. Wayne County had the second highest total at 1,192 deaths on Aug. 1.
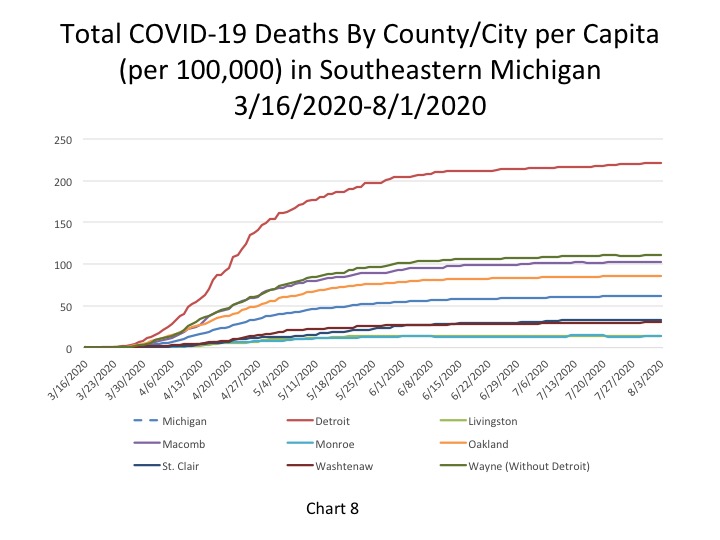
Like the death numbers, the per capita rates for the number of total COVID deaths in Southeastern Michigan continues to remain fairly stagnant across the region. Detroit reported 221 total COVID deaths per 100,000 people on Aug. 3, which was equivalent to 1,486 deaths. Wayne County reported a per capita rate of 111 (1,192 deaths), Macomb County reported a per capita rate of 103 (899 deaths) and Oakland County reported a per capita rate of 86 (1,084 deaths). The State of Michigan reported a per capita rate for the number of total COVID deaths at 612per 100,000 people, which was equivalent to 6,202 total deaths.
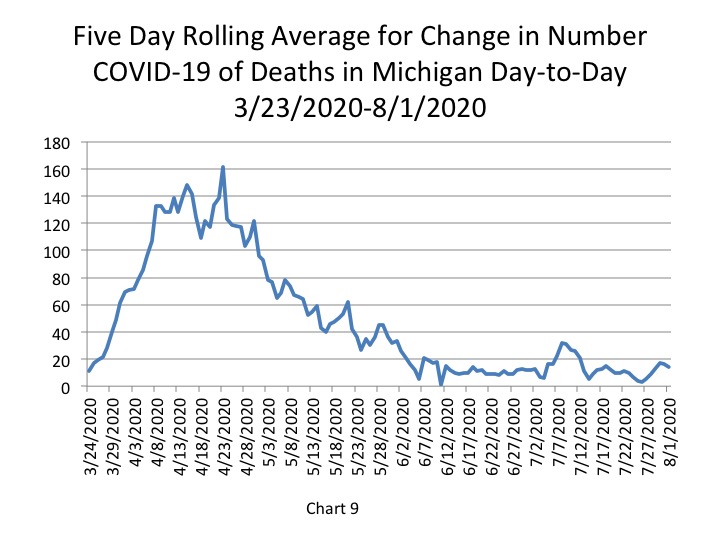
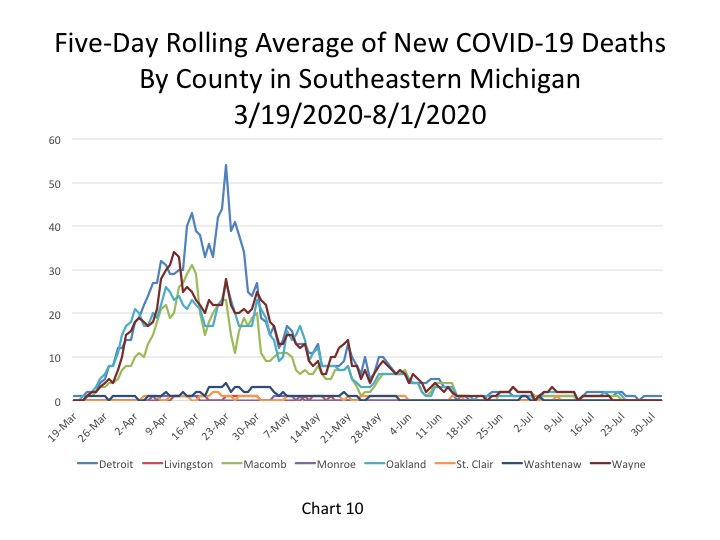
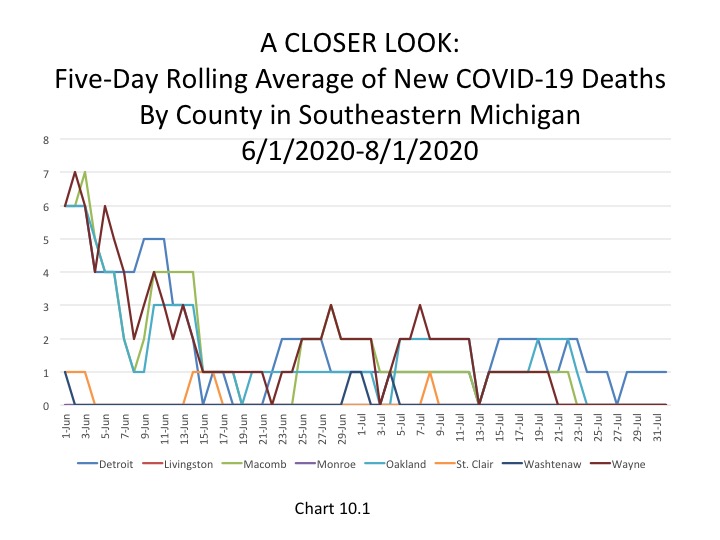
Chart 9, the five day rolling average of deaths, shows the number of new statewide deaths was reported at 14 on Aug. 1. Furthermore, Chart 10 and Chart 10.1 shows how the number of deaths in Southeastern Michigan continues to remain low in the region. Chart 10.1 shows a more in-depth look at the number of new daily COVID deaths in the last month so viewers can better discern where in the Southeastern Michigan the numbers are increasing, decreasing or remaining the same. Detroit reported 1 new daily death on Aug. 1 while all the counties reported 0.
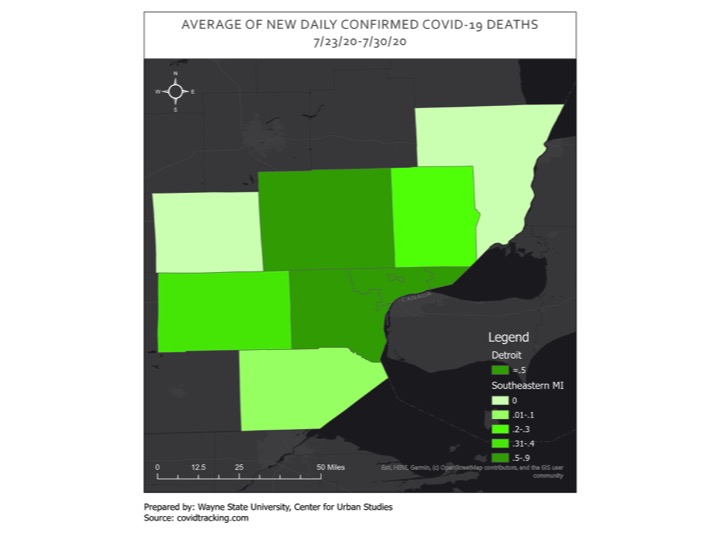
In Map 3, Wayne and Oakland counties had the highest average number of daily COVID deaths between July 23 and July 30 at 0.9 and Detroit averaged 0.2 deaths. The averages reported from last week reinforce the message that COVID deaths remain low and on the decline.
A review of the most recent COVID numbers for the State of Michigan and the Southeastern Michigan reason show that COVID case numbers are increasing, while deaths remain low and fairly stable. It is clear that large gatherings, which have again been banned, are being attributed to several of the outbreaks in the area. We must remain diligent in fighting the virus and that means minimal contact with others, no large gatherings and wearing a mask.
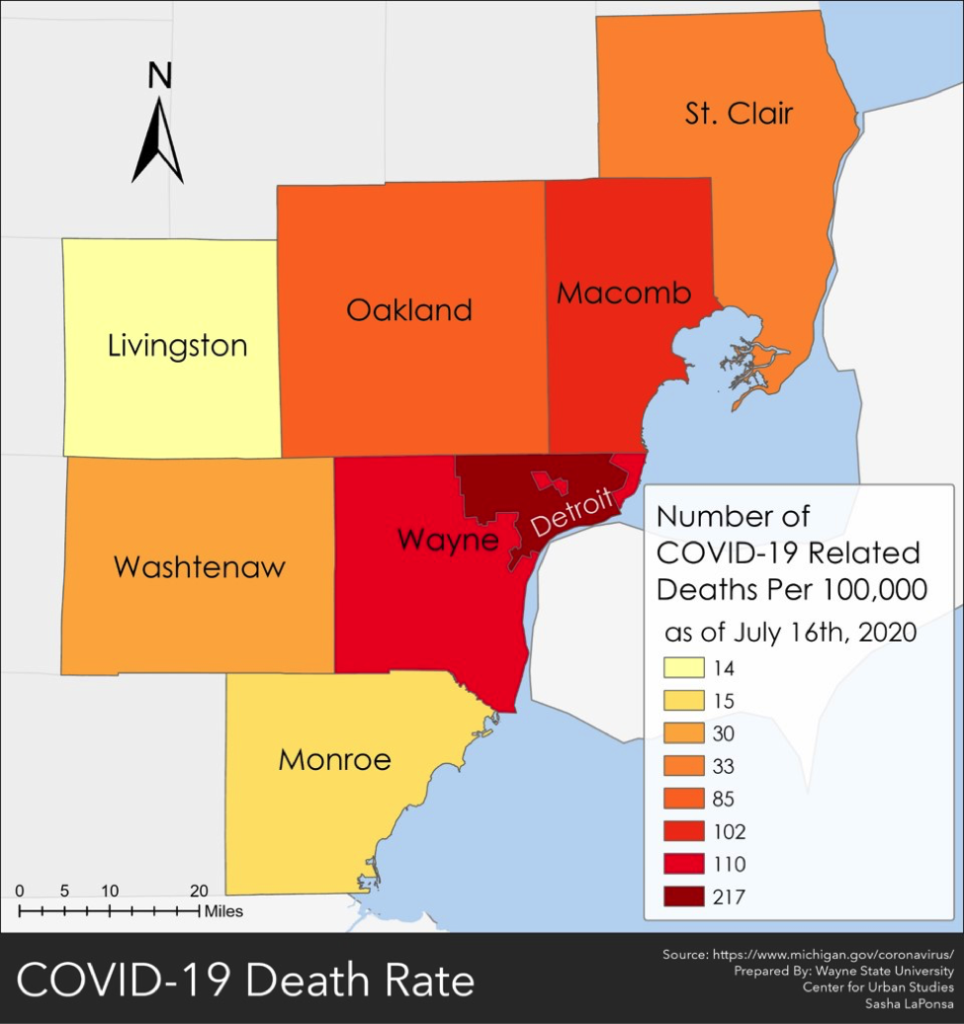
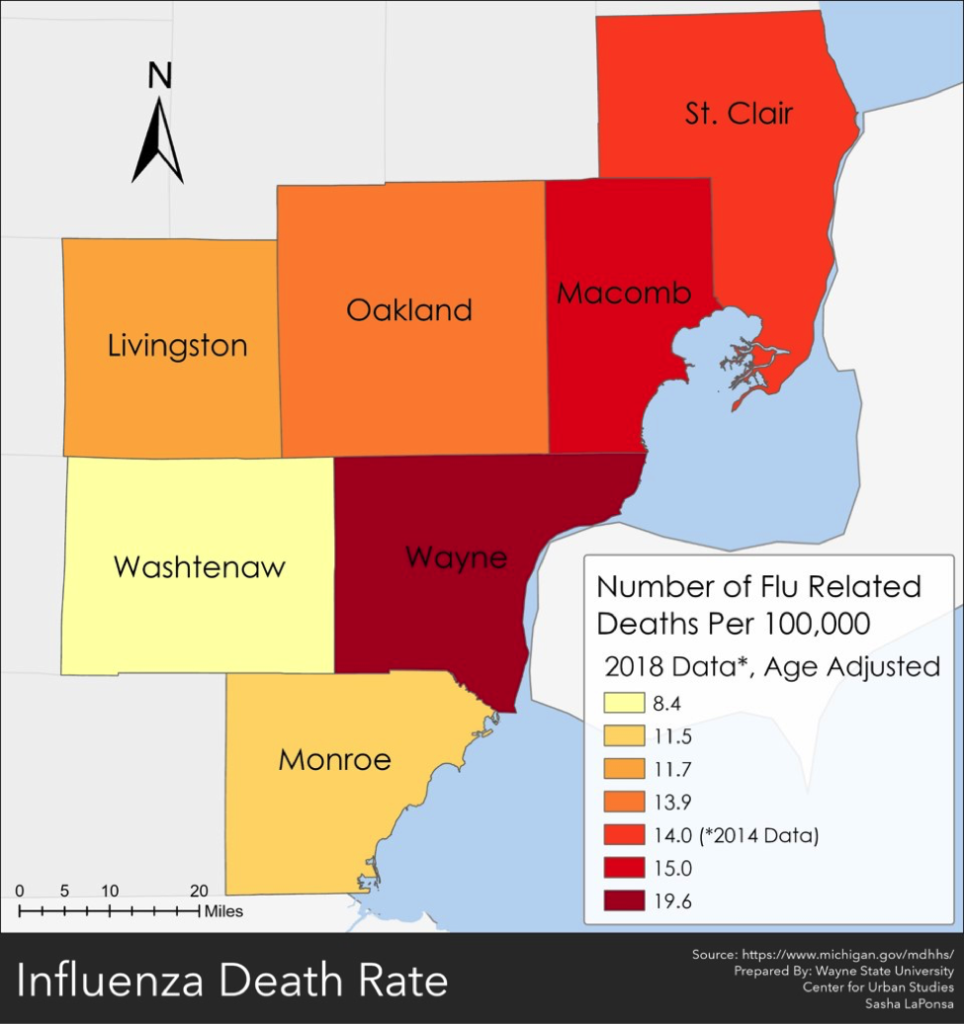
The death rate for the coronavirus is much higher than the death rate for the flu in Southeastern Michigan, particularly in the more urban counties. Data from the Michigan Department of Health and Human Services shows the death rate for the flu per 100,000 people did not reach above 19.6 in Southeastern Michigan, while the death rate for COVID-19 was as high as 217 per 100,000 people. Please note that the data presented in this post is from two different time periods; the flu data is from 2018 (the most recent data available) and the COVID-19 data is from July of 2020.
According to the data, the death rate for COVID-19 was highest in the City of Detroit at 217 deaths per 100,000 people as of July 17, 2020. That rate has gone up since then, but not by much, as the COVID-19 death numbers have been minimally increasing. On Aug. 2, 6,206 total COVID-19 deaths were reported in the State of Michigan, of which 1,574 were out of the City of Detroit. In the COVID-19 map below Wayne County had the second highest death rate at 110 deaths per 100,000 people; on Aug. 2 Wayne County reported 1,228 total COVID-19 deaths. Livingston County had the lowest COVID-19 death rate at 14 per 100,000 people, as shown on the first map, and on Aug. 2 it reported 28 total deaths.
In the second map below we see that the death rates for the flu ranged between 8.4 and 19.6 in Southeastern Michigan. The highest death rate for the flu was in Wayne County and was reported to be 19.6 per 100,000 people. The Wayne County COVID-19 death rate was reported to be 5.5 times higher, and the Wayne County COVID-19 numbers exclude data from Detroit while the flu data is inclusive of Detroit (these differences are due to how the State reports the data sets). In 2018 there were 263 total deaths from the flu in Wayne County. Washtenaw County had the lowest death rate from the flu at 8.4 per 100,000 people, which was equivalent to 33 total deaths. Washtenaw County’s death rate for COVID-19 was reported at 30 per 100,000 people.
The data alone shows that COVID-19 has killed far more people than the flu, both locally and nationally. According to the Centers for Disease Control, there have been more than 157,000 COVID-19 deaths in the US as of Aug. 2 and for the 2018-19 flu season there were 15,620 deaths. Although the number of COVID-19 deaths has not been increasing at the rate it was in the spring of 2020, the State of Michigan still reported 82,782 total COVID-19 cases on Aug. 2, which was an increase of 426 new cases from the day before. A confirmed case can turn to death, depending on various factors. Discounting the severity of COVID-19 and implying it is similar to the flu is irresponsible and creates a meme that is not a major threat to public health.