Elderly Population Continues to Grow in Southeastern Michigan

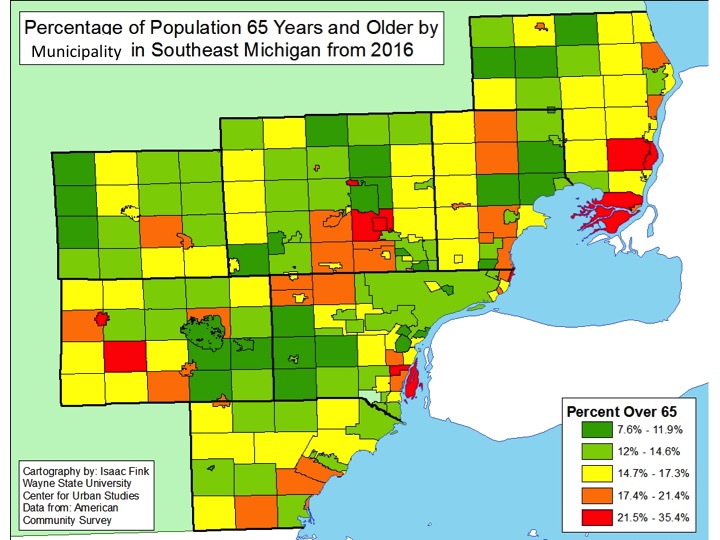
While there are only 10 communities in Southeastern Michigan with more than 21 percent of the population 65 years of age or older, the number of communities with a growing elderly population is far greater than those with a declining elderly population. According to the data, majority of the rural communities throughout Southeastern Michigan-Monroe, Washtenaw, Livingston, St. Clair and northern Macomb and Oakland counties-have seen the greatest increases in a growing elderly population. Overall, St. Clair County’s elderly population grew the most between 2010 and 2016, with nine of the communities experiencing between 6 and 13 percent increases in the 65 years of age and older population. In St. Clair County, Algonac (21%), China Township (22%) and East China Township (26%) had the highest percentage of elderly residents in 2016. However, it was Lake Angelus, in northern Oakland County, that had the highest percentage of resident 65 years of age or older at 35 percent.

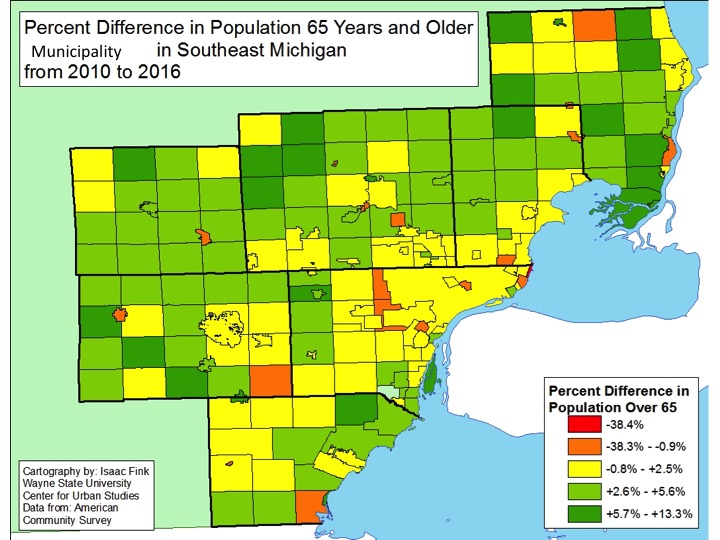
Detroit, and its inner and outer ring suburbs have the highest concentration of the aging population that is growing at a slower rate. As the second map below shows, majority of the Detroit suburbs did not experience a growth of the 65 years of age and older population above 2.5 percent between 2010 and 2016. In fact, some of those communities (Hamtramck, Grosse Pointe, Redford, Dearborn Heights) experienced an overall decline in the 65 years of age and older population between 2010 and 2016. In Detroit, the 65 years of age and older population only grew by 1.6 percent between 2010 and 2016. According to the data, in 2010 the elderly population was at 11 percent and by 2016 it grew to 12.6 percent. In Hamtramck, the 65 years of age population decreased from 9.1 percent in 2010 to 7.8 percent in 2016.

According to a recent Detroit Free Press article, by 2025 the number of people above the age of 65 will outnumber those 17 and younger. Nationally, such a growth of the elderly population isn’t expected to occur until 2035. There are varying reasons for the growth of the 65 years of age and older population locally, and nationally, including better medical advancements allowing people to live longer and the decline in birth rates over the year. One reason for what appears to be the quicker growth of the aging population in Michigan though is the fact that over about the last decade, particularly during the Great Recession, people have left to find jobs elsewhere. So, in short, out-migration has contributed to the fact that Michigan’s elderly population will outnumber its younger population within the next decade.

Average Life Expectancy in Southeastern Michigan Varies Greatly

We know that one of the outcomes of poverty and the consequent lack of high quality medical care is a shorter life. How big is that difference in Southeastern Michigan? It turns out that new data from the U.S. Centers for Disease Control gives us an idea. That data, at the Census Tract level, shows that average life expectancy ranges from 62 in some inner city Detroit tracts to 90 in some suburban tracts.

As the second first map below shows, most of Livingston County was in the 76-80 years of age range, although there are 18 Census Tracts in Livingston County where the average life expectancy is between 86 to 90 years of age. It is in Wayne County where all the Census Tracts are located, with the exception of one, with the lowest average life expectancies. As the second map shows, in the City of Detroit, there are 14 Census Tracts where the average life expectancy is between 62-65 years of age. Additionally, there are about 40 Census Tracts where the average life expectancy is between 68-70. Most of these Census Tracts are located west of Highland Park, with several located along Grand River Avenue. The only other Census Tract in the region with an average life expectancy below 66 years of age is in Monroe County in the City of Monroe.

The extremes of the data are attenuated when we examine county averages as shown in the third map. The average life expectancy in Southeastern Michigan at the county level ranges from 74.5 years of age to 79.6 years of age. The average life expectancy in the U.S. is 78.8 years of age. At the county level, Livingston County has the highest average life expectancy at 79.6 years of age.

While there is no specific information on what causes low life expectancy in any specific area, a Michigan Department of Health and Human Services spokesman said higher life expectancies are often related to higher education and access to health care and healthy food. In future posts we will examine what may cause the lower life expectancies in the Detroit area.

Detroit’s HIV Rates Highest in the Region

The City of Detroit had the highest HIV rate per 100,000 people in the Metro-Detroit region, according to the most recent data released by the Michigan Department of Health and Human Services. The rate per 100,000 people as of January 2018 was 718. Regionally, Wayne County (excluding the City of Detroit) had the second highest rate per 100,000 people at 190. Livingston County had the lowest rate in the region at 54 per 100,000 people. While there is no single reason as to why Detroit has such a high HIV rate (more than four times that of the State’s average rate) there is belief among experts, according to a recent Detroit Free Press article, that it is tied to socioeconomic factors like poverty, health care access and transportation for health care access. In Detroit, according to the most recent Census data, 57 percent of the population has public health insurance coverage and 15 percent has no health insurance. According to a recent Detroit Free Press article, the number of new people diagnosed with HIV cases Michigan has remained fairly stable since the early 2000s, but there has been an increase in the number of young African American gay and bisexual men who have been diagnosed in recent years. Additionally, of those diagnosed with HIV in the State of Michigan, about 51 percent are between the ages of 40-59 years old and 78 percent of Michigan’s population living with HIV are males.

While medical advancements are being made toward finding a cure for HIV, that has yet to occur. Rather, to control and prevent the virus from evolving into AIDS, those diagnosed need to carefully and consistently treat the disease. In Detroit, according to the Michigan Department of Health and Human Services, about 20 percent of the diagnosed HIV population goes without regular treatment. Reasons for this are not concrete but it can be speculated that it is related to income, access to health care and overall knowledge on the disease and its treatment. For example, the average lifetime cost for HIV treatment is estimated to be about $400,000 and the annual median income in Detroit is about $26,000. According to the Michigan Department of Health and Human Services those most likely to not receive consistent care in Michigan are: those between the ages of 20-29 (23 percent not receiving treatment), foreign-born individuals (32 percent), Hispanic males (25 percent) and those who inject drugs (23 percent).


Although the numbers show that those becoming infected with HIV remains a problem, funding at the State level has dropped over the years. In 2017 $19.4 million was allocated towards assisting those with HIV (medication, medical transportation and services). In Detroit, and throughout the region, there are several options for an individual to receive help. For more information, click here.

Building in Metro-Detroit Beginning to Slow

  • The State and City of Detroit’s unemployment rates decreased at the monthly and annual levels;
  • Regionally, August 2018 unemployment rates are lower than the prior year, with the exception of Macomb and Wayne counties;
  • Housing prices continue to rise in Metro-Detroit.
  • New building permits being pulled regionally decreasing

In August of 2018 the unemployment rate for the State of Michigan was 4.1, a small decrease from the July unemployment rate of 4.2, according to the most recent data provided by the Michigan Department of Technology, Management and Budget. The State unemployment rate for August of 2017 was 0.5 points above what it was in August of 2018.

The Detroit rate was 0.2 points lower in August of 2018 than in August of 2017. Also, the August 2018 unemployment rate for Detroit was 1.7 points lower than what it was the previous month (July 2017).

The chart above displays the unemployment rates for each of the seven counties in Southeastern Michigan for August of 2017 and 2018. In August of 2018 Wayne County had the highest unemployment rate at 5.3, with Monroe County having the second highest regional unemployment rate 4.5. These two counties were the only two in the region to have unemployment rates at or above 4.5 in August of 2018. Conversely, Oakland, Washtenaw and Livingston counties all had unemployment rates at or below 3.5 in August of 2018.

Regionally, Livingston County had the lowest unemployment rate in August of 2018 at 3. Livingston County also had the lowest unemployment rate in August of 2017 at 3.6 while Monroe County had the highest unemployment rate in August of 2017 at 5.7.

When comparing 2017 and 2018, Wayne and Macomb counties are the only two where the unemployment rate was higher in 2018 than in 2017. For Macomb County, in August of 2017 the unemployment rate was 3.9 and for 2018 it was 3.8. For Wayne County there was also a 1.0 difference, from 4.3 in 2017 up to 5.3 in 2018.

The above chart shows the Standard and Poor’s Case-Shiller Home Price Index for the Detroit Metropolitan Statistical Area. The index includes the price for homes that have sold but does not include the price of new home construction, condos, or homes that have been remodeled.

According to the index, the average price of single-family dwellings sold in Metro Detroit was $124,240 in July 2018; this was $510 higher than the average family dwelling price in June. The July 2018 price was an increase of $7,160 from July of 2017 and an increase of $15,070 from July of 2016, an increase of $20,900 from July of 2016 and increase of $26,110 from July of 2014.

While home prices have been growing in Southeastern Michigan, a recent Detroit News article detailed how construction is slowing down, largely in part due to land and labor shortages and the associated costs. Also according to the article, August housing permits for single-family home construction decreased by 1.8 percent statewide compared to this time last year. This 1.8 percent increase was nearly the same as it was at this time last year (from 2016 to 2017), but for 2016 that annual increase was about 10 percent, according to the article.

The chart below highlights how around 2011 the number of single family home building permits issued in each county in the region began to increase, spiking in about 2013. Then, more recently, Oakland, Wayne, Monroe and St. Clair counties experienced another increase in the number of permits pulled in 2017. However, the 2018 numbers, which are not complete for the year, do indicate that year end numbers will not compare with 2017. With only three months left in the year, and construction season slowing down for winter, it is likely many, if not all the counties in the region will not increase the annual number of building permits pulled over 2017.

Despite some regional housing growth, the Detroit News article indicated that affordable single family homes, particularly ones geared toward first-time buyers, are lacking in inventory in the region.

Wayne County Has Highest Average Payment for Food Stamps

In Southeastern Michigan, Wayne County had both the highest average payment per person for the state’s food assistance program and the highest number of both adult recipients and child recipients, according to 2018 from the Michigan Department of Health and Human Services. The Michigan Food Assistance Program is a temporary food assistance program for eligible low-income families and individuals; the program is administered through the U.S. Department of Agriculture. At the federal level this program is referred to as the Supplemental Nutrition Assistance Program (SNAP).

According to the data, thus far in 2018 Wayne County had 244,821 adult recipients of the state’s food assistance program and 178,744 child recipients. Wayne County also had the highest average food assistance payment per person at $132. Macomb County had the second highest number of recipients in 2018, according to the data. In 2018 Macomb had 62,109 adult recipients and 39,179 child recipients. However, Macomb County did not have the second highest average food assistance payment per person. Rather, Oakland County had the second highest average payment at $124. Livingston County had the lowest total of both adult and child recipients (4,449 and 2,652 respectively) and the lowest average payment per person at $119. According to the Center on Budget and Policy Priorities, the average monthly Food Assistance Program payment to Michigan residents in fiscal year 2017 was $125; Wayne County was the only county in the region above this average. Average payments are based on how close to, or below, the poverty line an individual or family are. The higher poverty level of an individual or family means they will likely receive more funding for food assistance.

The maps below further demonstrate why Wayne County had the highest number of Food Assistance Program recipients. Despite the data below being from 2016 (the state did not have data at the municipal or Census tract level and the most recent data from the Census is from 2016), the first map below highlights how Detroit, Highland Park, Inkster, Ecorse and Lincoln Park all have more than 29 percent of the cities’ households receiving food assistance. Outside of the Wayne County, the only other communities with more than 29 percent of its households on the food assistance program were Pontiac in Oakland County and Port Huron in St. Clair County.

In 2016, 42 percent of residents were on the Food Assistance Program (also known as SNAP/Food Stamps) in Detroit, with the concentrations being along some of the City’s main corridors, including Gratiot and Grand River avenues. There were more than 30 Census tracts where between 58 and 83 percent of the families living there were on the state’s food assistance program; these Census tracts were spread throughout the City. On the other hand, there were only about a dozen Census tracts in the City where 22 percent of the families living there were on the food assistance program; these Census tracts were right along the Detroit River and on the City’s northwest side.

As the data in this post shows, the State’s food assistance program is used by thousands of families in the region. With the state’s new requirement that individuals on the food assistance program must work it will be interesting to see how and if the program numbers shift.