A closer look at constitutional and statutory revenue sharing

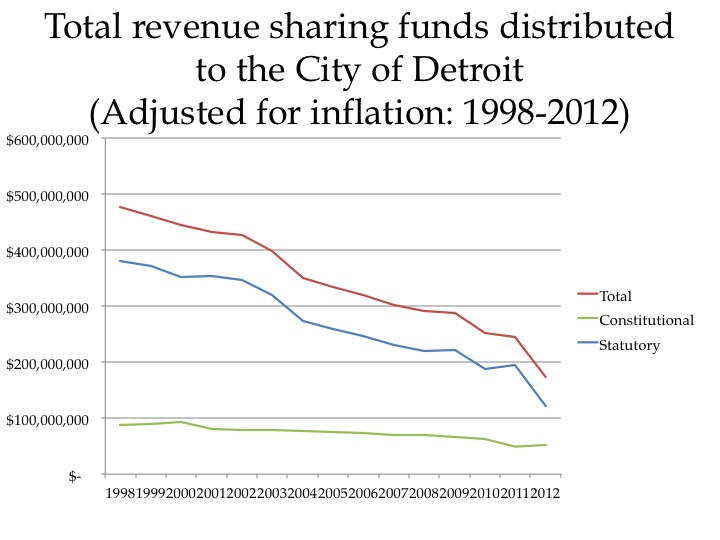
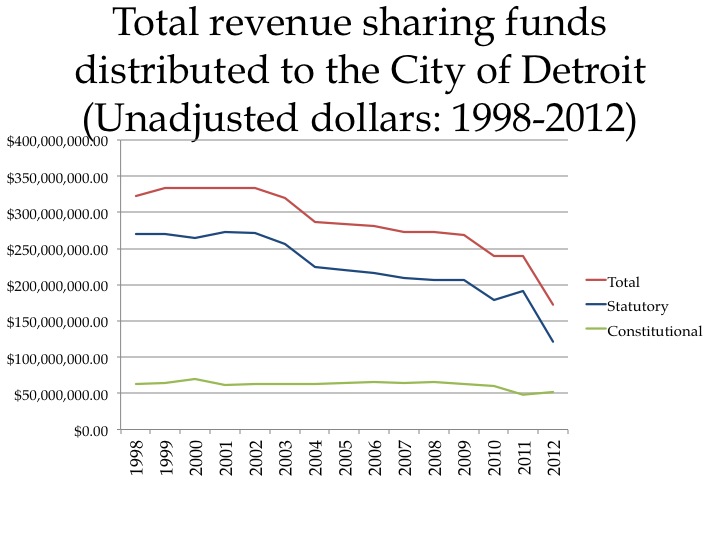
In this post, we provide examples of two communities’ constitutional and statutory revenue sharing allocations over time.  The first community is Detroit, which saw a 56.8 percent decline in total revenue sharing from FY 2002 to FY 2012, adjusted for inflation.  The second community is Macomb Township, which was one of just 13 communities–and an illustrative example–to see an increase in its total revenue sharing payment (14.5 percent).  While Macomb Township has experienced a population increase, the city of Detroit has experienced a decrease. We examine these communities’ revenue sharing allocations for five fiscal years: 2002, 2005, 2007, 2009, and 2012. For a look at the total change between 2002 and 2012, look at our previous post.

We noted in our preceding post that Michigan provides two types of revenue-sharing payments to its local governments: constitutional and statutory.  Constitutional revenue sharing is authorized and defined in the state constitution while statutory revenue sharing is authorized by legislative statute.  A key difference between these two sources is their susceptibility to change. Only constitutional amendments can change constitutional revenue-sharing formulas, whereas the state legislature can alter statutory revenue-sharing formulas at any time.

Constitutional Revenue Sharing

The chart below shows the calculation of Detroit and Macomb Township’s constitutional revenue-sharing payments for the five selected fiscal years during the 2002-2012 decade.

Slide03

This chart illustrates the two primary components of Michigan’s constitutional revenue sharing: residential population and the constitutional distribution rate.  The state determines the constitutional rate using 15 percent of gross 4-percent sales-tax collections (The other 2 percent of Michigan’s gross sales-tax collections are designated for educational purposes.). As described in a previous post, this means 15 percent of state sales tax revenue will be distributed to Michigan’s municipalities. Lower gross sales tax collections from FY 2002 from FY 2009 caused a decline in Detroit’s constitutional revenue sharing during that period. However the decline, initially due to lower gross sales tax collections (FY 2002 – FY 2009,) preceded the much steeper decline in FY 2012 due to considerable population decline reported in the 2010 Census.

The chart above also shows that Macomb Township experienced similar declines due to lower constitutional rates.  But unlike Detroit, Macomb Township’s FY 2012 constitutional revenue sharing payment was much higher (57.9 percent) than its FY 2009 payment, due to its population growth reported in the 2010 Census.   Despite the differences between the two communities, these constitutional payments changed from year to year because of population and economic changes, rather than policy changes.

The constitutional distribution rates are estimates based on dividing the total constitutional payment by the population.  For FY 2009, it is not mathematically possible for the distribution rate to be the same for Detroit and Macomb Township given their population and reported payments, which is why they are calculated estimates.

Statutory Revenue Sharing

Unlike Michigan’s constitutional revenue sharing, statutory revenue sharing formulas are subject to regular legislative modification.  As we described in our last post, the Michigan Legislature outlined a complex set of criteria to determine statutory revenue-sharing payments through 1998 PA 532.  The chart below shows how these formulas were used to determine Detroit and Macomb Township’s statutory payment in FY 2002.

Slide06

The chart reveals that Detroit’s FY 2002 statutory revenue sharing payment came exclusively from the “Percent Share of FY 98” component of the FY 1998 funding formula.  Macomb Township received its greatest statutory funding allotment under the weighted population factor distribution.  Neither community received statutory funding under the “yield equalization” component.

According to the Michigan Municipal League, the 1998 formulas were not fully implemented due to statewide budget cuts.  The House Fiscal Agency notes that the legislature made various statutory changes that superseded the 1998 formulas before they officially expired in 2007.  Key examples of these changes include statutes 2004 PA 355, 2005 PA 196, 2006 PA 437, 2007 PA 127, and 2008 PA 261; each of which prevented the respective fiscal year’s total revenue-sharing payment from exceeding the previous fiscal year’s total payment.  Furthermore, Statute 2004 PA 356 suspended revenue-sharing payments to counties.  According to the Michigan Department of Treasury, these changes required new allocation formulas for much of the period spanning FY 2004 and FY 2011.  Examples of these calculations for Detroit and Macomb Township, for three selected fiscal years, are shown below.

Slide08

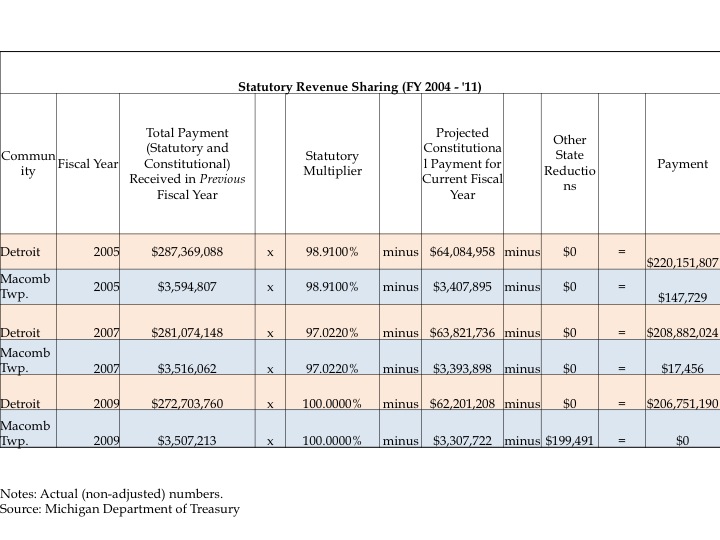
The chart above shows two key components of the new allocation formulas: the previous fiscal year’s total revenue sharing payment (including the constitutional payment,) and the statutory multiplier.  Since most statutory language during this time prevented a statutory payment increase, communities whose statutory payments declined to zero were not eligible for a statutory payment the following year.   This was the case for Macomb Township, which did not receive a statutory payment in FY 2008 and therefore received no payment in FY 2009.  The chart reveals that this requirement resulted in an effective loss of $199,491 in statutory payments for the township, as it would have received that amount otherwise.  Also, although not reflected in these charts, it is worth noting that Executive Orders 2002-22 and 2009-22 further reduced FY 2003 and FY 2010 statutory revenue sharing payments throughout the state.

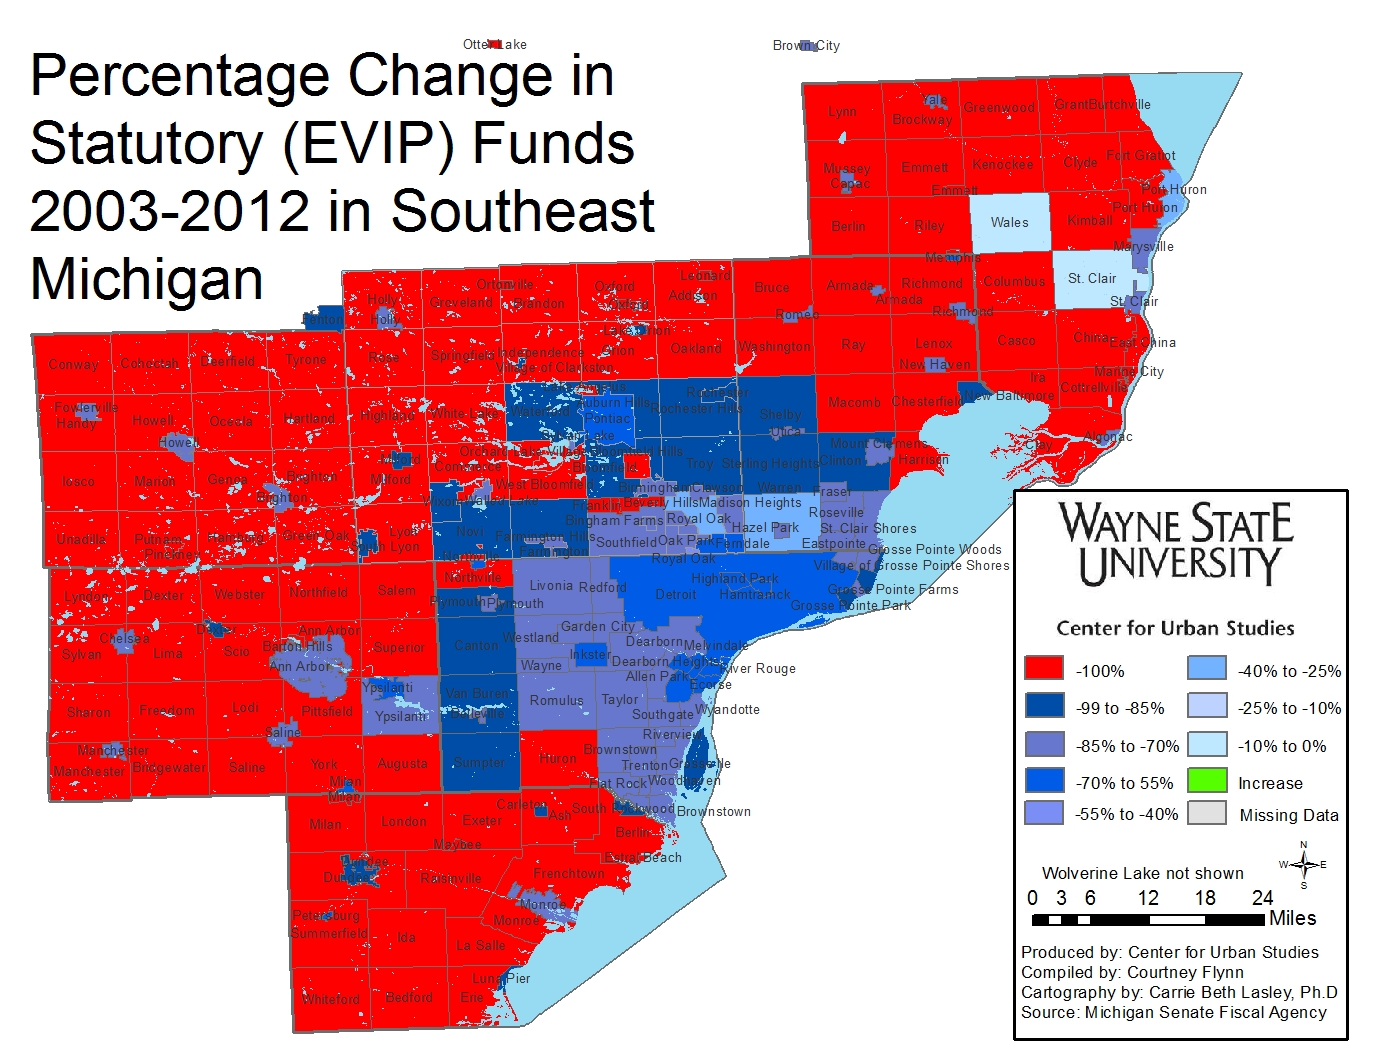
The most recent change to Michigan’s statutory revenue sharing formula is the Economic Vitality Initiative Program (EVIP).  Promulgated in Public Act 63 of 2011, EVIP replaced statutory revenue sharing and required eligible recipients to comply with certain requirements.  According to MDT, local governments that received more than $4,500 in statutory revenue sharing payments in FY 2010 become eligible for EVIP payments.  Eligible units were required to submit evidence and documentation for meeting designated requirements in the realms of: (1) accountability and transparency, (2) consolidation of services, and (3) employee compensation. Each category represents one third of the total EVIP amount available, and it is possible for a local government to receive some funds for just meeting one or two EVIP category requirements  The FY 2012 EVIP payments for Detroit and Macomb Township are shown below.

Slide10

The chart illustrates how the total amount available is calculated by multiplying the FY 2010 statutory payment by the fiscal year’s statutory EVIP distribution rate.  In FY 2012, Detroit met all three EVIP categories and received the full EVIP payment.  Macomb Township received no EVIP payments because it received no statutory payment in FY 2010, rendering it ineligible.  According to the MDT, EVIP’s enabling legislation ties EVIP eligibility to FY 2010 statutory payments.  This means communities like Macomb Township that did not receive a statutory payment in FY 2010 will continue to be ineligible for EVIP unless changes are made to the current legislation.

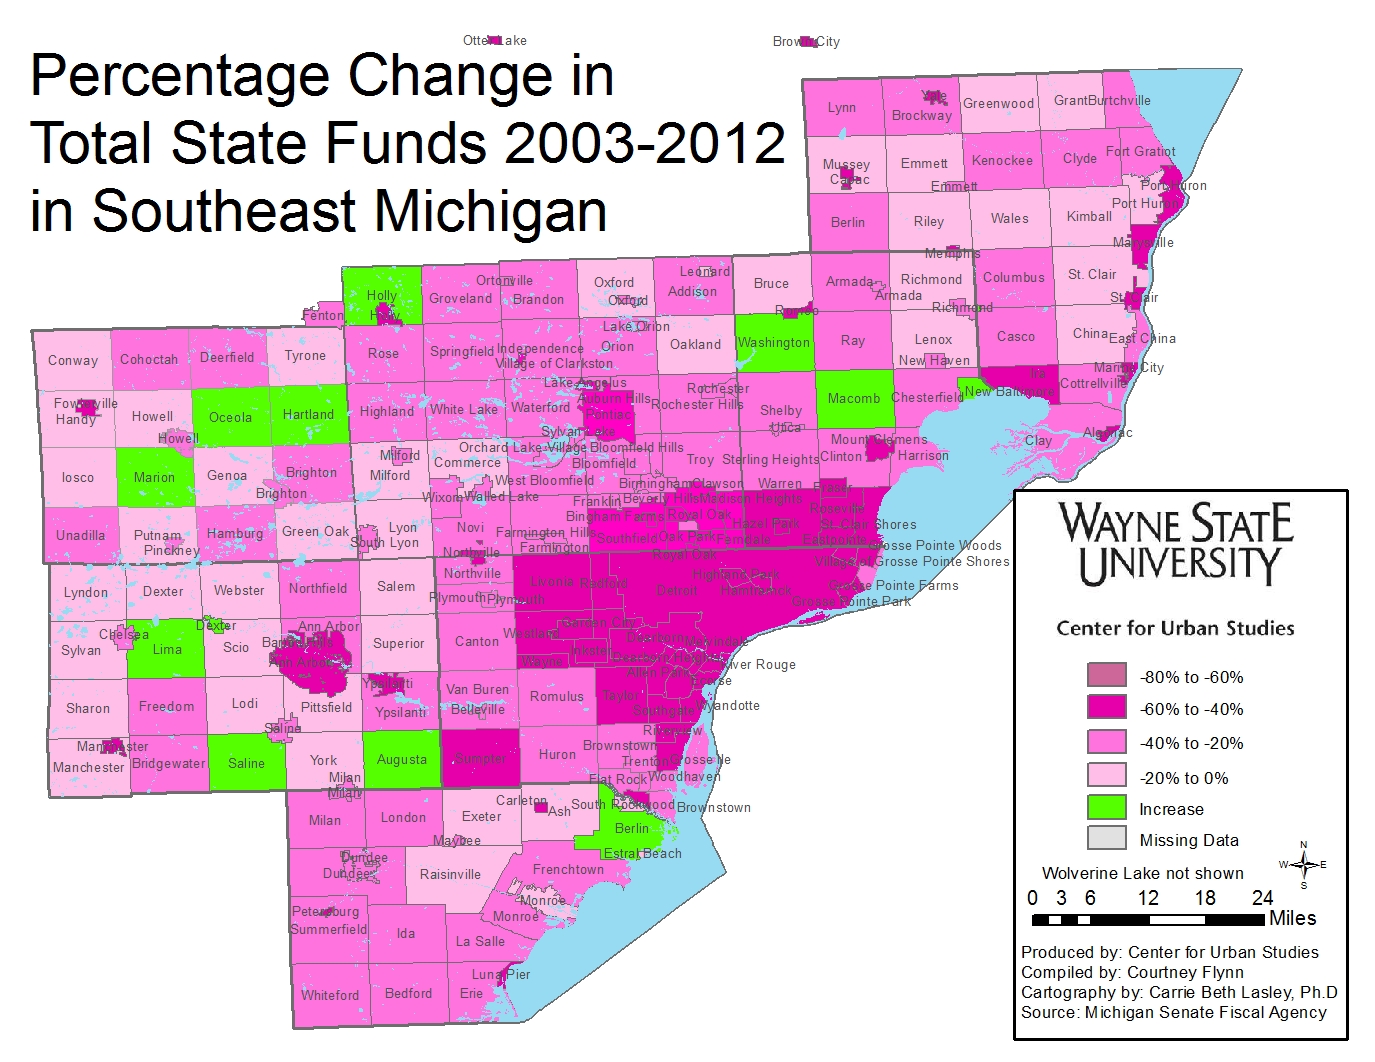
As a result of a general decline in property taxes and of these changes in revenue sharing, especially in statutory revenue sharing, many municipalities in Michigan are cutting essential services and operating with budget deficits.  The state government itself is, however, operating with a surplus. In other states, where local governments are given more latitude in adopting and adjusting local taxes, the fiscal challenges of local cities are often resolved by local increases in sales or other taxes. Given Michigan’s approach of limiting local taxes, municipal governments can do little other than cut back to resolve the revenue shortfalls resulting from declines in property taxes and state action to cut revenue sharing.  This, in effect, enforces a fiscal austerity regime analogous to those enforced by international institutions on some countries such as Greece. Politically, it reinforces the classic doctrine that local governments are “creatures of the state,” as opposed to operating in a context “home rule.” State action has, in effect, forced a class of cities into the equivalence of bankruptcy.


Population, loss of state income play role in distribution of revenue sharing funding

In the last post we examined how revenue sharing in Southeast Michigan has declined since 2003. In this post, the maps of each county show how much total revenue sharing each community in the seven-county region of Southeast Michigan received in 2012. Note that communities with higher populations (link to past population post), such as Detroit, received more funding.


The above maps show the total revenue sharing funds that municipalities in the seven-county region received in 2012. Detroit received the highest amount of funds at $175,532,461, according the Senate Fiscal Agency. Of all the municipalities in the region, Detroit also had the largest population; in 2013, it was estimated by the Southeast Council of Governments (SEMCOG) to have 681,090 residents.

There are 12 municipalities in the region that received less than a $100,000 in revenue sharing for 2012. Southfield Township in Oakland County received the lowest level of funding; it also had a population of 14,547, according to 2012 data from Munetrix; SEMCOG does not list Southfield Township. Estral Beach, a village in Monroe County, had the lowest population of all the municipalities in the region in 2012; according to SEMCOG it was 388.

As can be seen in the maps above, the counties with higher populations (Wayne, Oakland, and Macomb) received higher revenue sharing funding. This is because funding formulas are, in part, related to population.

According to the Michigan Department of Treasury, statutory /EVIP funds are  distributed based on a formula. An upcoming post with provide examples of how these formulas have worked at different points in time. For now, it will  help to know that the formula considers the following:

•Population Unit Type
•Taxable Value Per Capita
•Yield Equalization
•Percent Share of Fiscal Year ’98


Population Unit Type – According to the Citizen’s Research Council (CRC), with the population unit type formula, cities are weighted the most and villages are weighted the least; to see how population and municipality type affect funding click here.

Taxable Value per Capita – The taxable value per capita formula takes the state’s average per capita taxable value and multiplies it by a given municipality’s population, according the Michigan Department of Treasury.

Yield Equalization – The yield equalization formula is used to “create a minimum guarantee on combined state and local revenue per mill of tax levy,” according to the CRC. This number is calculated by multiplying the number of mills in a local effort by the difference between the guaranteed and actual tax levy per capita; that number is then multiplied by the population in each municipality, according to the CRC.

Percent Share of Fiscal Year ’98 – According to the Michigan Department of Treasury, the percent share of fiscal year (FY) ’98 formula takes “each City, Village and Township’s FY ’98 statutory payments (Relative Tax Effort, Per Capita, and Inventory Reimbursement) and divides it by the FY ’98 Statewide Total Distributed to determine their Percent Share Factor.”

Beginning in 2002, 60 percent of the FY ’98 were paid using this formula; the percent paid then increased by 10 percent each year, according to the Michigan Department of Treasury.

Slide11 Slide12

As we have seen in the last two posts, the amount of total revenue sharing funds distributed to municipalities across the Southeastern Michigan region has been decreasing, and Detroit is no exception. When looking at real dollars, the City of Detroit lost about $149.5 million in revenue sharing funding from 1998-2012; statutory funding represented about $148 million of that. Adjusting the number to account for inflation, using 1998 dollars as a base, Detroit lost about $304 million in total revenue sharing funding from 1998-2012, of which statutory funding represented approximately $255 million.


Up until 1998, the Relative Tax Effort (RTE), which was enacted in 1971, was intended to help monies follow communities’ needs, according to the CRC. However, there were complaints that cities fared better from the RTE than did townships and villages. This is why in 1998 an amendment was made to change how statutory funds were distributed. This amendment, which the formulas above reflect, shifted from distributing statutory funds based on intangibles, income, and small business taxes to providing 21.3% of sales tax revenues at the 4% tax rate, according to the CRC. Also, in 1998 then Gov. John Engler and Detroit Mayor Dennis Archer made a deal that the city would receive $333.9 million in annual revenue sharing funds if the city would decrease its city income tax rate, according to a Detroit Free Press Article and a Bridge Magazine report. Only a few years after the deal was made the state began to cut revenue sharing fund distributions, across the board. Since then Detroit has decreased its city income tax but has also not received the $333.9 million a year it was guaranteed.

In next week’s post we will provide examples of  how the statutory revenue sharing formula has changed from 2002-2012 and how it has been beneficial to one community and detrimental to another.


Loss in revenue sharing plagues Southeast Michigan

In Michigan, cities, townships, villages, and other municipalities cannot levy their own sales taxes.  Only the state government collects and levies sales taxes.  In fact Detroit asked permission to levy a 1% sales tax as it descended into bankruptcy—the State Legislature said, “no.” The rationale for this centralized system of sales tax is that having lots of different sales tax rates is confusing to consumers, imposes a burden on businesses, and can lead to unhealthy competition among municipalities. There are other states that permit municipalities to create their own sales taxes (e.g., Missouri), and this leads to situations in which the same product is taxed at a different level depending on whether it is purchased in City “A” or an adjoining Township “B” a few blocks away.

The argument  that has prevailed in Michigan is that it makes sense for the State to establish one sales tax rate, collect the tax revenue, and then “share” it with municipalities and other units of government in the state. But this system relies on the premise that the State of Michigan will be an honest broker and share the revenue equitably, responsibly, and reliably. This assumption has been challenged in recent years.

There are two categories of revenue sharing in Michigan—constitutionally mandated and statutory revenue sharing. The latter is based on laws that the legislature can alter; the former is more securely enshrined in the state constitution. But even constitutional revenue sharing can decrease when overall revenue declines, as it tends to during recessions, or when the population of a municipality declines. As we see below, in recent years the State of Michigan has stopped sharing as much revenue as it had historically. Some observers argue that in recent years the State of Michigan balanced its budget on the backs of municipalities throughout the state by taking the lion’s share of the revenue raised from the sales taxes. Additionally, components of the revenue sharing formula change as different political parties seek to provide more revenue to districts represented by legislators from that political party as they try to protect the interests of their constituents.

In the past decade the Southeastern Michigan has been on the losing end of the “revenue sharing” arrangements. Since 2003 the region has experienced a 47.8 percent decrease in combined revenue sharing- constitutional and non-constitutional-, according to the Michigan Senate Fiscal Agency.

There are 231 municipalities that make up the seven-county Southeast Michigan region (Wayne, Oakland, Macomb, St. Clair, Monroe, Livingston and Washtenaw), and of those only 13 did not experience a loss in revenue sharing. These communities are: Macomb Township, Washington Township, New Baltimore, Berlin Township, Holy Township, Augusta Township, Lima Township, Saline Township, the Village of Dexter, Conway Township, Hartland Township, Oceola Township, and Marion Township.  In contrast, 147 of the 231 municipalities in the region experienced a decrease in revenue sharing of 25 percent or more between fiscal years 2003 and 2012. Highland Park experienced the largest decrease in revenue sharing, at 57.17 percent. The City of Detroit was close behind, losing 56.76 percent of its total revenue sharing funding from the state between 2003 and 2012.

Since the 1930s municipalities in the State of Michigan have received revenue sharing payments from the state government (See attached “A Little Bit of History” at the end of this post.). The distribution of these funds has changed, however, over the years, most recently during the 2011-12 fiscal year and especially for non-constitutional funding, formerly called “statutory revenue sharing.”  In 2007, a formula was created that included an annual budget bill boilerplate, according to Michigan in Brief. “Statutory revenue sharing” was renamed the Economic Vitality Incentive Program (EVIP) in the 2011-12 fiscal year. In order to earn EVIP funds, municipalities must meet requirements set forth by the state related to transparency, coordination of services, and employment compensation, according to the Michigan Senate Fiscal Agency.

While the EVIP funding now depends on a community’s willingness, and ability, to comply with those requirements, there are no such stipulations for the constitutional funding provided to such communities. Michigan’s sales tax rate is 6% and of, that two percent goes to the school aid fund. Fifteen percent of the remaining 4 percent in sales tax revenue is “shared” with the municipalities on a per capita basis. The U.S. Census population figure used by the state is adjusted so that 50% of the institutional population (e.g., prisoners) is removed from the population count, according to the Michigan Senate Fiscal Agency. After the release of Census data, each municipality’s constitutional revenue sharing percentage is adjusted based on its new population figure. For example, following the release of 2010 Census data, Macomb Township, which had an increase in population, also experienced an increase in revenue sharing funding. The City of Detroit which experienced population loss, then also had a decrease in revenue sharing.

The percent change numbers shown in these posts present both the 2003 and 2012 data adjusted to the 2012 Consumer Price Index (CPI).

The “actual” revenue sharing numbers for 2003-2011 are adjusted for inflation using the 2012 chained Consumer Price Index (CPI) published by the U.S. Department of Labor–the most recent year for which an annual CPI is available.  Each year’s revenue sharing allotment is therefore raised to 2012 dollars using standard CPI adjustment formulas such as those used by the Health Economics Resource Center.  This approach, verified using the Department of Labor’s inflation calculator, treats all values as 2012 dollars and reveals a more complete picture of revenue sharing changes over time.

Over the next two weeks, Drawing Detroit is displaying maps showing the following:

  • the percent change in total revenue sharing for each municipality in Southeast Michigan between 2003-2012;
  • the percent change in statutory funding;
  • the percent change in total funding;
  • the per capita revenue expenditures for each municipality; and

the amount of total revenue sharing funds provided to each community in 2012.

Slide2 Slide3

The above two charts show the total amount of revenue sharing funds distributed to the Southeast Michigan region from 2003 to 2012. The first chart shows the inflation adjusted amount of funds distributed each year and the second chart shows the amount of real dollars distributed. Both charts show that while constitutional revenue sharing has remained fairly steady since 2003 there has been a decrease in the amount of statutory, or non-constitutional, revenue sharing funds distributed.

The above map demonstrates the percent change in constitutional revenue sharing funds from 2003-12 (CPI adjusted). Detroit lost 35.2 percent of its constitutional funding in that time; Royal Oak Township lost 61.5 and Ira Township lost 36 percent. While the map shows that majority of the municipalities that make up Southeast Michigan experienced a decrease in constitutional revenue sharing funds; there were 38 municipalities with a percent increase in constitutional funding. Dexter Township experienced the highest percent increase at 50.2 percent; New Baltimore came in next at 41 percent.

None of the municipalities that make up Southeast Michigan experienced a percent increase in statutory, now known as Economic Vitality Incentive Program, funding from 2003-2012. As noted earlier, there were changes in the way statutory funds were earmarked and distributed in 2007 and 2011. There were 121 municipalities that did not receive in EVIP funding in 2012. A community is not provided their portion of EVIP funding if they do meet requirements related to transparency, coordination of services, and employment compensation set forth by the state.

Highland Park lost 57.17 percent of its total revenue sharing (CPI adjusted) from 2003 to 2012 and the City of Detroit is a close second losing 56.8. In total, the entire region experienced a loss of 47.7 percent of revenue sharing. According to information provided by the Michigan Senate Fiscal Agency, only 11 municipalities experienced a percent increase during that time period.

The above map shows per capita revenue expenditures for Southeastern Michigan in 2012. Detroit’s per capita revenue spending was $245.9, which was the  second highest in the region. Harrison Township had the highest per capita revenue expenditures in the region at $315.8. The Village of Dexter had the lowest at $49.1 per capita. Data for Livingston County were not available because of the federal government shutdown.

In next week’s post, we will take a more in-depth look at the loss of revenue sharing in Detroit from 1998 to 2012. Also, a map for each county will show the actual amount of total revenue sharing each municipality received in 2012.

A Little Bit of History:

In 1933 the State of Michigan began collecting funds by taxing establishments that served liquor. Of those funds collected, 85 percent of it was returned the municipalities in the state, according to the Michigan Municipal League (MML). Six years later, in 1939, the state shared portions of the new state intangibles tax—formerly a source of local funding—with cities, villages, and townships; the portion that was removed was the intangible property tax. Then, in 1946, portions of Michigan’s sales tax were earmarked for local government funding. Such funding operations continued until 1963, when a change in the state constitution guaranteed one-eighth of the funds garnered from sales taxes would be devoted to local governments, according to the MML.

In 1972, Public Act 212 tied the relative tax efforts (RTEs) of cities, villages, and townships to the portion of state income tax revenues they received, according to Michigan in Brief. The RTE compares a municipality’s property, income, and excise taxes to that average of all municipalities within the state. This change in statutory funding was to put more focus on a municipality’s needs-beyond population-because different municipalities may need different public services but have different revenue-raising abilities beyond those based on population, according to Michigan in Brief.  Then, in 1974 the amount of tax revenue earmarked for constitutional revenue sharing increased from one-eighth to one-fifth of the funds brought in each year. This was after citizens in the state voted to have food and drugs exempted from the sales tax. A year later, other changes occurred, again focused toward statutory revenue sharing because whatever the full amount of constitutional revenue sharing calculated by the Michigan Legislature each year must be distributed. Not only was the Small Business Tax enacted, where portions of it were received  each year by local governments and included in RTE, but also counties were only given 35 percent of income tax distribution, as opposed to 50 percent previously given to them, and municipalities were given 65 percent.

Aside from some statutory revenue sharing payment reductions in the 1980s and 1990s because of state budget problems, the distribution of revenue sharing funds remained steady. Then, Public Act 342 of 1996 was enacted and the following changes occurred for statutory revenue sharing:

  • The amount of funding each community received under the RTE funding was capped at the 1996-97 fiscal year level. If there was a growth in a revenue source it was to be distributed on a per capita basis;
  • A bi-partisan task force was created and was charged with recommending various sources and distribution methods for revenue sharing in the future. If the task force stalled before funds were to be distributed, municipalities would receive the same funding from the year before and, if they were to receive additional monies, it would be put into a reserve fund until actions were taken.
  • Sales and small business taxes were removed as sources of revenue sharing funds; additional sales tax revenue replaced this.

(According to Michigan in Brief)

Then, in 1998, Public Act 532 was enacted so a new formula could be phased in over a 10 year period. Part of this formula called for 23.1 percent of sales tax revenue to be distributed to municipalities. However, because of budget deficits and funding shortfalls, the 1998 formula has yet to be fully implemented for statutory funding, according the MML. According to the Michigan Department of Treasury though, 21.3% of the 4% gross collections of the state sales is currently distributed to Michigan municipalities for statutory funding.

Detroit area experiences employment increase

  • Detroit’s unemployment rate experienced a decrease in the month of August, dropping to 17.7 percent; (monthly)
  • The overall number of people who work within the Detroit Metropolitan borders (both residents and non-residents of the City of Detroit) continued to increase throughout August; (monthly)
  • There was also an increase in employment for the auto and auto part manufacturing industries in the Detroit Metropolitan Statistical Area during the month of August; (monthly)
  • The Purchasing Manager’s Index for Southeast Michigan increased from July 2013 to August 2013; (monthly)
  • The Commodity Price Index experienced a slight increase from July 2013 to August 2013 for Southeast Michigan; (monthly)
  • Standard and Poor’s Case-Shiller Index show that the prices of homes in the Detroit area continue to increase each month; (monthly)
  • The number of building permits obtained in Wayne and Oakland Counties increased from July 2013 to August 2013; (monthly).

Slide02

According to the most recent data provided by the Michigan Department of Technology, Management and Budget, there was a 0.7 percent decrease in the unemployment rate for the State of Michigan, falling from 9.7 percent in July 2013  to 9 percent in August 2013. For the City of Detroit, the unemployment rate also decreased, from 18.9 percent percent in July 2013 to 17.7 percent in August 2013.

Slide04

In August 2013, there were 288,224 people (both residents and non-residents) employed in the City of Detroit.  This was an increase of 3,085 people from the number of people (both residents and non-residents) employed in the City of Detroit in July 2013.

Slide06

The above chart shows the number of people employed in the auto and auto part manufacturing industries in the Detroit Metropolitan Statistical Area (MSA) increased from August 2012 to August 2013. The number of auto manufacturing employees in the area increased by 5,400 from July 2013 to August 2013.

Slide08

The Purchasing Manger’s Index (PMI) is a composite index derived from five indicators of economic activity: new orders, production, employment, supplier deliveries, and inventories. A PMI above 50 means the economy is expanding.

According to the most recent data released on Southeast Michigan’s Purchasing Manager’s Index, there was an increase of 7.1 points from July 2013 to August 2013. In August 2013, a PMI of 60.2 was recorded which is reflective of an increase in production activity and new orders.

Slide10

The Commodity Price Index, which is a weighted average of selected commodity prices, was recorded at 55.6 in August 2013, which was 0.8 higher than the previous month.

Slide12Slide13

The Consumer Price Index measures the change in prices in a fixed market. The index is based on prices of “food, clothing, shelter, fuels, transportation fares, charges for doctors’ and dentists’ services, drugs, and the other goods and services that people buy for day-to-day living,” according to the Bureau of Labor Statistics.

The above graphs show the percent change in the price index measurements. The first graph shows there was a 0.7 percent decrease in the overall Consumer Price Index from June to August 2013 in the Detroit-Ann Arbor-Flint area. According to the Bureau of Labor Statistics, this is mainly based on the fact that energy costs decreased by 8.4 percent over the two month time period.

For the Consumer Price Index Less Food and Energy, there was a 0.3 percent increase in the index from April to June 2013 because of higher prices for apparel, medical care, education and communication.

Slide15Slide16

The above charts show the Standard and Poor’s Case Shiller Home Price Index for the Detroit Metropolitan Statistical Area. The index includes the price for homes that have sold but does not include the price of new home construction, condos, or homes that have been remodeled.

According to the index, the average price of single-family dwellings sold in Metro Detroit was $90,080 in August 2013. This was an increase of approximately $13,600 from the average price in August 2012.

Unlike the Home Price Index, the annual percent change in the Home Price Index showed a slight decrease since April. Between July 2012 and July 2013, there was a 16.9 percent increase in home prices for the Detroit MSA.

Slide18Slide19Slide20

The above charts show the number of residential building permits obtained each month in Wayne, Oakland, and Macomb counties from January 2012 until August 2013. These numbers are reported by local municipalities to the Southeastern Michigan Council of Governments and include single family, two family, attached condo, and multi-family units.

Of the three counties examined, Macomb County was the only county that did not experience an increase in the number of permits obtained from July to August in 2013; rather, the number of permits decreased by 7. The number obtained in Wayne County increased by 36 from July to August 2013 and the number for Oakland County increased by 67 for the same time period.

When comparing the number of permits obtained in August 2012 versus August 2013 for these three counties, Macomb County was again the only one to show a decrease. The decrease was minimal though. In August 2012, 150 building permits were obtained and in August 2013, 147 were obtained.  In Wayne County there was an increase from 81 to 109, respectively. For Oakland County, 158 building permits were obtained in August of 2012 and 254 were obtained a year later.

Highest Arab, Hispanic populations found in Wayne County

For this post another look at the population makeup of Southeastern Michigan is examined, this time by ethnicity. The maps below show that majority of the ethnic groups examined in this post-Arab and Hispanics or Latinos-were located in Wayne County, particularly in and around Detroit, as of 2011. It is important to note, however, that there was a presence of these ethnic groups throughout the seven-county region too. The only other areas with a high a percentage of these ethnic groups beyond the Detroit-Dearborn area was Pontiac in Oakland County and Sterling Heights in Macomb County.

The information shown throughout this post was obtained from the 2011 American Community Survey, based on five year estimates.

Slide03Slide04Slide05Slide06Slide07

Slide08

The Arab population in the seven county region was heavily concentrated in Dearborn in 2011, which is in Wayne County. According to the American Community Survey, about 40 percent of the Dearborn population was of Arab ancestry; in Wayne County 4.2 percent of the population are of Arab ancestry. When taking a closer look at the Dearborn population, it can be seen that those with a Lebanese ancestry made up a large portion of the population in northeast Dearborn, as did those with an unclassified ancestry and an “other” Arab ancestry. There was also a smaller presence of Syrians and Armenians throughout the area.

A similar concentration of Arabs could also be found in Hamtramck in 2011. According to the Hamtramck Ethnic Enclaves map, the Arab population within the city is more concentrated in the eastern half. Other ethnic groups present in Hamtramck include those of Bangladeshi, Yugoslavian and Polish decent.

In Sterling Heights, those with a Chaldean, Iraqi and Lebanese decent made majority of the city’s Arab population. About 43 percent of the city’s population is foreign born.

While the above mentioned cities had relatively high concentrations of Arabs as of 2011, there was also a smaller concentration of Arabs (5-20 percent) around Sterling Heights, the Farmington Hills-West Bloomfield areas in Oakland County, and the Wayne and Washtenaw County borders

SEMichHispanic2011-1

Slide11

Slide12

Slide13

For the Hispanic-Latino ethnic group, Southwest Detroit had the heaviest concentration, where this group represented about 47 percent. A closer look at the Hispanic population in Southwest Detroit shows that majority of the Hispanic residents were of Mexican decent, as of 2011; those of Spanish decent were the least represented.

In Pontiac, there were areas where over 25 percent of the population is of a Hispanic or Latino background.

People of Hispanic or Latino decent were widely distributed across the region. Outside of Detroit, a few Downriver communities and portions of Pontiac, Hispanic or Latino residents appeared to represent between 0 and 10 percent of an area’s population.