Oakland, Washtenaw Counties Have Highest Foreign-Born Populations in Southeastern Michigan

Of the four major counties in Southeastern Michigan, both Oakland and Washtenaw counties had the highest percentage of foreign-born populations in 2015, according to the American Community Survey. Oakland County ranked just above Washtenaw County though; the foreign born population percentage in Oakland County was 11.8 percent and in Washtenaw County it was 11.6 percent. In Oakland County there are three municipalities where more than 20.1 percent of the population was foreign born in 2015, while in Oakland County there was only one municipality.

Of all the municipalities in the region though it was Hamtramck with the highest percentage of foreign-born residents at 46.6 percent.

The U.S. Census Bureau defines a foreign-born person as “anyone who was not a U.S. citizen at birth. This includes respondents who indicated they were a U.S. citizen by naturalization or not a U.S. citizen. Persons born abroad of American parents or born in Puerto Rico or other U.S. Island Areas are not considered foreign born.”

Slide03 Slide04

In Macomb County in 2015, 10.6 percent of the population was foreign-born, with the city of Sterling Heights having the largest foreign-born population. In Sterling Heights 25.8 percent of the population was foreign-born; this is equivalent to 33,598 people in the city. Of those residents, 58.7 percent were naturalized U.S. citizens and the remainder (41.7%) were not U.S. citizens.

Aside from Sterling Heights, Warren and Shelby Township had amongst the highest foreign-born populations at 12.1 percent and 13.5 percent, respectively.

All of northern and eastern Macomb County had less than 5 percent foreign-born populations.

Slide06

In Oakland County, it was the western side of the county where majority of the municipalities had less than 5 percent of their populations made up of foreign-born residents. The city of Troy had the highest percentage of foreign-born residents in Oakland County at 25.8 percent, followed by West Bloomfield Township at 20.9 percent and Novi at 20.8 percent.

In Troy, 52 percent of the foreign-born residents were naturalized U.S. citizens and the remainder were not U.S. citizens. Between Troy, Novi and West Bloomfield Township, Novi had the highest percentage of non-U.S. citizens at 55 percent.

Slide08

In Washtenaw County, Ann Arbor Township had the highest percentage foreign-born residents at 21.8 percent. This percentage was the equivalent to about 971 people in the charter township. Of these people, 49 percent were naturalized U.S. citizens and the remainder were not U.S. citizens. The city of Ann Arbor and Pittsfield Township followed Ann Arbor Township in terms of foreign-born populations. The percentage of foreign-born residents residing in Ann Arbor was 17.9 percent and in Pittsfield Township was 18. percent. These percentages were equivalent to 20,762 foreign-born residents in Ann Arbor and 6,753 in Pittsfield Township.

Slide10

In Wayne County, Dearborn and Hamtramck had the highest percentage of foreign-born residents at 26.4 percent and 46.6 percent, respectively. In Dearborn, of the 25,410 foreign-born residents 65 percent were naturalized citizens. In Hamtramck, of the 9,589 foreign-born residents, 45 were naturalized U.S. residents.

In Detroit, the foreign-born population made up about 37,000 residents but was equivalent to 5.1 percent of the population.

Slide12

Detroit 30-Year Mortgage Rates Below National Average

  • The average 30-year mortgage interest rate in Detroit is lower than the national average (weekly);
  • The Standard and Poor’s Case-Shiller Home Price Index for the Detroit Metropolitan Statistical Area shows home prices continue to increase monthly and annually.
  • The unemployment rate increased at the State and local level(monthly);
  • Regionally, Washtenaw County’s unemployment rate remained the lowest;
  • The Purchasing Manager’s Index for Southeastern Michigan dropped below 50 but is expected to increase (monthly);
  • The Commodity Price Index dropped to its lowest point in over a year (monthly);

Slide03

On March 15, 2017 the Federal Reserve Raised the federal interest rate by .25 percent; it now ranges between .75 and 1 percent. This is the third time the rate has been raised since the financial crisis. Prior to last week rates were raised once in 2015 and once in 2016. The rate increase has been attributed to strong job growth, more investment from businesses into operations and a higher rate of consumer spending.

This rate increase will impact credit products, such as mortgages and auto loans, in addition to savings, home equity lines of credit and credit cards. Another item that may be affected is new home starts, a statistic that is not readily available through the Southeastern Michigan Council of Governments website, as it once was.

Above are three average 30-year mortgage interest rates at the national, state and local levels. These rates were provided by bankrate.com, which does a national survey of large lenders on a weekly basis. As a 30-year fixed rate mortgage is the most traditional type of home financing this was chosen to show the rate differences. The State of Michigan had the lowest average interest rate for the week of March 16 at 4.14 percent and the national average was the highest of the three at 4.44 percent. Detroit’s average 30-year fixed mortgage interest rate was 4.42 percent, which according to bankrate.com is an increase from the previous week. According to bankrate.com, Detroit’s rate for an average 30-year fixed mortgage rate in the Detroit area is equivalent to about an additional $4.50 a month on a mortgage for $165,000. Such an increase brings the average monthly payment to about $819.

Slide05

The above charts show the Standard and Poor’s Case-Shiller Home Price Index for the Detroit Metropolitan Statistical Area. The index includes the price for homes that have sold but does not include the price of new home construction, condos, or homes that have been remodeled.

According to the index, the average price of single-family dwellings sold in Metro Detroit was $109,790 in October 2016. This was an increase from $6,520 from October of 2015 and an increase from $11,570 from October of 2014.

**This information has not been updated since December of 2016. It was presented in a previous post, however due to the relation to the information above we are republishing it.**

Slide07

According to the most recent data provided by the Michigan Department of Technology, Management and Budget, the unemployment rate for the State of Michigan slightly increased to 5.2 in January of 2017 from 5 the previous month. Detroit, however, had a big increase. Unemployment in the City of Detroit increased from to 9.8 in December to 12.3 in January. The January unemployment rate for Detroit in 2017 was 1.2 points higher than it was the previous year at that time.

Slide09

The chart above displays the unemployment rates for each of the seven counties in Southeastern Michigan for January of 2016 and 2017. For 2017, St. Clair County had the highest rate at 7.7 while Washtenaw County had the lowest at 3.4. St. Clair and Wayne counties were the only two in the region with unemployment rates above 7 in January. Four of the seven counties (Livingston, Monroe, Oakland and Washtenaw) all had unemployment rates at or below 5.

While in 2016 St. Clair County again had the highest unemployment rate for the month of January, regionally, and Washtenaw County had the lowest, it is interesting to note that unemployment rates were higher across all counties in 2017. Wayne County had the largest difference between 2016 and 2017 at 1 point; the unemployment rate was 6.2 in 2016 and 7.2 in 2017.

Slide11


The Purchasing Manger’s Index (PMI) is a composite index derived from five indicators of economic activity: new orders, production, employment, supplier deliveries, and inventories. A PMI above 50 indicates the economy is expanding.

According to the most recent data released on Southeast Michigan’s Manager’s Index, the PMI for December 2016 was 53.3, a significant drop from an index of 61.9 the prior month. History shows though that January traditionally has a lower PMI readings and it is expected to increase for February.

Slide13

The January 2017 Commodity Price Index dropped to the lowest it has been since September of 2015. At that time the Commodity Price Index was 41.2 and this most recent reading was 41.7. There is speculation from the Institute of Supply Management-Southeastern Michigan that this drop could reflect policy changes from the new federal administration, especially as gas and oil prices are up.

How Immigrants Impact Michigan’s Economy

With about 6.5 percent of Michigan’s population being comprised of foreign-born residents (an increase from 3.8 percent in 1990) their contribution to the economy is evident. From running their own businesses and employing non-foreign born residents to filling in gaps in the work force, a 2016 study by New American Economy shows just how much the immigrant population in the state contributes to the overall economy.

According to the Census Bureau, about 6.5 percent of Michigan’s population is made up of immigrants. Of that population, those that come from Asia make up majority of the foreign-born population at 50.7 percent and those that come from Northern America (Canada, Mexico, Caribbean) made up one of the smallest segments of the population at 5.3 percent (Oceana made up .5 percent).

Untitled

As shown in the infographic, of Michigan’s immigrant population, 30,086 of them were self-employed in 2014, and 8.3 percent of the immigrant population were entrepreneurs. Additionally, 15,780 Michigan residents were employed by immigrant owned firms and $608.4 billion of income was generated by immigrant businesses, according to the 2016 New American Economy report “The Contributions of New Americans in Michigan.”

ImmigrantImage

Through immigrant population employment, in 2014 there was about $20 billion in income generated and $5.4 million in taxes generated (total-combined federal and state). Asian immigrants contributed the most in income and taxes, according to the report. In 2014 Asian immigrants generated $7.6 billion in income and $2.2 billion in taxes ($574.9 million went to state and local taxes), the Middle Eastern and Northern African population generated $2.8 billion in income and $753.5 million in taxes ($213.1 million went to state and local taxes), the Hispanic population generated $2 billion in income and $473.6 million in taxes ($167.5 million went to state and local taxes) and the Sub-Saharan Africa population generated $548.5 million in income and $139.5 million in taxes ($44.9 million went to state and local taxes), according to the report. Not only did Michigan’s immigrant population contribute to federal and local taxes, but also to entitlement programs. In 2014, Michigan’s immigrant population contributed $507.5 million to Medicare and $1.9 billion to social security.

According to the report, 30 percent of Michigan’s doctors, 9,150 people, were foreign born. Software developers came in second at 28 percent (7,474 workers), followed by farm workers (27%-7,762), post-secondary teachers (22%-12,880), mechanical engineers (22%-10,502), packers and packagers (17%-3,507), computer systems analysts (22%-3,152) and food-service managers (14%-5,310). In total, the percent of immigrant workers employed in a Science, Technology, Engineering and/or Mathematic (STEM) field was 15.3 percent, according to the New American Economy report. The report also points out how there is a shortage of STEM workers in the state, with 10 jobs being available for every one employable worker.

The information presented in this post provides a broad economic overview on the contributions of Michigan’s immigrant population. To learn more about these contributions on everything from how Michigan’s student immigrant population plays a role in the economy to how age plays a factor in economic growth for the foreign-born and non-foreign born populations, please read the whole report here.

Source: http://www.renewoureconomy.org/wp-content/uploads/2016/10/nae-mi-report.pdf

Economic Growth Slow for Southeastern Michigan Counties

According to four performance indicators, identified by the National Association of Counties (NACO), Southeastern Michigan has yet to fully recover from the recession. There are counties though, that are faring better than others, regionally. For example, Washtenaw County has recovered beyond it’s pre-recession peak recovery on all four performance indicators, while Wayne County has only overcome one of those peaks.

The four indicators NACO uses to determine county economic growth are:

  •   Unemployment Rate
  •   Job Growth (total number of jobs available)
  •   Economic output growth (Gross Domestic Product)
  •   Median Home Value Growth

To determine if there has been growth NACO first graphed annual values from 2002 to 2016 indicating which year between those two was the pre-recession peak (Or nadir, in the case of unemployment). If the 2016 value had not reached the pre-recession peak, which was typically 2005 for majority of the indicators for Southeastern Michigan, NACO deemed there to be no recovery in that area for that county.

Overall, the data shows that economic output recovery and median home values have been the slowest recovery throughout the region. Four the seven Southeastern Michigan counties have yet to experience pre-recession GDP values (adjusted for inflation) and two of the seven have yet to experience median home value recovery. All of the counties have had their unemployment rates drop to pre-recession numbers, or less.

Living

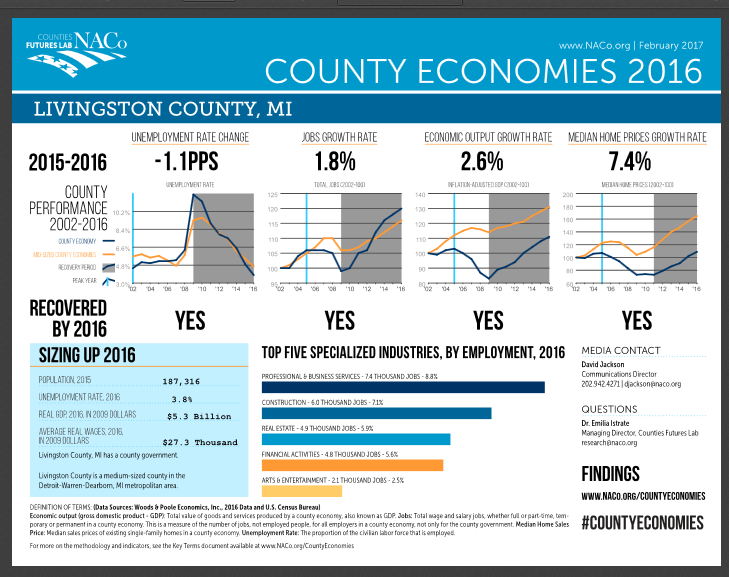
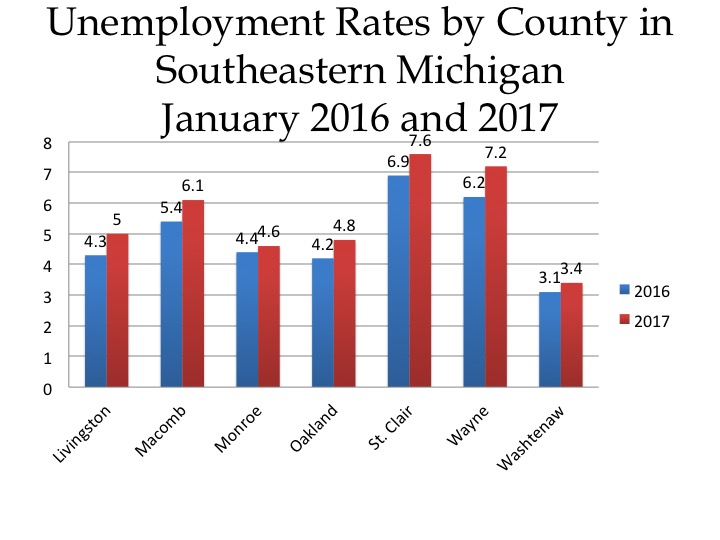
According to NACO, Livingston County ranked in the highest section for economic recovery due to the fact that indicators showed job, unemployment, gross domestic product and home price recovery rates in 2016. For the total number of jobs available Livingston County’s pre-recession peak was in 2005, as was its GDP and median home price value. All three of these increased by 2016. The data also shows that between 2015 and 2016 the county’s unemployment rate dropped to 3.8 percent, which was a 1.1 percent decline from the previous year. Livingston County’s job growth rate increased by 1.8 percent, its economic output growth rate increased by 2.6 percent and its median home prices grew by 7.4 percent between 2015 and 2016.

The image below shows that Livingston County’s economic indicators have been showing signs of a stronger economy, however its economic output growth rate and its median home prices growth rate both fall below that of the average mid-sized county economies’.

None the less, there is job growth in Livingston County and the top five specialized industries in the county in 2016 were:

  •   Professional and business services
  •   Construction
  •   Real Estate
  •   Financial activities
  •   and Arts and Entertainment

Macomb

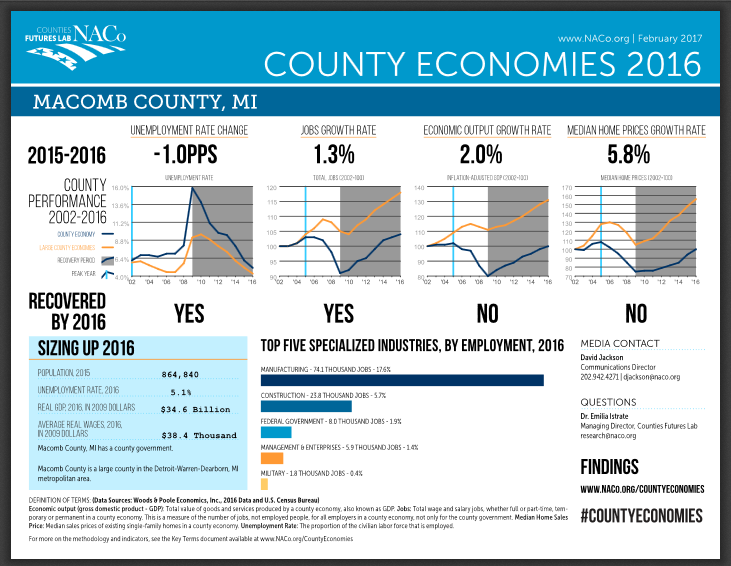
Macomb County has only recovered in two of four performance areas to its pre-recession peaks, according to NACO. One of those two areas that experienced recovery is in job growth; the pre-recession peak was in 2005 and recovery began in 2009, and has continued to climb. Additionally, the unemployment rate was at 5.1 percent in 2016 is below the county’s 2002 pre-recession low point of 6.4 percent. The GDP peaked in 2005 by 2016 it had yet to climb back to the inflation adjusted number; however the county has experienced a steady increase since the 2009 low point. Median home values also have yet to reach the pre-recession peak in Macomb County, which was in 2005.

Between 2015 and 2016 Macomb County had a job growth rate of 1.3 percent, an economic output growth rate of 2 percent and a median home prices growth rate of 5.8 percent. Also, between 2015-16 the unemployment rate dropped 1 percent to 5.1 percent. While there has been economic growth in Macomb County, a look at the charts show that it has been slow and it remains below that of other large counties across the country.

With a job growth rate at 1.3 percent between 2015-16, the top five specialized industries in Macomb County by employment are:

  •   Manufacturing
  •   Construction
  •   Federal Government
  •   Management and Enterprises
  •   Military

Monroe

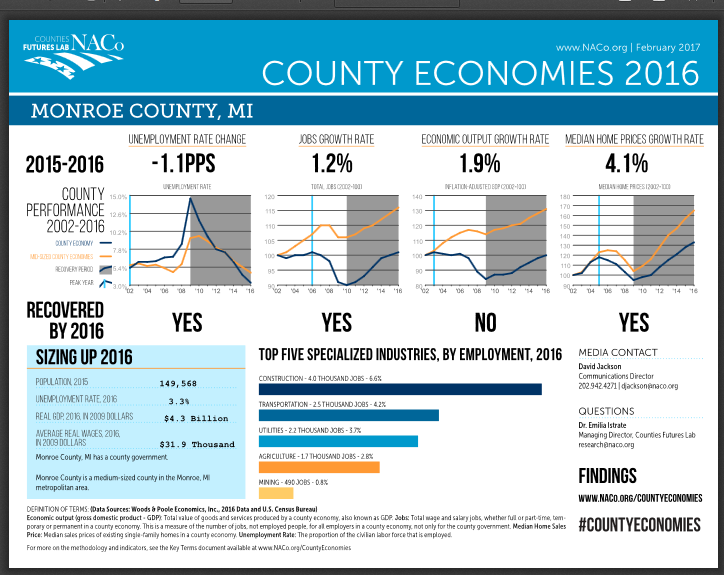
By 2016 Monroe County experienced growth in three of the four performance indicators, according to NACO. While it experienced job, unemployment rate and home price recovery, its economic output growth rate was not considered favorable compared to pre-recession numbers. Monroe County’s GDP peaked in 2003 and by 2009 recovery had begun. However, in 2016 that recovery had yet to reach the 2003 inflation adjusted value, although it was close.

Also, according to NACO, between 2015 and 2016 Monroe County had a jobs growth rate of 1.2 percent, an economic output growth rate of 1.9 percent and a median home prices growth rate of 4.1 percent. The unemployment rate was at 3.3 percent in 2016, a 1.1 percent decrease from the prior year and a 2.2 decrease from 2002.

In Monroe County in 2016 the top five specialized job industries were:

  •   Construction
  •   Transportation
  •   Utilities
  •   Agriculture
  •   Mining

Oak

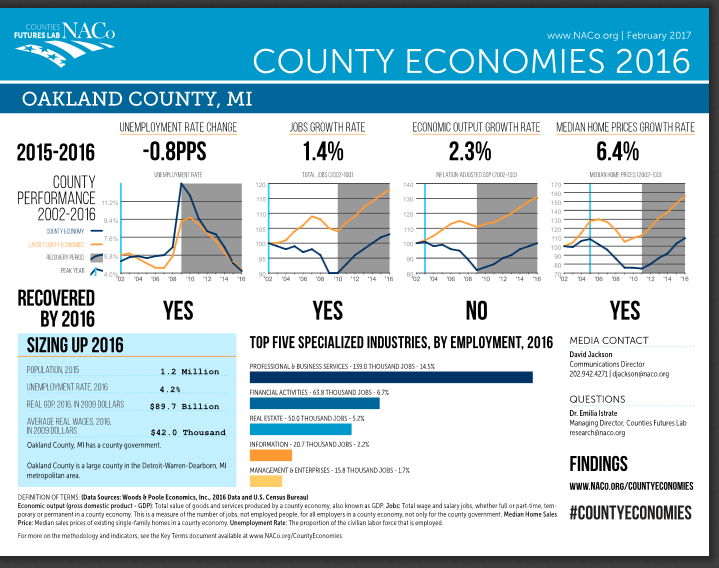
Similar to Monroe County, Oakland County only experienced economic growth in three of the four categories, according to NACO. Oakland County’s GDP has not recovered since its 2003 pre-recession peak; but like many of the other counties in the region recovery began in 2009. Between 2015 and 2016 though, Oakland County’s economic output growth rate did increase by 2.3 percent while its job growth rate rose by 1.4 percent and its median home prices growth rate went up by 6.4 percent. The annual unemployment rate in Oakland County decreased by .8 percent between 2015 and 2016 to a total of 4.2 percent. As has been seen by all the counties discussed thus far, Oakland County’s overall performance indicators remain below other large counties in the country.

In 2016 in Oakland County the top five specialized industries by employment were:

  •   Professional and business services
  •   Financial activities
  •   Real Estate
  •   Information
  •   Management and enterprises

StC

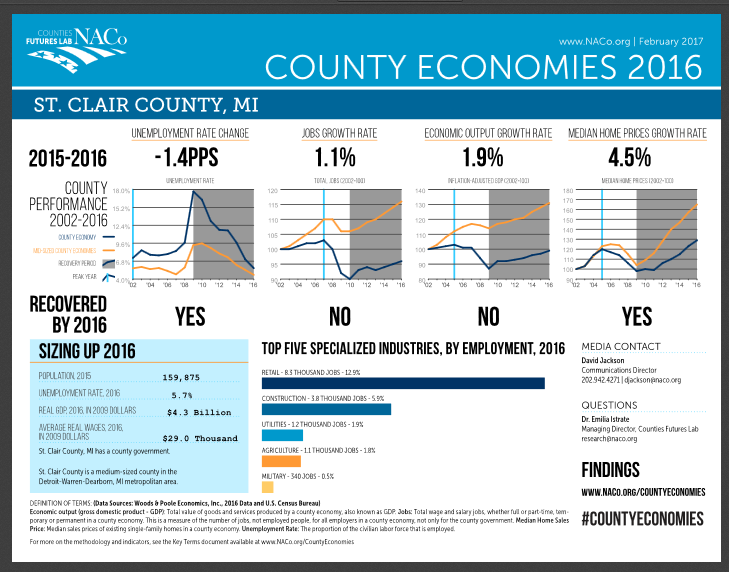
In St. Clair County, total recovery has yet to be seen in both the job growth and economic output growth rate sections, according to NACO. In St. Clair County the total number of jobs available peaked in 2004 and in 2016 that number had yet to reach the pre-recession peak. However, there was a 1.1 percent jobs growth rate increase between 2015-16. Additionally, there was a 1.9 percent economic output growth rate between 2015-16. However, the GDP remained just below its 2005 peak. While those two areas have yet to recover, St. Clair County’s unemployment rate is below where it was at in 2002, its previous low point. In 2016 it had an unemployment rate of 5.7 percent, a decrease of 1.4 percent from the previous year. The county’s median home prices have also experienced growth. In 2016 the median home values had climbed above the previous 2005 peak. Additionally, between 2015-16 there was 4.5 percent increase.

St. Clair County’s top five specialized industries by employment are

  •   Retail
  •   Construction
  •   Utilities
  •   Agriculture
  •   Military

Washt

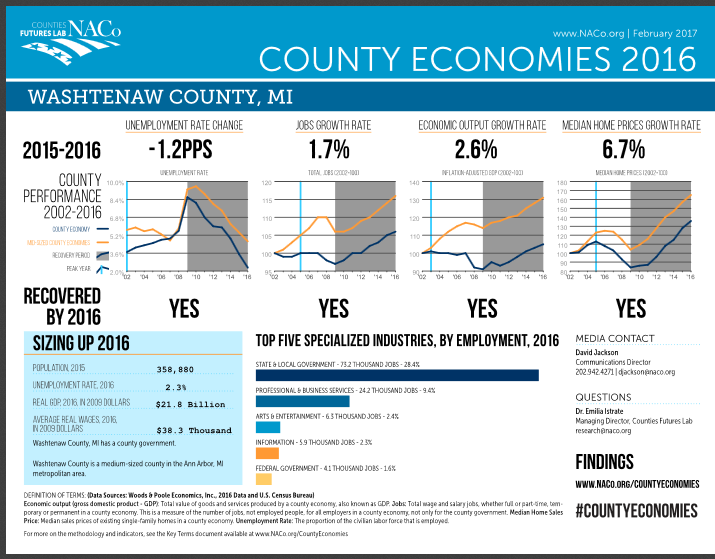
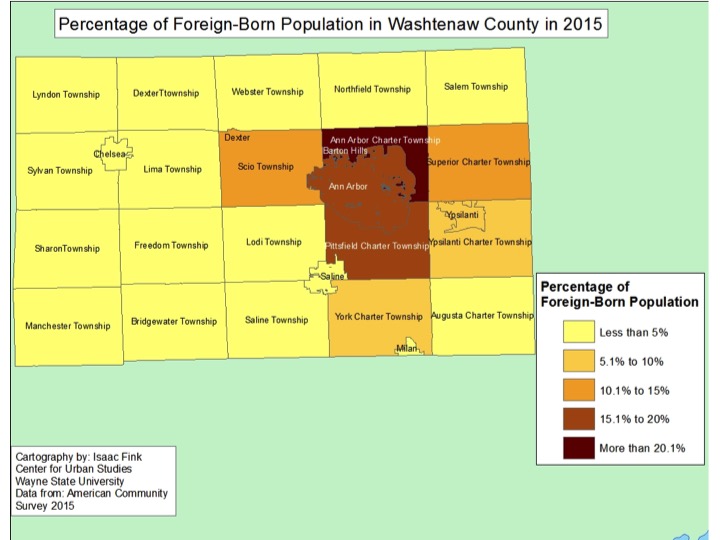
According to NACO, Washtenaw County has experienced economic growth across the board, with its unemployment rate dropping below 2002 rates and its job, economic output and median home price growth rates all rising above the 2005 values, the county’s previous peak values. In 2016 Washtenaw County had an unemployment rate of 2.3 percent, a 1.2 percent decrease from the previous year and also a decrease from its 2002 rate of 3.6. The county’s job growth rate grew 1.7 percent between 2015 -16. The economic output growth rate for Washtenaw County increased by 2.6 percent between 2015-16. Finally, the median home price growth rate increased by 6.7 percent between 2015-16. The top five specialized industries in Washtenaw County by employment are:

  •   State and local government
  •   Professional and business services
  •   Arts and entertainment
  •   Information
  •   Federal government

Wayne

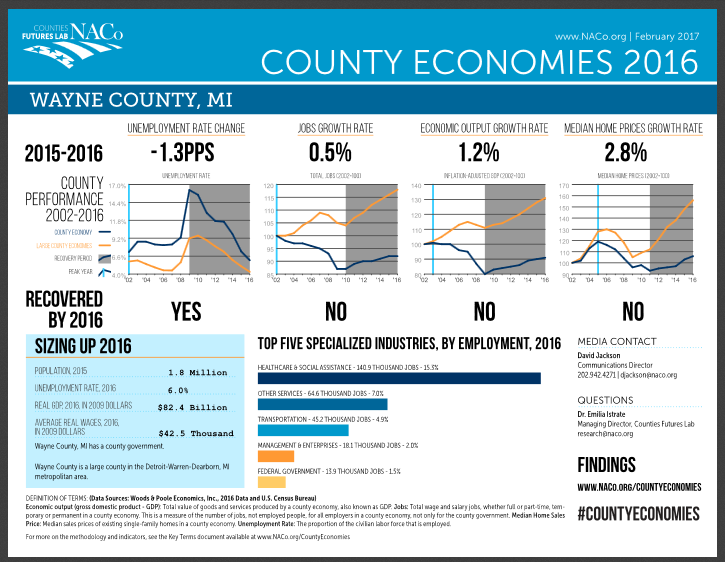
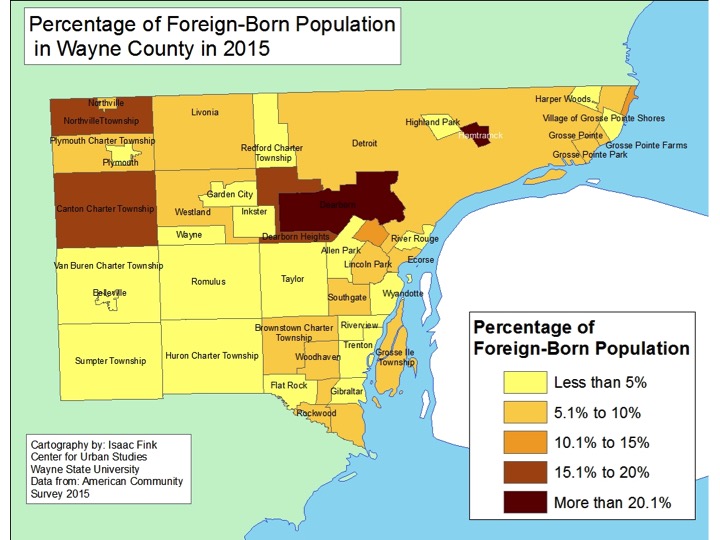
Wayne County is the only county in the region that has recovered in only one of the four areas, according to NACO. In 2002 Wayne County had an unemployment rate of 6.8 percent and in 2016 it was 6 percent, according to NACO. Since 2015 Wayne County has experienced positive growth rates for jobs, economic output and median home prices, but none have recovered to the pre-recession peaks. Wayne County’s unemployment rate was at its lowest in 2002 while the total number of jobs available was at its highest that year. Home values in the county peaked in 2005 and the GDP peaked in 2003.

While recovery has started in Wayne County, median home values and the total number of jobs available didn’t start to increase until 2010 or after, which is later than the 2009 recovery year many of the other counties in the experienced.

In Wayne County the top five specialized industries by employment:

  •   Healthcare and social assistance
  •   Other services
  •   Transportation
  •   Management and enterprises
  •   Federal government

Auto Parts top Michigan Exports, Imports

In Michigan, parts and accessories related to transportation-particularly those related to automobiles and trucks-were the top 10 commodities both imported and exported between 2012 and 2015, according to the U.S. Census Bureau.

In total, the U.S. percent share of commodities Michigan exports is less than the U.S. percent share it imports, however neither have risen above 5.5 percent since 2012, according to the U.S. Census Bureau. In 2015 Michigan exported $25.1 billion worth of transportation equipment, ranging from rear view mirrors to engine ignition spark plugs. In total though, according to the International Trade Administration, Michigan exported $54 million worth of goods in 2015. Canada, a North American Free Trade Agreement (NAFTA) partner, received the largest amount of commodities. In 2015 Canada received about $23.5 million worth of goods; this is equivalent to about 44 percent of the goods exported from Michigan. Mexico, also a NAFTA partner, was second to Canada in exports; in 2015 about $11.8 million worth of goods was exported to Mexico. Canada and Mexico were the only two countries who received more than $4 million worth of exports from Michigan in 2015, according to the International Trade Commission.

Slide03

Slide04

Of the Metropolitan Statistical Areas (MSA) in Michigan the Detroit-Dearborn-Warren area had the highest dollar value of exports at $44.3 billion, according to the International Trade Administration. That $44.3 billion translated into 68.5 percent of the state’s share of exports. Of the data available, the Lansing-East Lansing MSA had the lowest percent share of exports at 1.3, which was equivalent to $852 million.

Of the six of the seven counties in Southeastern Michigan for which data was available (no data for Washtenaw County), Wayne County had the highest value of goods exported in 2015 at $21.2 billion; Livingston County had the lowest at $570 million.


Slide06

Slide07

The U.S. percentage of imports reached a new peak in 2015 at 5.5 percent, according to the U.S. Census Bureau. Since 2012, Michigan’s share of U.S. imports has steadily risen from 5.1 percent. According to the U.S. Census Bureau, of the top 10 goods imported into Michigan, crude oil from petroleum is one of only two items on the list that is not directly labeled as a part related to transportation vehicle (transmission, ignition, etc.). The other good listed is seat parts related to medical chairs.

Imports from Canada ranked above all other countries as the leading source of imports to Michigan. In 2015, 36.8 percent of the goods imported into Michigan were from Canada; 35.4 percent of goods imported into the state were from Mexico. The country with the third largest percentage that Michigan imported from was China at 7.4 percent.Slide09

Slide10

The data presented in this post shows that Michigan’s imports and exports are still heavily linked on the auto industry, and the majority of the goods exported from the state are produced in the most populous region of the state. This region, the Detroit-Dearborn-Warren MSA, is located within miles to Canada and connected via a bridge and a tunnel.

Both in terms of exports and imports, this post also shows that Michigan has the strongest relationships with its NAFTA partners, Canada and Mexico. One of President Donald Trump’s campaign promises has been to re-negotiate the agreement. Both Trump, a Republican, and Democratic U.S. Rep. Debbie Dingell agree that NAFTA has harmed workers and factories. Recently, Rep. Dingell and Oregon Congressman Peter DeFazio introduced a resolution seeking a renegotiation of NAFTA to reduce the trade deficit, according to a Feb. 20 Michigan Radio article.

That resolution can be read here.