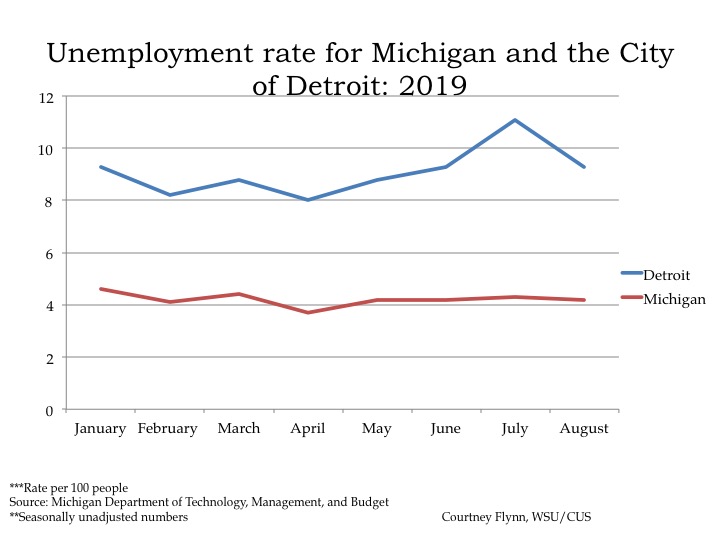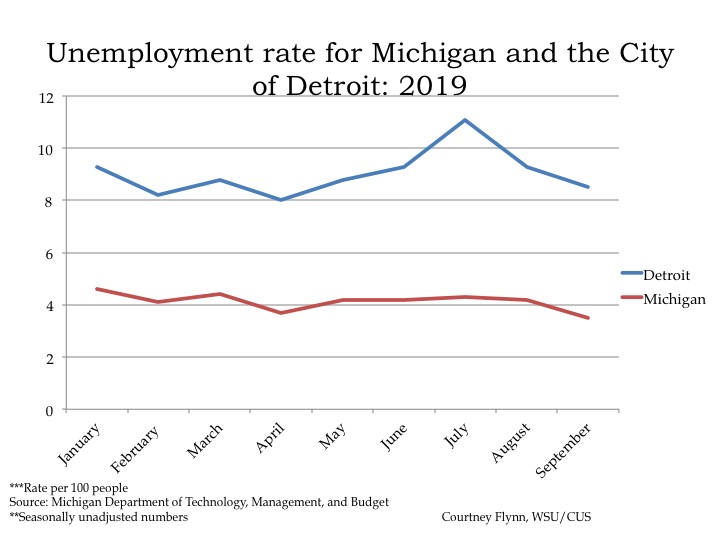
In September of 2019 the unemployment rate for the State of Michigan was 3.5, a small decrease from the August unemployment rate of 4.2, according to the most recent data provided by the Michigan Department of Technology, Management and Budget. The State unemployment rate for September of 2018 was the same as it was this year in September, 3.5.
In September of 2019 Detroit’s unemployment rate was 8.5 percent. That Detroit unemployment rate was 0.8 points lower in September of 2019 from the previous month. Also, the September 2019 unemployment rate for Detroit was 0.1 point higher from the previous year. In August of 2018 it was 8.4 percent.
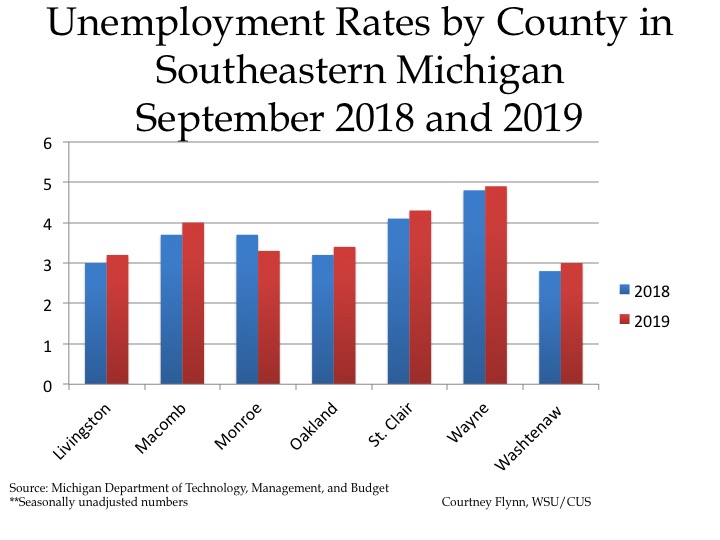
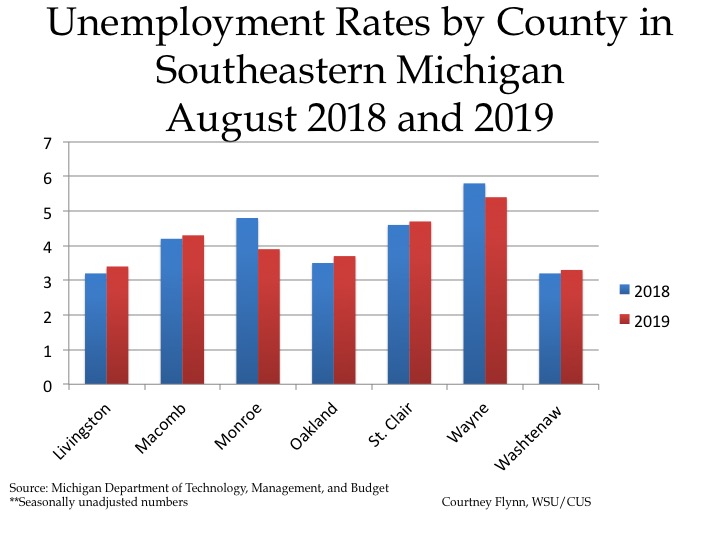
The chart above displays the unemployment rates for each of the seven counties in Southeastern Michigan for September of 2018 and 2019. In September of 2019 Wayne County had the highest unemployment rate at 4.9. Washtenaw County had the lowest unemployment rate at 3.
Monroe County was the only one to have a lower unemployment rate in September of 2019 compared to September of 2018. In 2018 Monroe County had an unemployment rate of 3.7 and in 2019 in decreased to 3.2. For all the other counties in the region an unemployment rate increase between September of 2018 and 2019 was not above 0.2.
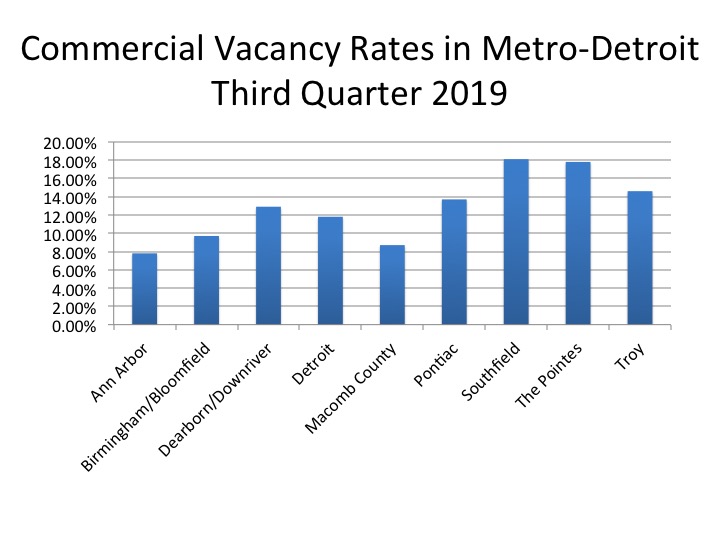
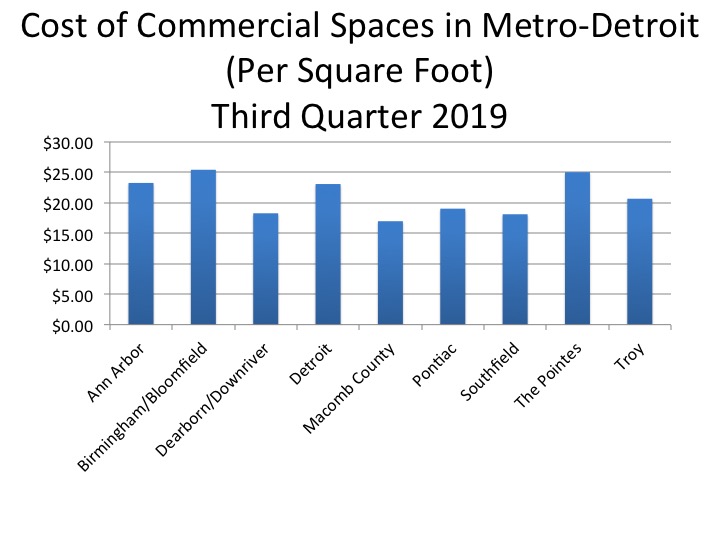
Real estate availability is another aspect of an area’s financial health. Below is information from the quarterly reports of Cushman and Wakefield, a global real estate firm, which produces information related to Metro-Detroit. According to the company, investments in Metro-Detroit have been strong in 2019. One instance cited for this is the investment Amazon is making in Pontiac at the old Silverdome site (1,500 jobs are expected to come with the purchasing and transition of the site). In the third quarter of 2019 Pontiac had a commercial vacancy rate of 13 percent, as shown in the second chart below. Southfield, the Grosse Pointes and Troy all had higher vacancy rates at 18.1 percent, 17.8 percent and 14.6 percent, respectively. Ann Arbor had the lowest vacancy rate at 7.8 percent, followed by Macomb County at 8.7 percent. As one might expect Ann Arbor, with one of the lowest vacancy rates in the third quarter of 2019 also one of the highest costs per square feet in the region at $23.25. The Birmingham/Bloomfield area was one of the only other areas in the region with a higher cost per square foot for commercial property at $25.41, while in the Grosse Pointes the average commercial property was priced at $25.02 per square foot. Macomb County had the lowest cost at per square foot at $16.97.