Poverty in Metro-Detroit spreading through the suburbs

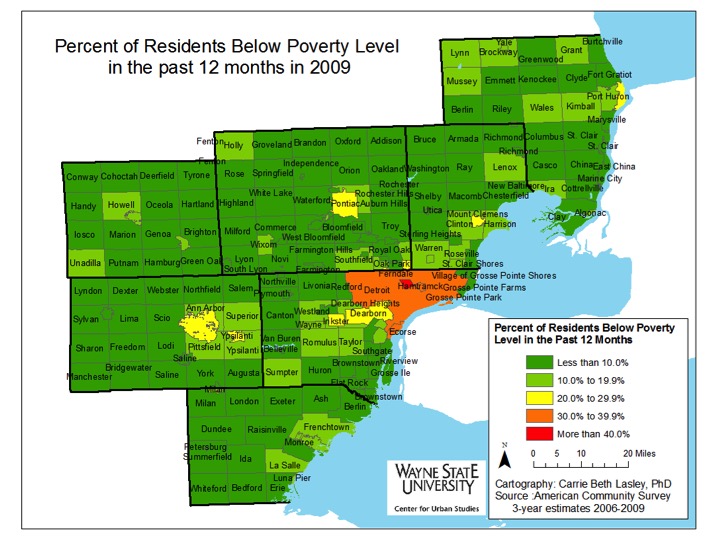
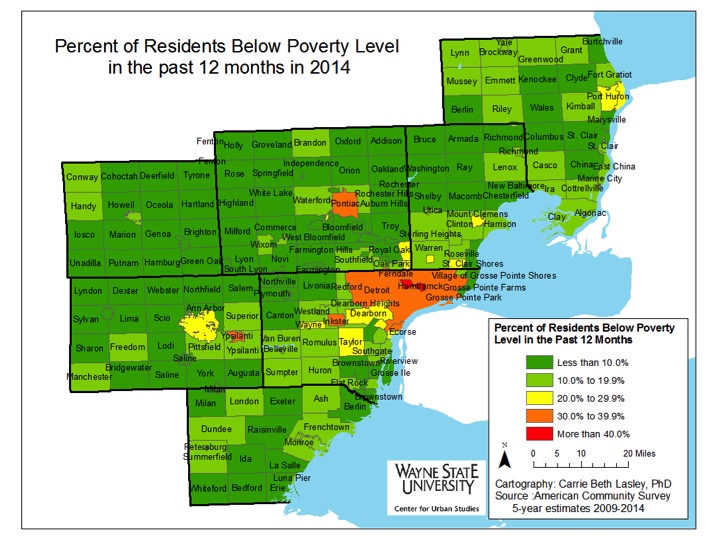
Between 2009 and 2014, poverty levels in the region’s urban communities, such as Detroit, Pontiac and Highland Park, increased, just as they did for some of their suburban neighbors. One might assume that the city of Detroit had the region’s highest percentage of residents living below the poverty level in 2014 due to the amount of press coverage it receives regarding poverty, crime, and various economic indicators. However, the city of Hamtramck, an immediate neighbor to Detroit, actually had the highest percentage of residents living below the federal poverty level in 2014.

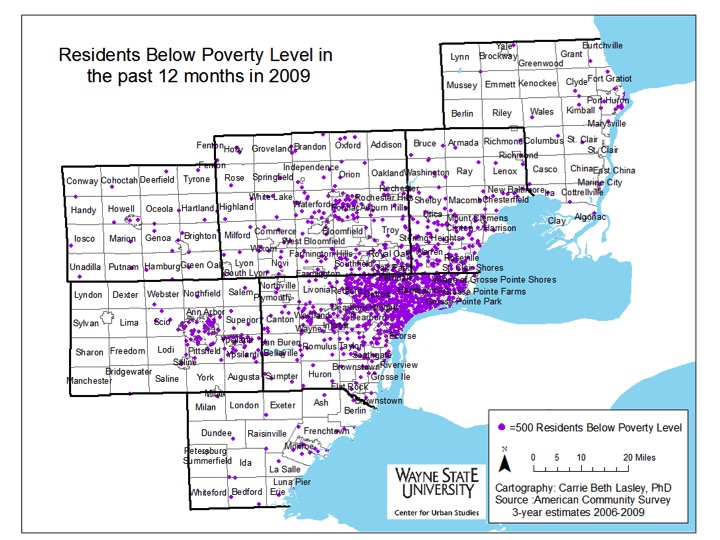
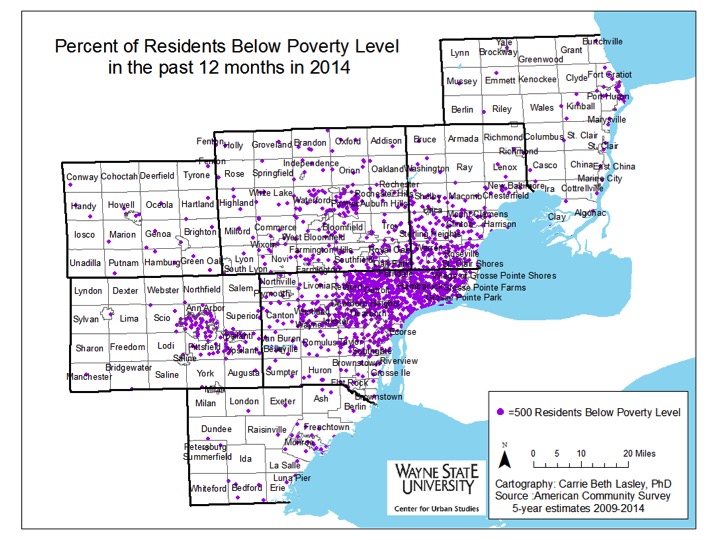
This post will examine the percent of residents throughout the region below the poverty level in 2009 and 2014. Both the change in percent and concentration will be shown with various maps. For reference, according to the U.S. government, the Federal Poverty Level (FPL) in 2014 for a family of four was $23,850; in 2009 the FPL was $22,050 for a family of four.

DetroitPoverty2009


DetroitPoverty2014

In 2014, the cities with 30 percent or more of residents living below the poverty line were:

  • Ypsilanti: 30.6%
  • Inkster: 37 %
  • Pontiac: 37.8%
  • Detroit: 39.4%
  • Highland Park: 47.6%
  • Hamtramck: 48.5%


As mentioned above, in 2014, the city of Hamtramck had the highest percentage of individuals living below the poverty line at 48.5 percent; in 2009, that number was 38.4 percent. In the city of Detroit, the percentage of individuals living below the poverty line increased from 33.2 percent in 2009 to 39.4 percent in 2014.


Each county within the Southeastern Michigan region, with the exception of Livingston County, experienced an increase in the number of communities with a higher percentage of residents living below the poverty line between 2009 and 2014. For example, in 2009, a majority of St. Clair County had less than 10 percent of its residents living below the poverty level, but by 2014 that shifted to between 10-19 percent of residents. There were some communities within that county, though, such as Fort Gratiot and Port Huron Township, which experienced a decrease in the percentage of people living below the poverty level. The higher poverty levels in St. Clair County shifted to the more rural area (the northern part of the county) and to the waterfront communities. Overall, the percentage of individuals living below the poverty line in St. Clair County in 2014 was 15.2 percent.


Another visible increase in the percentage of residents living below the poverty level was in the southern portion of Macomb County. Here, cities such as Eastpointe, Sterling Heights, Center Line and Utica all went from having less than 10 percent of their populations living below the poverty level to between 10 to 19 percent of the populations living below the poverty level. For Eastpointe, just under 10 percent of the population lived below the poverty level in 2009 and in 2014 that percentage increased to 23.5 percent. In Sterling Heights, 7.9 percent of the population lived below the poverty level in 2009, and in 2014 that number increased to 13 percent. Macomb County’s overall poverty rate was 12.2 percent in 2014.

The increase in the percentage of individuals living below the poverty line took place in Wayne County as well, with Redford, Flat Rock, Inkster, Wayne, and the southwest portion of the county all experiencing visible changes. Overall, Wayne County had a poverty rate of 24 percent in 2014.

While several communities throughout the region did experience an increase in the percentage of residents living below the poverty line there were, as noted above, some that experienced a decrease. For example, in 2009, 10.5 percent of the population in Howell Township in Livingston County lived below the poverty line and in 2014 that number was 4.6 percent.

Among the counties in Southeastern Michigan, Livingston County had the lowest percentage of individuals living below the poverty level in 2014 at 5.4 percent. The percentage of individuals living below the poverty level in Oakland County in 2014 was 9.9 percent and in Monroe County it was 11.8 percent.

SEMichiganPoverty2009

SEMichiganPoverty2014

Poverty, while being largely concentrated in the city of Detroit, has shifted outward toward the suburbs between 2009 and 2014, as illustrated above. In Wayne County, areas of Detroit, such as downtown, have experienced decreases in the percentage of individuals living below the poverty line while places such as Westland, Romulus and the western portion of the county have experienced an increase. To the north of Detroit, communities in southern Macomb County, such as Eastpointe, and in southeastern Oakland County, such as Hazel Park and Oak Park, have also experienced an increased percentage in the number of residents living below the poverty line.


Ann Arbor, while not experiencing a shift the magnitude of Detroit’s, has also seen its populations living below the poverty levels shift to nearby areas like Pittsfield and Scio. Additionally, in Ann Arbor, poverty concentration has decreased in the northeastern portion of the city and dispersed throughout the entire city.


While the region has experienced a slight shift and a clear growth in concentrated poverty, this isn’t an uncommon trend for other metropolitan areas throughout the Midwest region. According to “Architecture of Segregation: Civil Unrest, the Concentration of Poverty, and Public Policy,” a new study by the Century Foundation, concentrated poverty has spread from within the boundaries of metropolitan cities and into the inner ring suburbs. This has been attributed, in part, to the gentrification and increased taxes of urban communities, which has resulted in the movement of residents who are living below the poverty level to inner ring suburbs with aging infrastructure.

DetroitPovertyChange

DetroitPoverty2009

DetroitPoverty2014


DetroitPovertyConcentration2010

PovertyDetroitDD2014


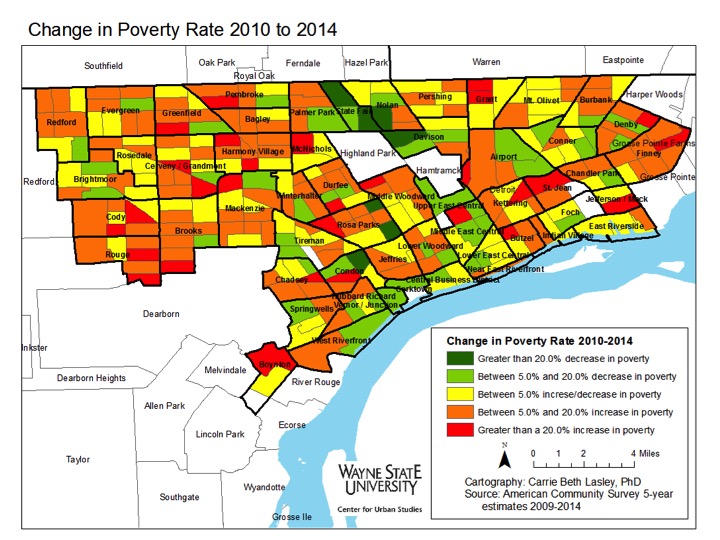
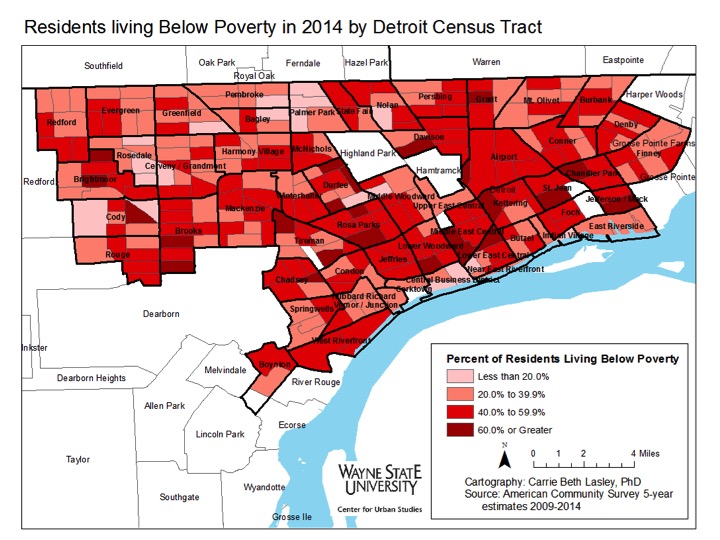
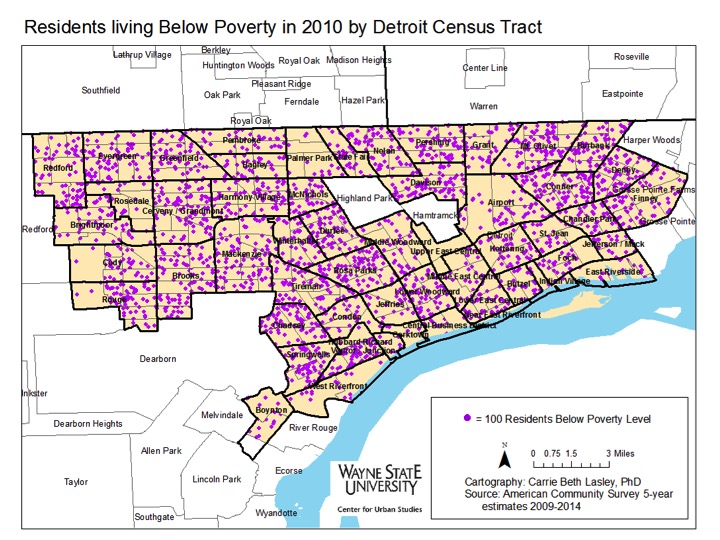
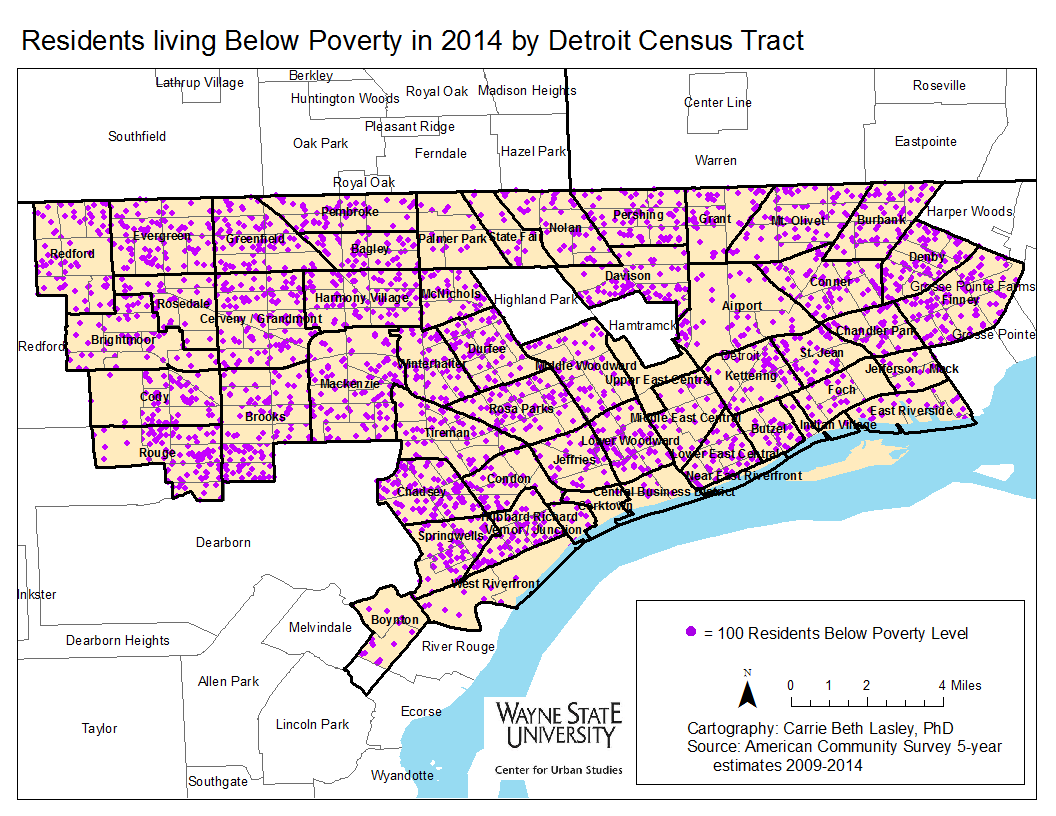
Between 2010 and 2014, pockets of Detroit neighborhoods experienced a decline in the percentage of individuals living below the poverty line while others experienced increases upwards of 20 percent. Concentrations of poverty in Detroit increased in areas such as Cody/Rouge, the neighborhoods bordering Grosse Pointe Farms, along the borders of Hamtramck, and the Southwest neighborhoods of the city.

Only about a dozen census tracts had less than 20 percent of individuals living below the poverty line in 2010. A majority of these census tracts were located on the city’s west side, west of Palmer Park and near Rosedale Park, along with about four bordering the Grosse Pointes on the east side. By 2014, a majority of those census tracts experienced at least a 5 percent increase in the percentage of residents living below the poverty level.


The neighborhoods along Woodward Avenue north of Highland Park, such as Palmer Park and Green Acres, experienced some of the largest decreases in the percentage of individuals living below the poverty level in the city of Detroit between 2010 and 2014. The Midtown, East Riverside, and Corktown areas also experienced decreases in the percentage of residents living below the poverty level.


In spite of the positive trends in these neighborhoods, however, high poverty census tracts have dramatically increased in the city of Detroit since 2000, according to the Century Foundation study cited earlier. By 2014, the majority of the census tracts in the city of Detroit had between 40 and 59.9 percent of residents living below the poverty level. As such, even with the improvements made, poverty concentration continues to be a challenge in the city of Detroit.

It is policies, both new and recent, that have helped contribute to the increase in concentrated poverty. From the investment into new infrastructure, rather than fixing what already stands, to urban sprawl and the disproportionate building of homes for the middle class and wealthy to the income increases being felt by the rich, but maintaining stagnant for the poor, there are policies in place that allow the growth of poverty and concentrated poverty to occur.


Sexually Transmitted Infections (STI) in Southeastern Michigan: Chlamydia rate decreasing in Wayne County, but nearly double Michigan’s rate

In examining three major Sexually Transmitted Infections (STI) we find Chlamydia experienced rate increases in five of the seven counties in Southeastern Michigan between 2004 and 2014, according to the Michigan Department of Community Health. Oakland and Wayne counties were the only two that didn’t experience rate increases for this sexually transmitted infection (STI). These two counties were inline with the state trend; Michigan experienced a chlamydia rate decrease between 2004 and 2014, from 484.3 per 100,000 people to 452.5. According to the Centers for Disease Control, the increase in chlamydia rates was a national trend, as it increased about three percent from 2013 to 2014.


Chlamydia and gonorrhea were most commonly diagnosed in 15-24 year-olds throughout the country, according to the Centers for Disease Control. This is an ongoing national trend that a Centers for Disease Control Doctor Gayle Bolan said is occurring, in part, because of sexual relationships beginning at an early age, according to NBC News. Overall STI rates are increasing nationally because budget cuts to STI programs, changed behavior of gay and bi-sexual men and better reporting mechanisms, Bolan said. She said chlamydia is the most affected by better reporting mechanisms, as it has always been amongst the most common STI, while syphilis rates seem to be increasing because of the changed behavior of gay and bi-sexual men.

Also, officials from Rhode Island to Kent and Wood counties on Michigan’s west side are attributing their STI rate increases to “hook-up” apps like Tinder because of the increased opportunities they allow for casual sex.


In Michigan as a whole, not only are chlamydia rates decreasing, but so are gonorrhea rates; conversely, syphilis cases are increasing. This trend is similar with regional trends.


Chlamydia was the only sexually transmitted infection for which data were recorded for all seven counties at three time periods (2004-2008 average; 2009-2013 average and 2014). The sexually transmitted infection of syphilis has counties lacking data for all three time periods. Data on gonorrhea for all seven counties is available only for the 2004-2008 and 2009-2013 time periods. It is unclear if missing data is due to data suppression or low numbers.

All rates are per 100,000 residents.

Detroit Chlamydia Rates 2008

Detroit Chlamydia rates 2013

Detroit Chlamydia Rates 2014

St. Clair County experienced the largest chlamydia rate increase of all seven counties from a 2004-2008 average rate of 275.7 per 100,000 per residents to a 2014 rate of 402.4,. In 2014, though, it was Wayne County that had the highest overall Chlamydia rate per 100,000 residents at 811.1, a rate nearly 400 points higher than the states. The 2014 rate of 811.1 decreased from 1076.5 for the 2009-2013 average and from 1007.3 for the 2004-2008 average rate.

As noted earlier, Wayne and Oakland counties were the only two in the region to experience a rate decrease for chlamydia between 2004 and 2014. Oakland County’s average chlamydia rate for 2004-2008 was 300.5, and the 2014 rate was 280.7. Between the 2009-2013 average and 2014 Oakland County also experienced a rate decrease, from 297.6 to 280.7.

The state’s chlamydia rate for 2014 was 452.5, a decrease from 484.3 per 100,000 people for the 2004-2008 average and a decrease from 490.7 per 100,000 people for the 2009-2013 average.

Detroit Gonnorhea rates 2008

Detroit Gonnorhea rates 2013

Detroit Gonnorhea rates 2014

Between 2004 and 2014, of the counties with available data, Wayne County experienced the largest gonorrhea rate decrease from 376.6 for the 2004-2008 rate average to 231.4 for the 2014 rate per 100,000 people. Even so Wayne County had the second highest gonorrhea rate in the state in 2014 (Kent County had the highest rate at 255), according to the Michigan Department of Community Health, but the highest percent distribution of gonorrhea cases in the state came from Wayne County, with 42.4 percent of cases coming from there. The rate decreases for the other three counties with information available-Macomb, Washtenaw and Oakland-ranged between 9 and 15 points between 2004 and 2014. Washtenaw County’s 2014 gonorrhea rate was 72.9, decreasing from the 88.5 average from 2004-2008. Macomb County’s rate of 55.8 per 100,000 in 2014 was a decrease from the 64.7 average rate of 2004-2008. Oakland County’s 2014 rate of 49.6 per 100,000 was a decrease from the 78.7 average rate of 2004-2008.

St. Clair, Livingston and Monroe counties were missing rate data on gonorrhea for 2014. Between the 2004-2008 and 2009-2013 averages St. Clair and Monroe counties both experienced rate increases per 100,00 people and Livingston County experienced a rate decrease. For the 2004-2008 rate averages St. Clair County’s rate was 45, Monroe’s was 41.8 and Livingston County’s was 10.7. The 2009-2013 rate for St. Clair County was 46.6, Monroe 42.2 and Livingston County was 10.5.


Slide11 Slide12


Detroit Syphillis Rates 2014

For syphilis data, Wayne, Oakland and Macomb Counties were the only three with consistent data between 2004 and 2014. According to the Michigan Department of Community Health, Wayne County had the highest rate of the three counties in 2014 at 32.4 per 100,000 people; this was an increase from 21.9 for the 2009-2013 average and an increase from 20.5 from the 2004-2008 average. Macomb County’s syphilis rate per 100,000 people in 2014 was 9 and Oakland County’s rate was 12.1. These two counties also experienced rate increases from the 2004-2008 average and the 2009-2013 average. For the 2004-2008 average, Macomb County’s rate was 5.6 and Oakland County’s rate was 7.6. For the 2009-2013 average, Macomb County’s rate was 7.5 and Oakland County’s rate was 7.8.

Washtenaw County had data recorded for the 2004-2008 average and the 2009-2013 average. This information that Washtenaw County’s rate between those two time periods experienced a miniscule rate increase, from 7.8 for the 2004-2008 average to 7.9 for the 2009-2013 average.


In 2014, Michigan’s syphilis rate was 11.3, an increase from both the 2004-2008 average (7.5) and the 2009-2013 average (7.6). The 2014 rate is nearly a third of Wayne County’s 2014 syphilis rate.

Cancer incidence rates declining across Southeastern Michigan

Overall cancer rates declined across all counties in Southeastern Michigan in the last decade. Cancer rates also declined for nearly all major categories—breast, colon/rectal, lung/bronchial and prostrate—in most counties. The category “all other sites” of cancer, however, increased between the 1998-2002 period and the 2008-2012 period for four of seven counties. These counties were Livingston, Macomb, Washtenaw and Wayne.

Slide03

Slide21

For the total average cancer incidence rates per 100,000 people Monroe County had the largest decrease at nearly 100 between 1998 and 2012; the 1998-2002 average was 478.6 and the 2008-2012 average was 378.8. Oakland and St. Clair counties had similar rate decreases (73.8 and 84.1, respectively) between that time. For the 1998-2002 average Oakland County’s overall cancer incidence rate was 565.9, and St. Clair County’s rate for this time was 581. For the 2008-2012 averages, Oakland County posted a rate of 492.1 and St. Clair County posted a rate of 496.9.

From 477.6 to 471.9, Washtenaw County had the lowest decrease at 5.7. It was Livingston County that had the lowest average rate for 2008-2012 at 441.1 per 100,000 people; Livingston County’s average rate for 1998-2002 was 451.5.

For Wayne County, the average cancer incidence rate per 100,000 people was 568.2 for 1998-2002 and 525.5 for the 2008-2012 average.

Slide05

Slide06

Livingston, St. Clair and Oakland counties all experienced a decrease in their average breast cancer rates between 1998 and 2012. From 1998-2002 Oakland and St. Clair counties had the highest breast cancer rates with Oakland County reporting a breast cancer rate of 84.6, and St. Clair County a rate of 83.7. St. Clair County had the largest decrease from the 1998-2002 to 2008-2012 average; the rate dropped 20.4 points, from 83.7 to 63.3.

Washtenaw County only experienced a 2 point decrease across those two time periods; it had the highest average rate for the 2008-2012 time period of 73.1.

Slide08

Slide09

Average colon and rectum cancer incidence rates throughout the seven county region decreased between 1998 and 2012, with Monroe County posting the largest rate decrease. For the 1998-2002 average rate per 100,000 people Monroe County’s average incidence rate was 60.2, and for the 2008-2012 average the rate per 100,000 people was 35.8; the overall decrease was 24.4. For the 2008-2012 period St. Clair County had the highest average rate per 100,000 people at 51.6, though it had experienced a very substantial reduction from 74.2 in the 1998-2002 period.

Slide11

Slide12

Lung and bronchus average cancer incidence rates in all seven counties decreased between 1998 and 2012, with St. Clair County experiencing the largest decrease at 17.3, from 90.1 to 72.8. Wayne County had the highest rate at 82.9 for 2008-2012, compared to 90.1 for 1998-2002.

Slide14

Slide15

Monroe County had the largest average prostate cancer incidence rate decrease per 100,000 between 1998 and 2012 of 36.1; the 1998-2002 rate was 76.7 and the 2008-2012 rate was 40.6. Oakland County also experienced a large rate decrease from the 1998-2002 average to the 2008-2012 average; the Oakland County rates went from 104.7 to 79.4. Despite the 25.3 average rate decrease Oakland County’s average prostate rate remained the highest in the region for 2008-2012 at 79.4.

Slide17

Slide18

When looking at all other average cancer incidence rates for the region four of the seven counties experienced rate increases per 100,000 people. Those four counties were Livingston, Macomb, Washtenaw and Wayne counties. Washtenaw County had the largest average rate increase at 15.1 per 100,000 between 1998 and 2012, from 216.4 to 231.5. Monroe County had the largest average incidence rate decrease between 1998 and 2012 at 22. Monroe County’s 2008-2012 average rate was 185.4, the lowest rate in the region, and its 1998-2002 rate was 207.4. Overall, Macomb County had the highest average incidence rate for 2008 to 2012 at 246.4; its 1998-2002 rate was 241.7.