Economic Indicators: Housing Prices $30K Higher Since 2014

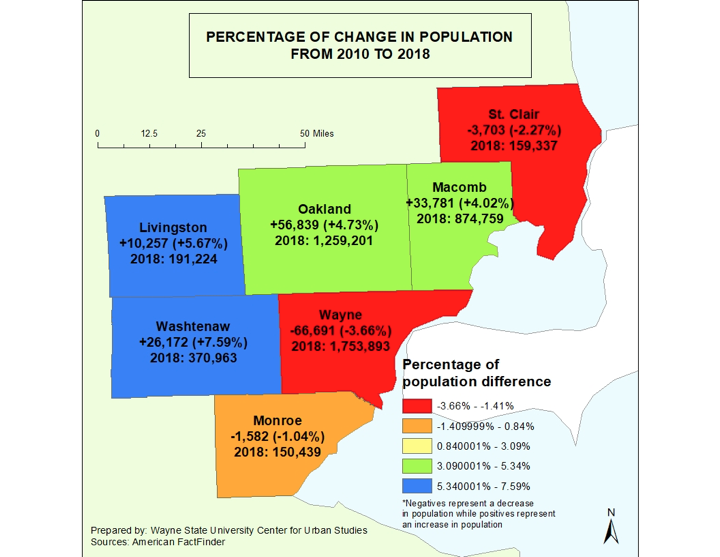
In April of 2019 the unemployment rate for the State of Michigan was 3.7, a decrease from the March unemployment rate of 4.4, according to the most recent data provided by the Michigan Department of  Technology, Management and Budget. The State unemployment rate for April of 2018 was 0.2 points higher than what it was in December of 2019 (3.7).

The Detroit rate was 0.8 points lower in April of 2019 from the previous month. Also, the April 2019 unemployment rate for Detroit was the same as it was during the same time the previous year ( unemployment rate was 8 both years).


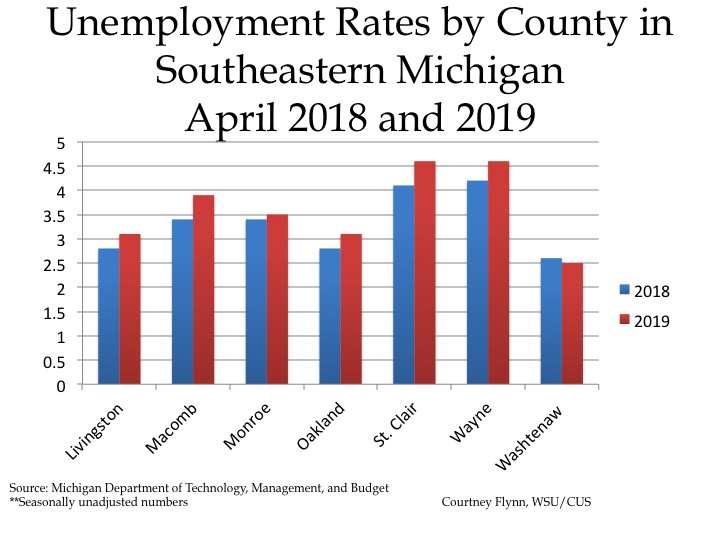
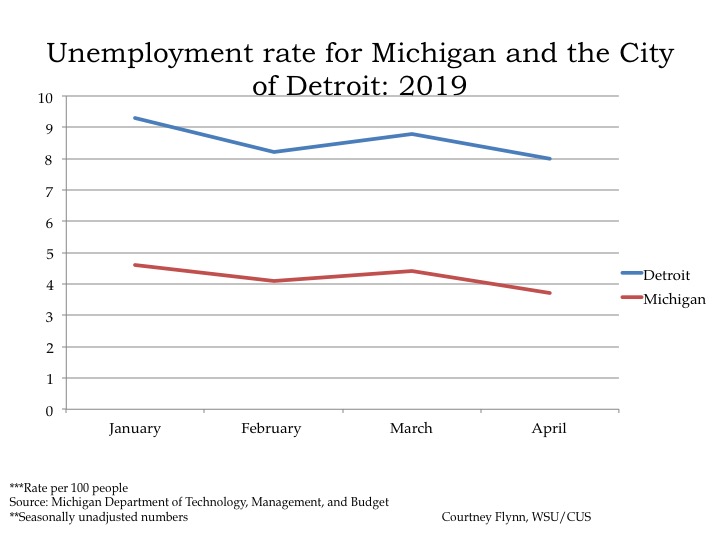
The chart above displays the unemployment rates for each of the seven counties in Southeastern Michigan for April of 2018 and 2019. In April of 2019 Wayne County and St. Clair County both had the highest unemployment rates at 4.6. Washtenaw County had the lowest unemployment rate at 2.6. Washtenaw County was also the only county in the region to have a lower unemployment rate in April 2019 than in April 2018. Macomb and St. Clair counties had the highest difference in their unemployment rates between April 2018 and 2018; in that time frame the rates increased by 0.5. The unemployment rate for Wayne County increased by 0.4.


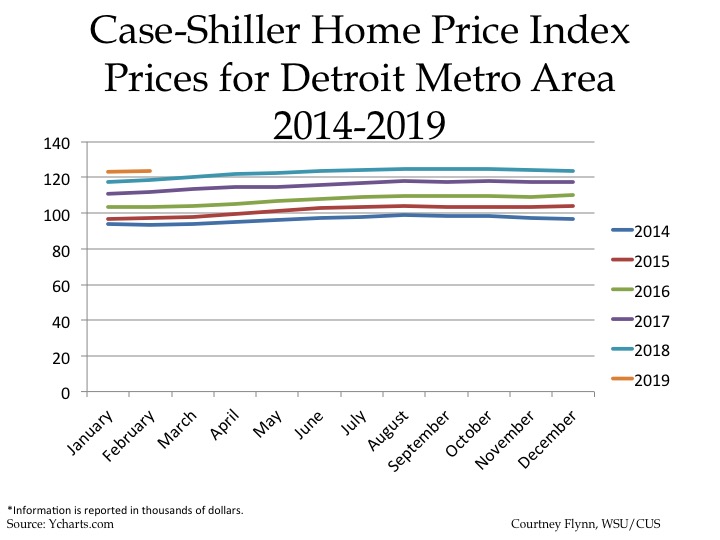
The above chart shows the Standard and Poor’s Case-Shiller Home Price Index for the Detroit Metropolitan Statistical Area. The index includes the price for homes that have sold but does not include the price of new home construction, condos, or homes that have been remodeled.

According to the index, the average price of single-family dwellings sold in Metro Detroit was $123,370 in February 2019; this was $180 higher than the average family dwelling price in January. The February 2019 price was an increase of $5,710 from February of 2018 and an increase of $12,340 from February of 2017, an increase of $19,940 from February of 2016 and increase of  $26,490 from February of 2015 and, finally, an increase of 
$29,270 from February of 2014.

Wayne County has Highest Percentage of Children Owed Child Support

In 2017 Wayne County had the highest percentage of children owed child support in Southeastern Michigan at 26.6 percent. What this means is that among children who should  be receiving child support, there is a percentage in each county who are still owed something. The age of children looked at for this data was 0-19 years of age. Next to Wayne County, St. Clair County had the second highest percentage of children owed child support at 22.2 percent. Washtenaw County had the lowest percentage of children owed child support at 11.9 percent, and Livingston County was at 12.2 percent.

Just as Wayne County had the highest percentage of children owed child support, it also had the highest percentage of children owed child support who had not received any. According to the data, 33.2 percent of Wayne County children who were owed child support in 2017 had not received any. And, while Washtenaw County had the lowest percentage of children owed child support regionally, it had the second highest percentage of children who had not received any. In 2017, 19 percent of Washtenaw County children who were owed child support did not receive any. Livingston County had the lowest percentage of children who were owed child support but didn’t receive any at 7.3 percent. The difference in the percentage of children owed child support and the percentage who have received none could be dependent on several factors, including the median income and employment rates of that area and the resources a county dedicates to ensuring those who owe child support pay.

Child support plays a vital role in a child’s life by giving him or her additional resources to have access to financial security. Child support helps ensure a child has food, shelter and other daily necessities. Each situation involving child support differs, but in general, if a parent does not have full custody of a child he or she should anticipate paying at least 25 percent of their income for child support.

Wayne County Has Highest Percentage of Free/Reduced Lunch Eligible Students

Access to regular and nutritious meals is important, particularly for children. Having access to breakfast and lunch allows students to be able to focus better, have energy and to grow, both physically and mentally. For this reason, we have adopted programs to deliver free and reduced price lunches to children in difficult circumstances. The percentage of children eligible for free or reduced lunches prices thus tracks poverty levels in a school district or county, while at the same time representing an investment in our children.

Those who are eligible for free or reduced lunch prices arechildren in households that receive benefits from the Food Assistance Program or Family Independence Program. For example, in 2018, a family of four that has an annual income of about $33,000 or less was eligible for free or reduced lunch prices. As the map below shows, Wayne County had the highest percentage of students eligible for free or reduced lunch in 2018, according to data from the 2019 Kids Count. In 2018 64.5 percent of school-aged children in Wayne County were eligible for free or reduced lunch prices. According to the U.S. Census Bureau 35.5 percent of children living in Wayne County in 2017 (the most recent data) were considered to be living below the poverty level. In 2017 a family of four was considered to be living below the poverty level if the annual household income was $24,600 or less. The county with the second highest percentage of school-aged children eligible for free or reduced lunch prices was Macomb County at 47.6 percent, and St. Clair County was slightly behind with 45.7 percent of students eligible for free or reduced lunch prices. And, for additional insight, the percentage of children living below the poverty level in 2017 in Macomb County was 17.6 percent, and the percentage of children living below the poverty level in St. Clair County was 19.2 percent.  Regionally, the county with the lowest percentage of children eligible for free or reduced lunch prices was Livingston County; 22 percent of students were eligible. The percentage of children living below the poverty level in Livingston County was 7 percent.


While we do know that the percentage of children eligible for free or reduced lunch prices is a proxy measure for poverty, the percentages for both data sets do not directly mimic one other. Additionally, the income guidelines differ for the overall poverty level and eligibility for free and reduced lunch. Overall though, we do see that areas with higher poverty levels have a higher percentage of children eligible for free or reduced lunch prices.

Wayne County Continues to Lose Residents

In our seven county region, Wayne County continues to be the most populated county, yet since 2010 it has also lost the most residents, according to new population data released by the U.S. Census Bureau. In 2018 Wayne County had a population of about 1.75 million people, the Census estimated. However, as the second map shows, this was a loss of about 67,000 people since 2010. This change in population resulted in a 3.6 percent decline in Wayne County’s population. St. Clair and Monroe counties also experienced population losses since 2010.  According to the data, St. Clair County experienced a 2.3 percent population loss since 2010 and Monroe County experienced a 1 percent population loss. In 2018 St. Clair County had a population of about 159,000 and Monroe County had a population of about 150,000.

While more rural counties like St. Clair and Monroe counties experienced a population loss, Livingston and Washtenaw counties experienced the most growth regionally. In 2018 Washtenaw County had a population of about 371,000, which was an 8 percent growth since 2010. This 8 percent growth meant an additional 26,000 people moved to the county since 2010. In Livingston County the population grew by about 6 percent since 2010. In 2018 the Livingston County population was about 191,000, this is reflective of about a 10,000 person growth since 2010.

Macomb and Oakland counties also experienced population growth since 2010, by 4.7 and 4 percent, respectively. Oakland County is the only other county in the region with a population above 1 million (its population is about 1.3 million). Macomb County has a population of about 875,000.


At the state level, Michigan’s population has continued to grow for seven years now, with its most recent population count being just under 10 million people. One reason it is estimated the state is experiencing growth is because more people are moving to Michigan, and fewer people are leaving.