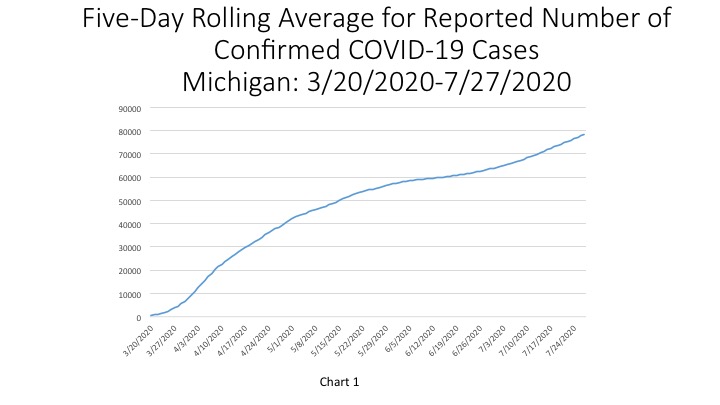
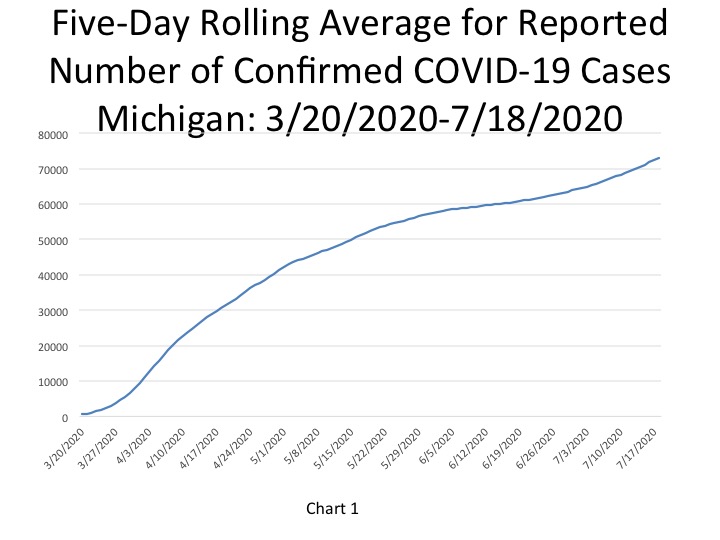
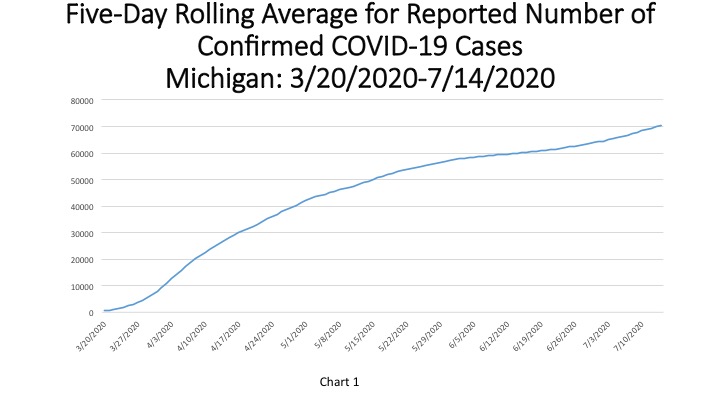
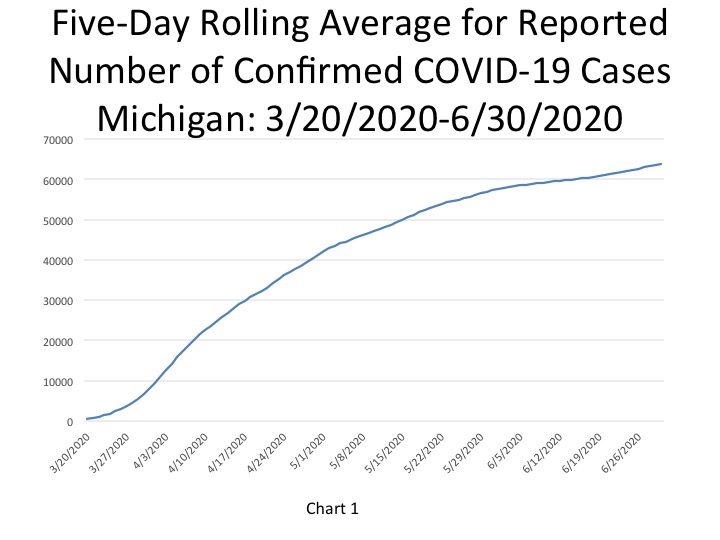
On July 29, the State of Michigan reported a cumulative total of 80,172 cases, an increase of 996 cases from the day prior. Of those 996 new cases reported on July 29, 300 of them were from a backlog in a reporting, according to the State. In Chart 1 we show that the State total for the number of COVID cases on July 27 was 78,570–a five-day rolling average. The five-day rolling average for the total number of COVID cases (Chart 1) reflects a smoother curve and adjusts for fluctuations in testing and/or the quality of reporting or failure to report.
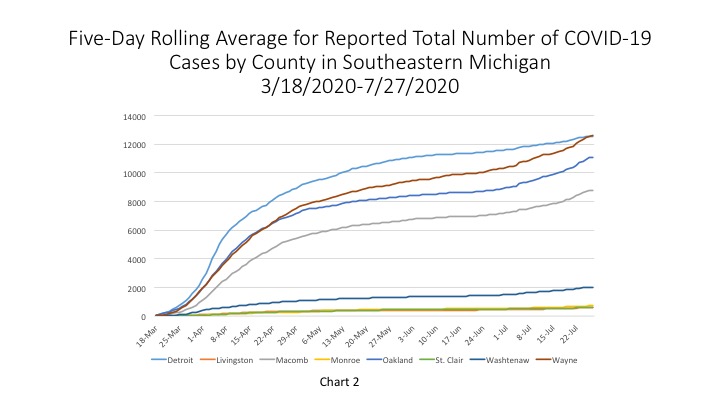
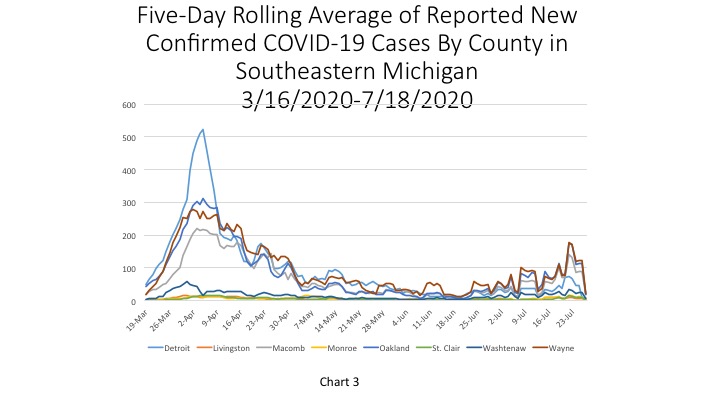
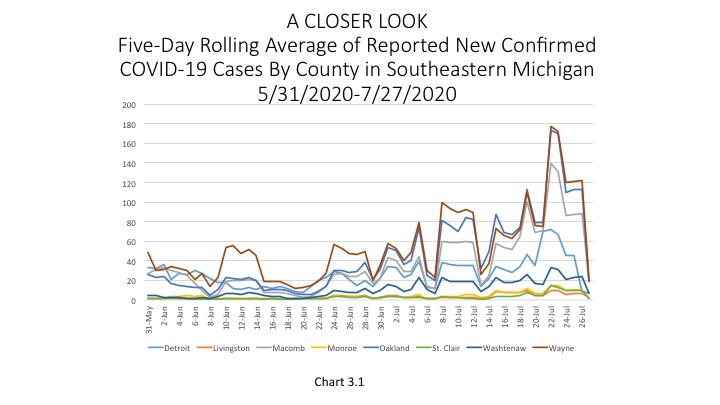
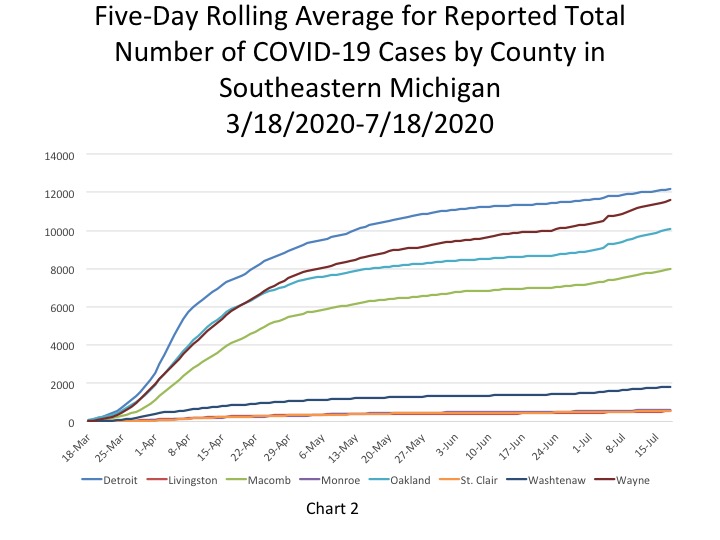
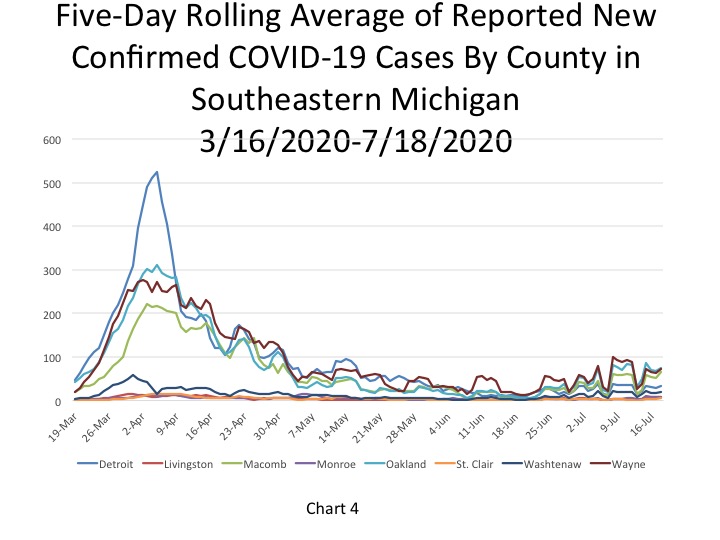
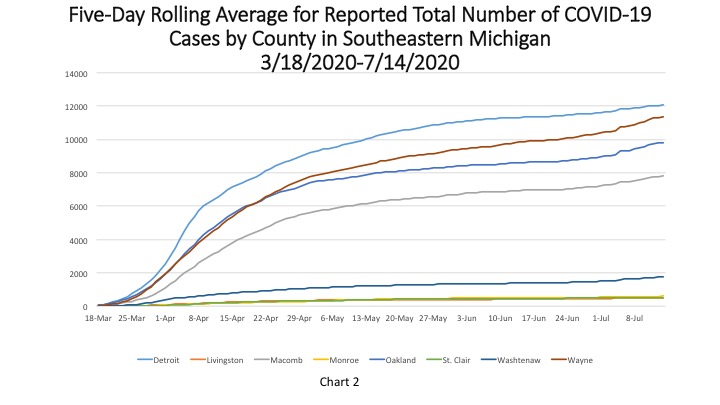
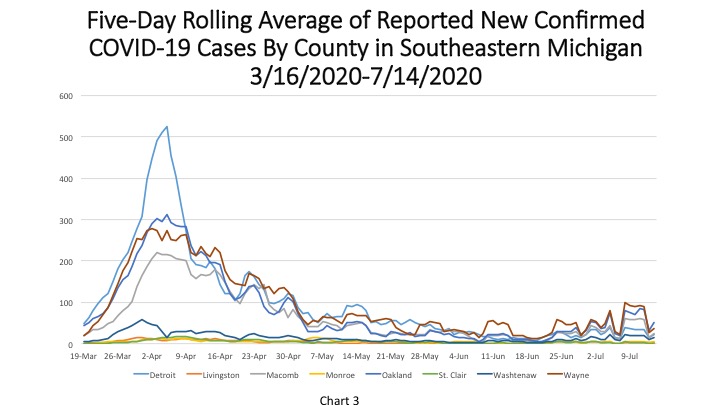
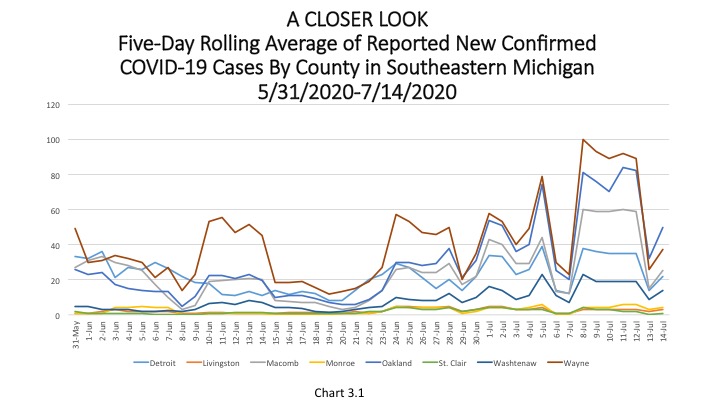
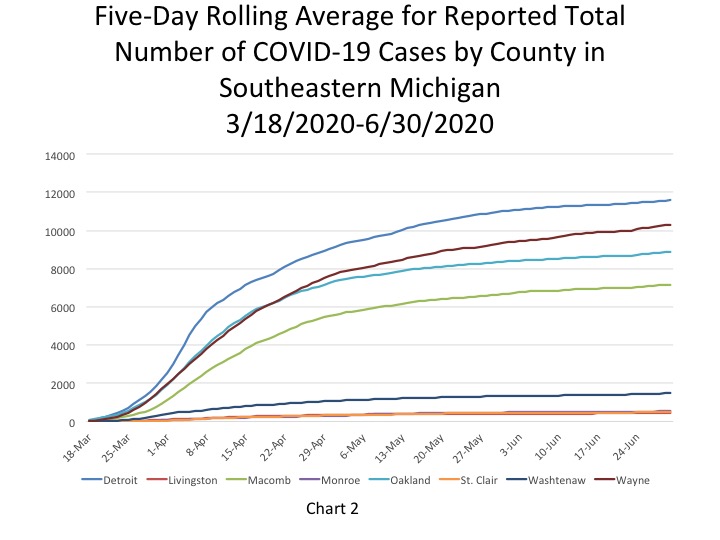
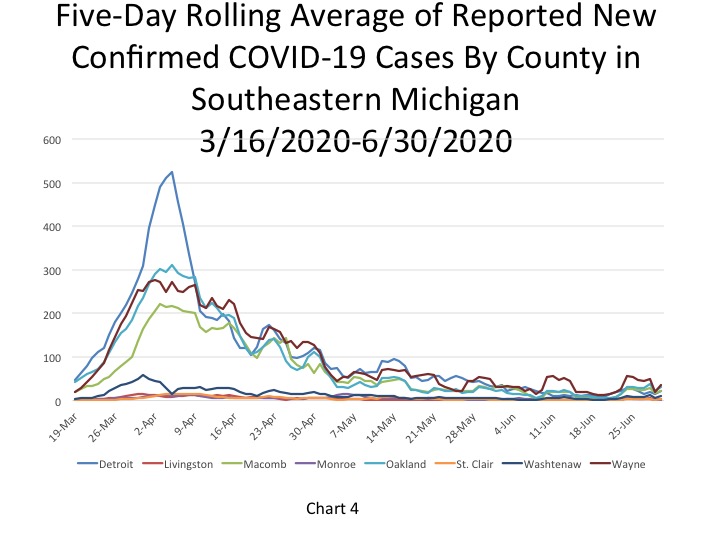
Chart 2 shows that, based on the five-day rolling averages, the growth of new COVID cases in Southeastern Michigan continues to increase, with the numbers in Wayne County now reaching above those in Detroit. On July 27, Wayne County’s numbers reached 12,589, which was above Detroit’s reported number of COVID cases at 12,574. Charts 3 and 3.1 show the new daily COVID case numbers and reflect a spike on July 22, followed by decreases in the number of new daily COVID numbers. On July 27, which is reflective of 5-day rolling average data, Wayne County reported the highest number of new cases at 20.
The daily data highlighted in these posts is from Michigan.gov/coronavirus, where data is updated daily at 3 p.m. Historical data were supplied from covidtracking.com, which republishes COVID data from the State. Additionally, the case totals do not reflect the number of people who have recovered, just those who have been infected. In early June the State changed how it reports its data on the website, making data more accurate in the long-term but more complicated to track as well. The State regularly updates older data and as we continue to publish regular updates on COVID the State’s changes to past data many not always be reflected in our posts. The data published in new posts is accurate for the day we received it on though.
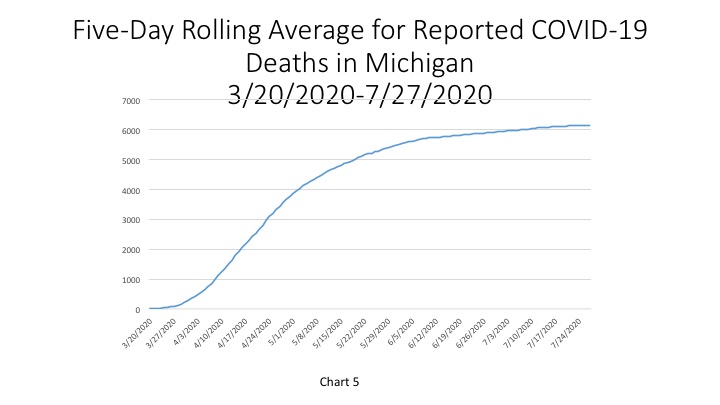
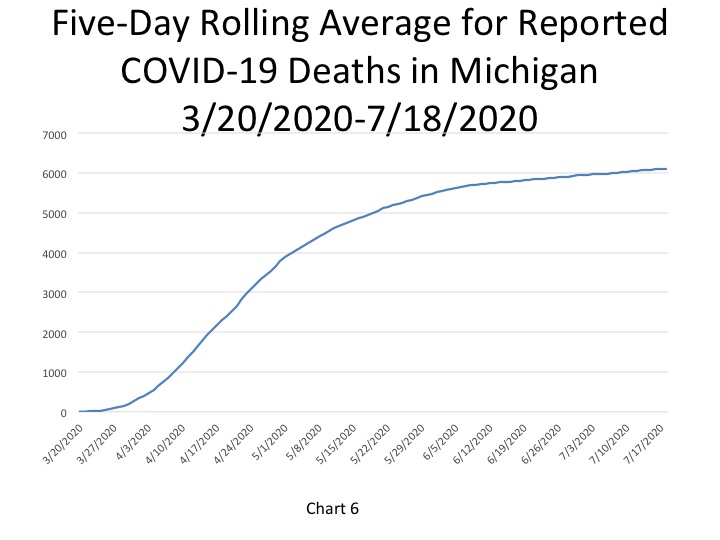
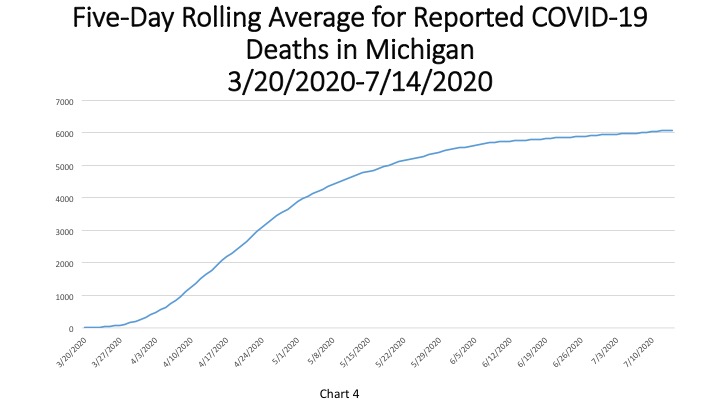
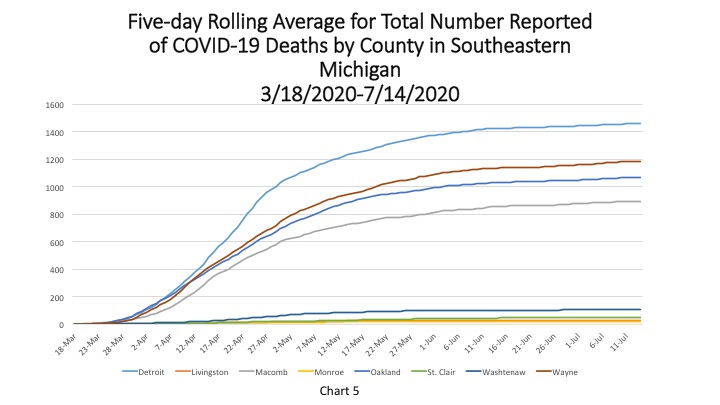
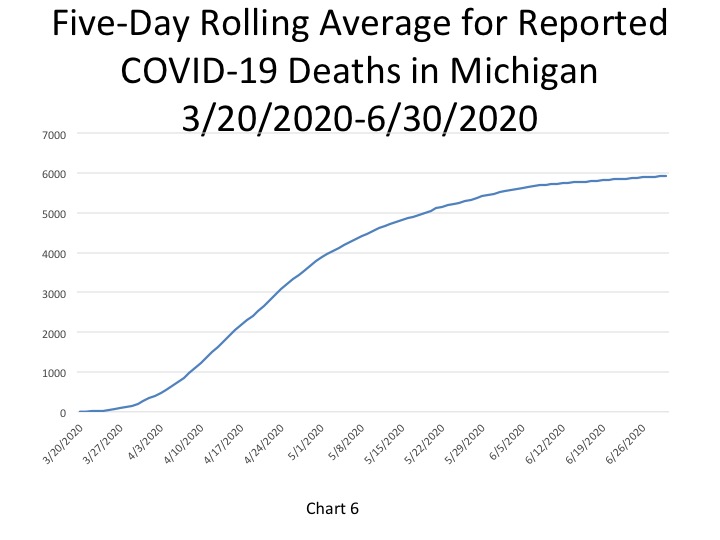
In Chart 5, the five-day rolling average for the number of deaths in Michigan, shows the cumulative number of deaths in the State of Michigan reached 6,159 on July 27. The actual cumulative COVID-19 deaths on July 29 was 6,172, an increase of 2 deaths from the prior day.
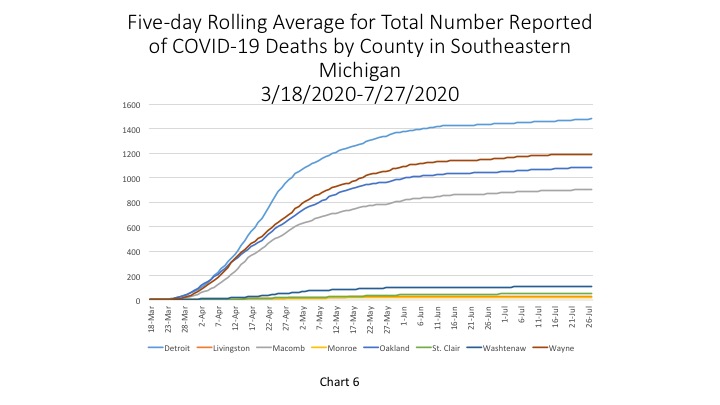
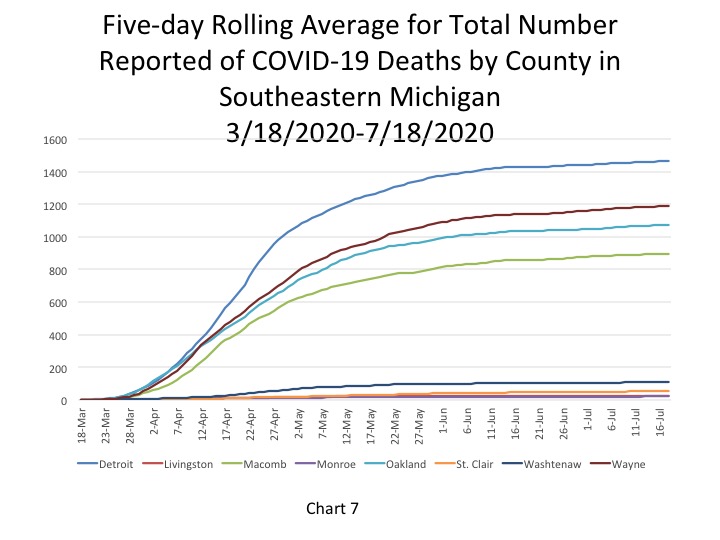
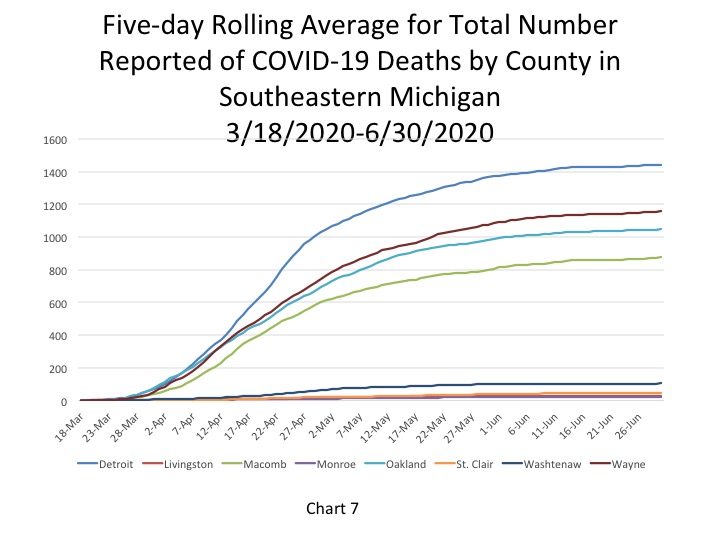
Chart 6 (a 5-day rolling average) details how the majority of COVID deaths in Michigan have occurred, and continue to occur, in Southeastern Michigan. On July 27, the City of Detroit reported 1,480 deaths. Wayne County had the second highest total at 1,192 deaths on July 27.
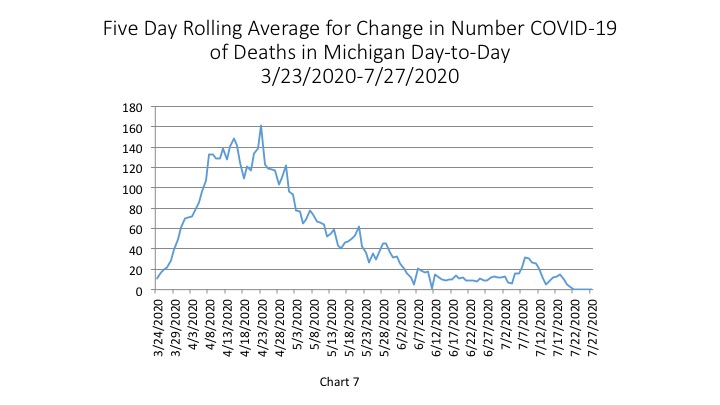
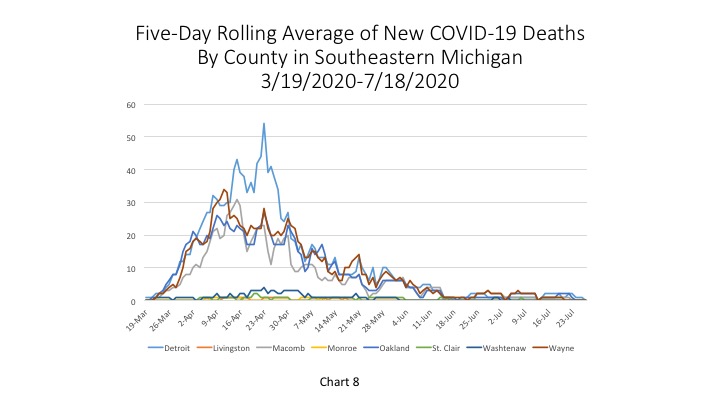
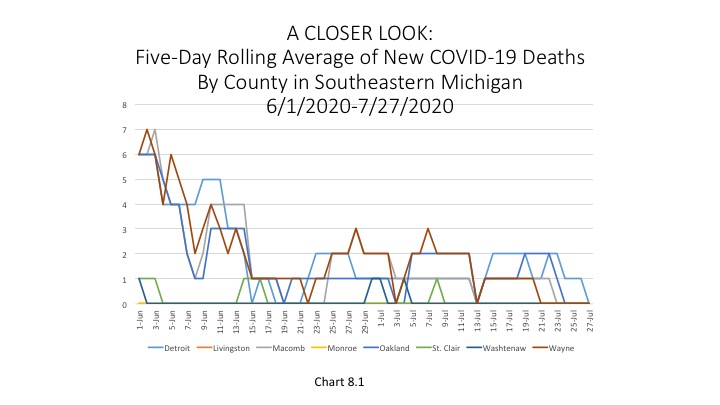
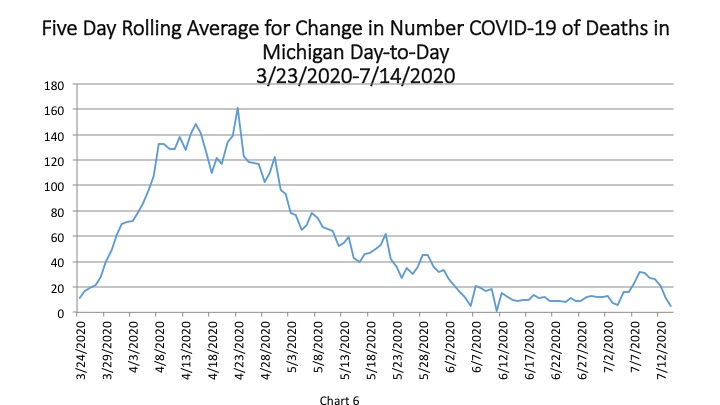
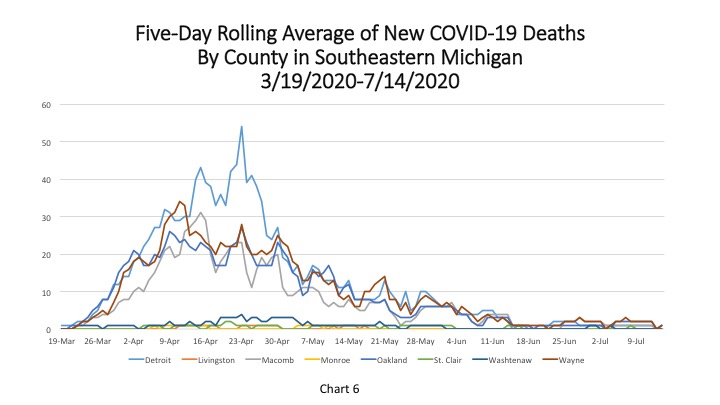
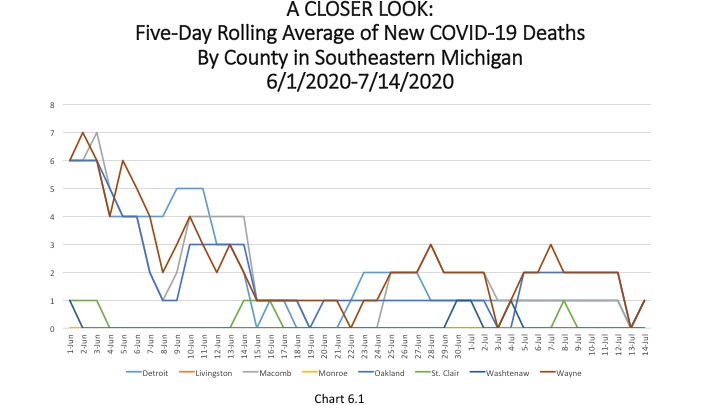
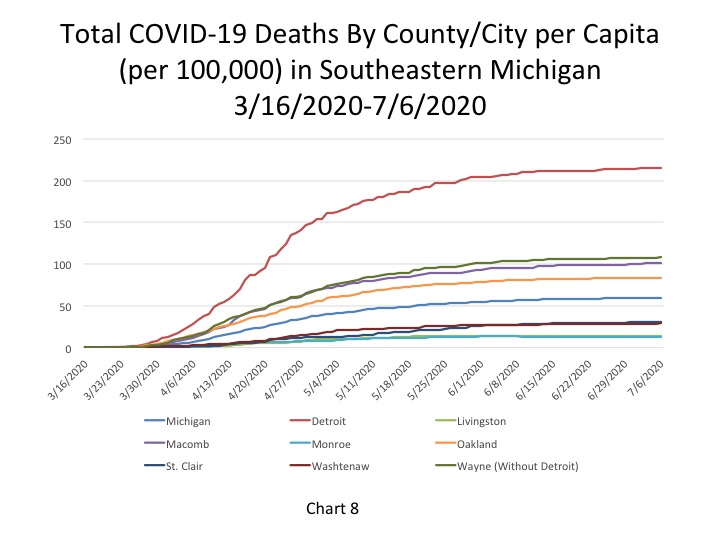
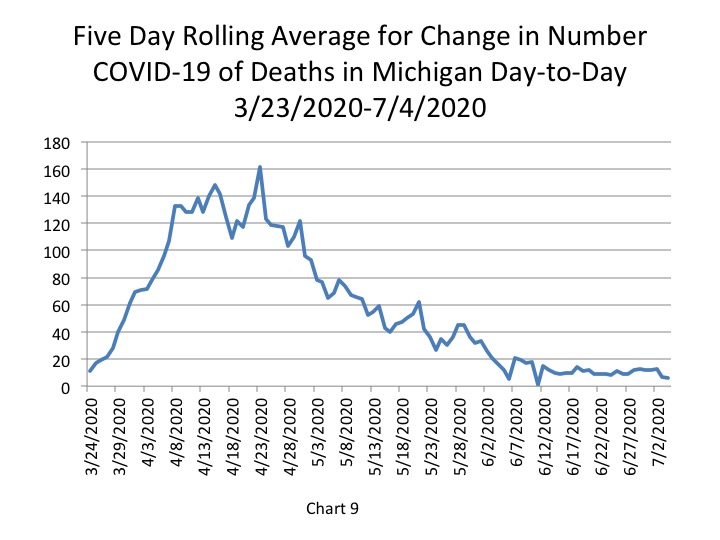
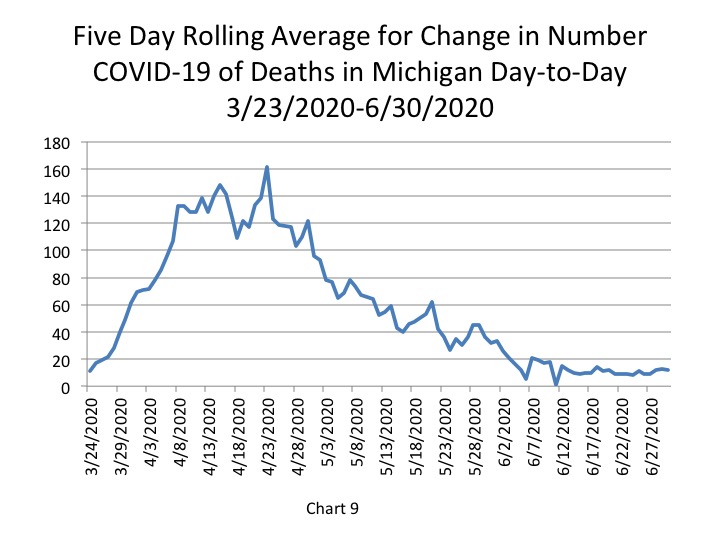
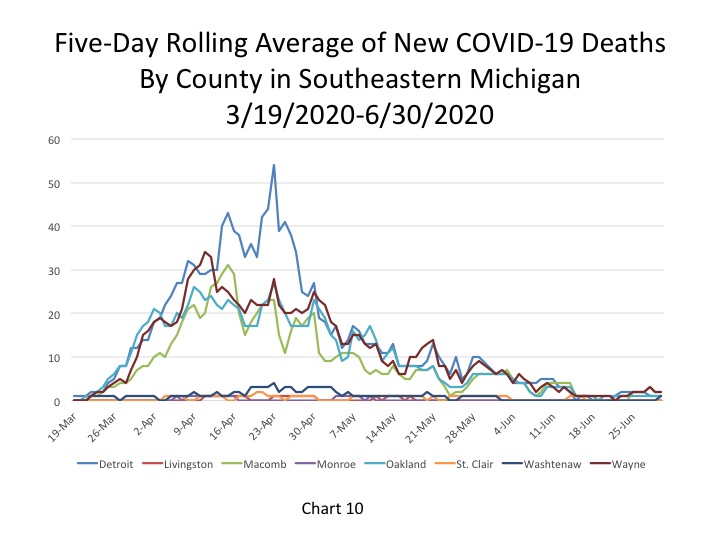
Chart 7, the five day rolling average of deaths, shows the number of new statewide deaths was reported at zero on July 27. Chart 8 and Chart 8.1 shows how the number of deaths in Southeastern Michigan have fallen to zero.
On July 20, the State of Michigan reported a total of 74,152 cases, an increase of 489 cases from the day prior. In terms of the number of new daily cases, the 489 new COVID cases reported on July 20 is a small increase from the 483 new cases reported on July 19. Of the new 489 new COVID cases, 202 were documented in Southeastern Michigan. In total, 41 percent of the new COVID cases were in Southeastern Michigan, meaning case numbers are increasing at a higher rate outside of the region than locally. In Chart 1 we show that the State total for the number of COVID cases on July 18 was 73,068–a five-day rolling average. The five-day rolling average for the total number of COVID cases (Chart 1) reflects a smoother curve and adjusts for fluctuations in testing and/or the quality of reporting or failure to report.
Chart 2 shows that, based on the five-day rolling averages, the growth of new COVID cases in Southeastern Michigan continues to increase, with the numbers in Wayne County continuing to inch closer to those being reported in Detroit. On July 18, Wayne County’s numbers reached 11,595. Detroit, which continues to have the highest overall number of cases, reported 12,178 COVID cases as of July 18. Oakland County reported 10,110 cases and Macomb County reported 8,013.
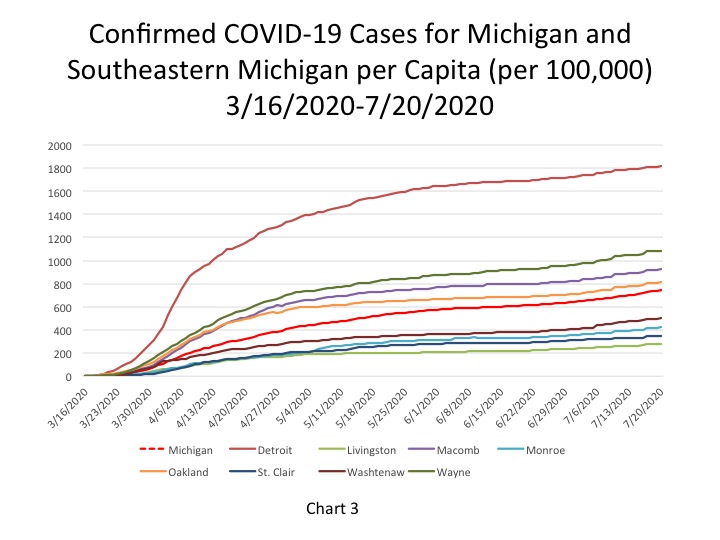
The City of Detroit had 1,817 COVID cases per 100,000 people as of July 20, an increase from 1,812 on July 19 (Chart 3). This is based upon a reported increase of 32 new COVID cases between July 19 and July 20, bringing the total number of COVID cases in Detroit to 12,223. Wayne County reported 11,085 cases per 100,000 people, and Oakland County had 810 cases per 100,000 people. These per capita rates were based upon 11,686 total cases for Wayne and for 10,191 Oakland. Macomb County reported 928 cases per 100,000 people, which is based upon 8,107 cases.
The daily data highlighted in these posts is from Michigan.gov/coronavirus, where data is updated daily at 3 p.m. Historical data were supplied from covidtracking.com, which republishes COVID data from the State. Additionally, the case totals do not reflect the number of people who have recovered, just those who have been infected. In early June the State changed how it reports its data on the website, making data more accurate in the long-term but more complicated to track as well. The State regularly updates older data and as we continue to publish regular updates on COVID the State’s changes to past data many not always be reflected in our posts. The data published in new posts is accurate for the day we received it on though.
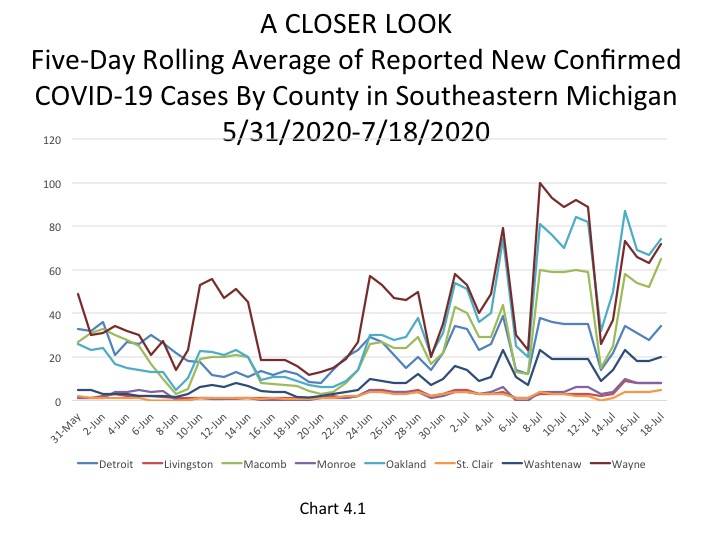
Chart 4 shows that Oakland County has been reporting the highest number of daily cases, according to the five-day rolling average, in about the last week. On July 18, Oakland County reported 74 new daily cases; Chart 4.1 also shows this, but at a more zoomed in level. The charts also show that Detroit reported 34 new cases on July 18, which is lower than the new cases reported out of Macomb and Wayne counties as well. Macomb County reported 62 new cases and Wayne County reported 72.
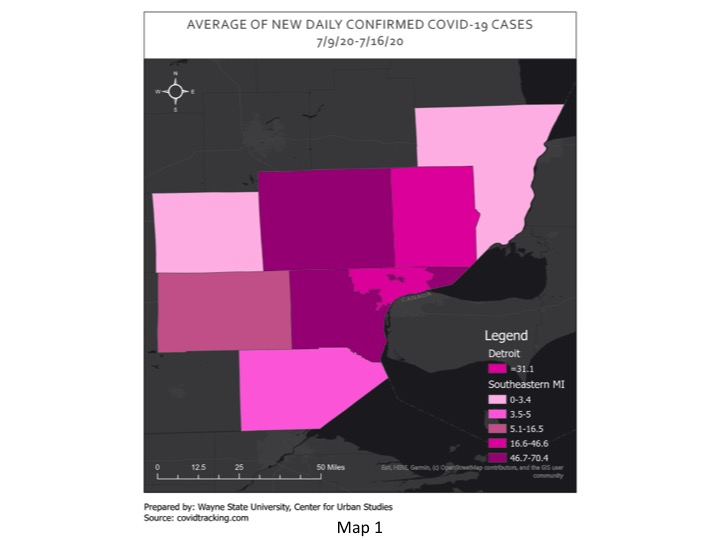
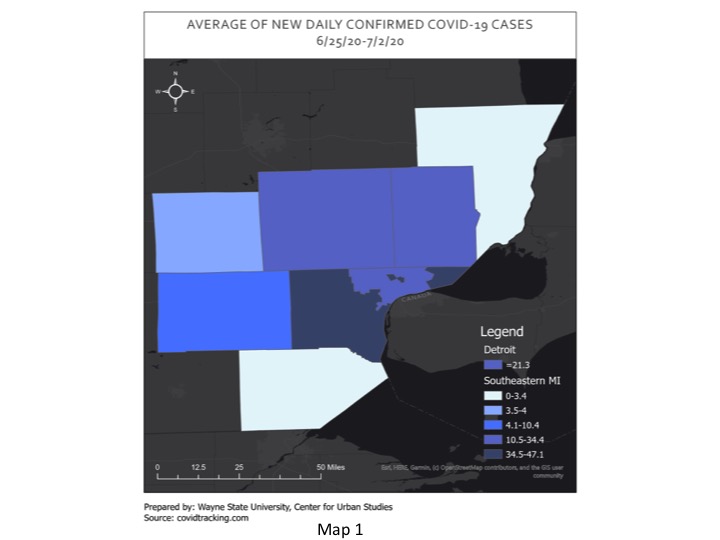
Map 1, which shows the average number of new daily COVID cases between July 9 and July 16 for Southeastern Michigan, highlights how Wayne County had the highest average number of new cases at 70.4, but Oakland County was right behind it with an average of 68.8. new cases. The map also shows that for Detroit the average number of new cases last week was 31.1 and it was 46.6 for Macomb County. As the data above shows, all four of those entities, and the remaining counties in the region all reported lower average weekly numbers for new daily COVID cases between July 9-16 than what was reported on July 18.
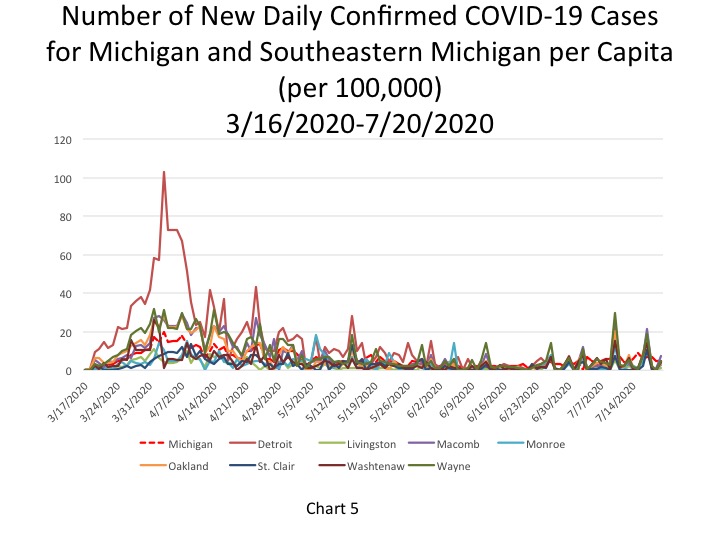
On July 20, the per capita rate for the number of new daily COVID cases per 100,000 people was 5 for the State, which was equivalent to 482 new cases (Chart 5). Detroit and Wayne County also each reported a per capita rate of 5 new daily COVID cases per 100,000 people on July 20, which was equivalent to 32 and 50 new cases, respectively. Macomb County was the only entity in the region to report a higher per capita rate than the State. Macomb County reported a per capita rate of 7 which was equivalent to 65 new daily cases. Oakland County reported a per capita rate of which was equivalent to 42 new cases. In Southeastern Michigan there were 202 new COVID cases reported on July 20.
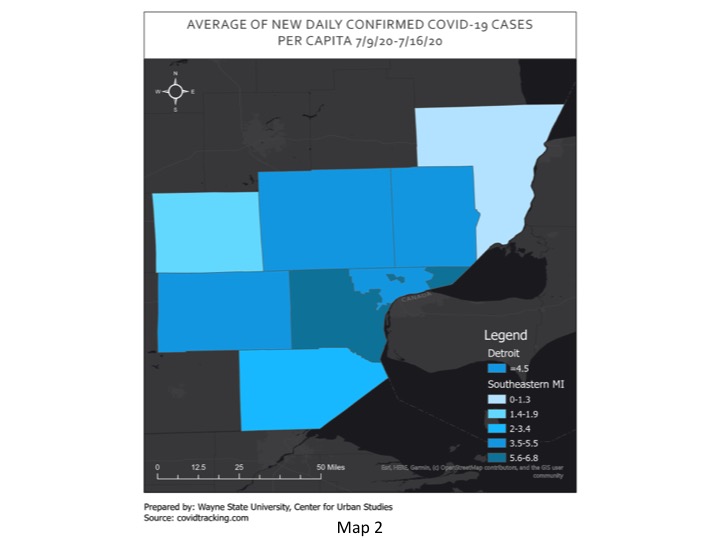
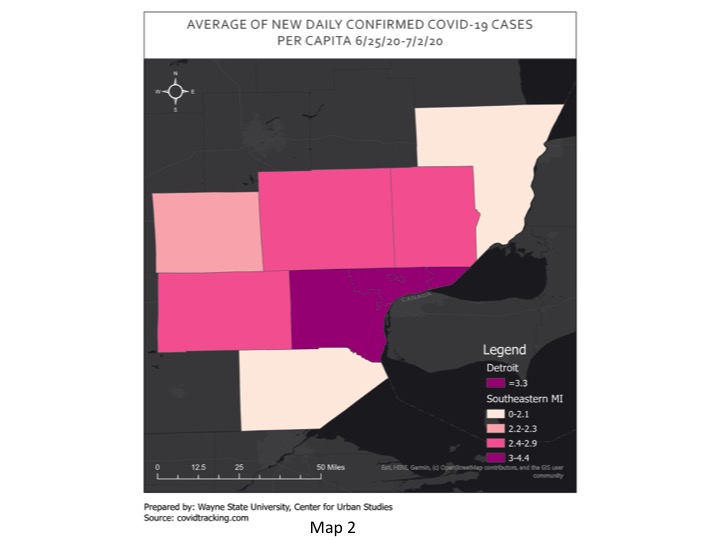
Map 2 mimics the message of Map 1, with Wayne County having the highest average number of daily confirmed COVID cases per 100,000 between July 9 and July 16. During that week Wayne County had an average of 6.8 daily COVID cases per 100,000 people. Detroit averaged a per capita rate of 4.5 during that time frame.
In Chart 6, the five-day rolling average for the number of deaths in Michigan, shows the number of deaths in the State of Michigan reached 6,114 on July 18. The actual cumulative COVID-19 deaths on July 20 was 6,126, an increase of 7 deaths from the prior day. Of the 7 deaths that were reported on July 20, 4 occurred in Southeastern Michigan.
Chart 7 (a 5-day rolling average) further hones in on where the majority of the COVID deaths in Michigan have occurred, and continue to occur, in Southeastern Michigan. As of July 18, the City of Detroit had reported 1,467 deaths. Wayne County had the second highest total at 1,190 deaths on July 18.
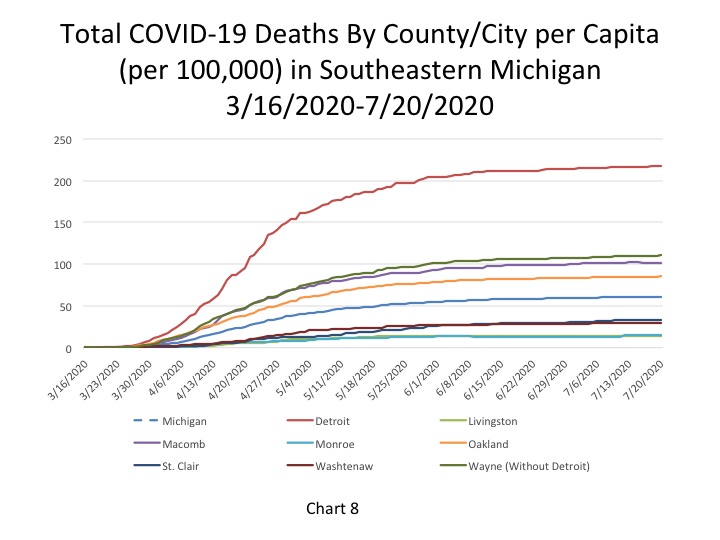
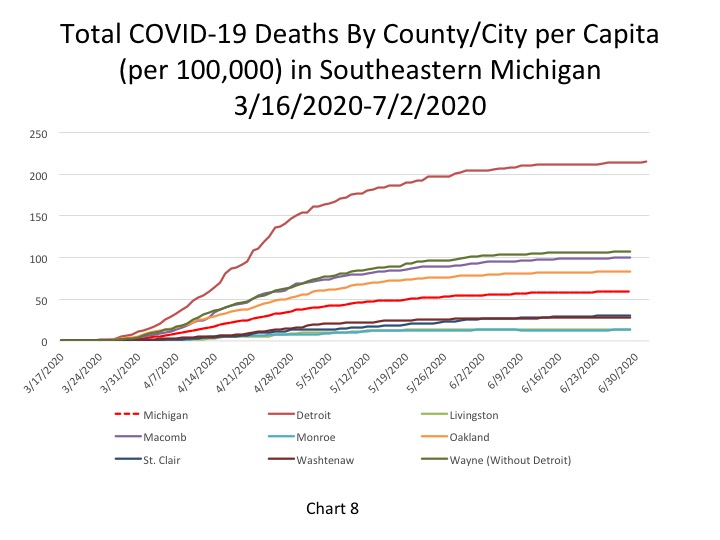
The per capita rates for the number of total COVID deaths in Southeastern Michigan continues to remain fairly stagnant across the region. Detroit reported 218 total COVID deaths per 100,000 people on July 20, which was equivalent to 1,468 deaths. Wayne County reported a per capita rate of 111 (1,191 deaths), Macomb County reported a per capita rate of 103 (892 deaths) and Oakland County reported a per capita rate of 86 (1,076 deaths). The State of Michigan reported a per capita rate for the number of total COVID deaths at 61 per 100,000 people, which was equivalent to 6,126 total deaths.
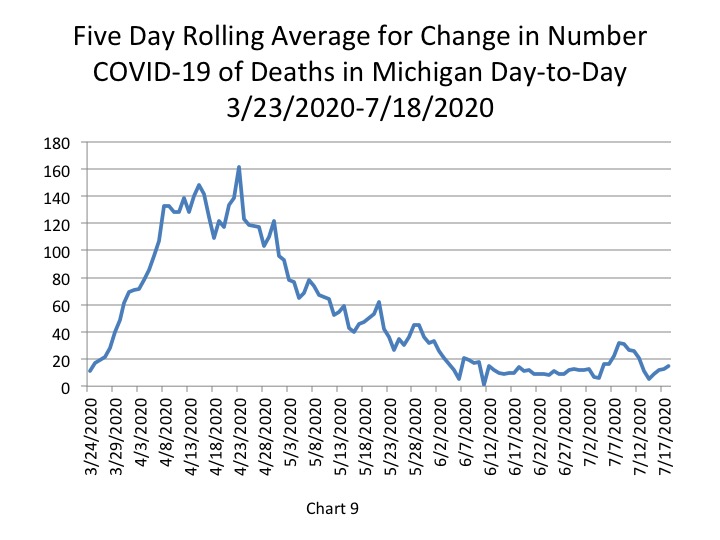
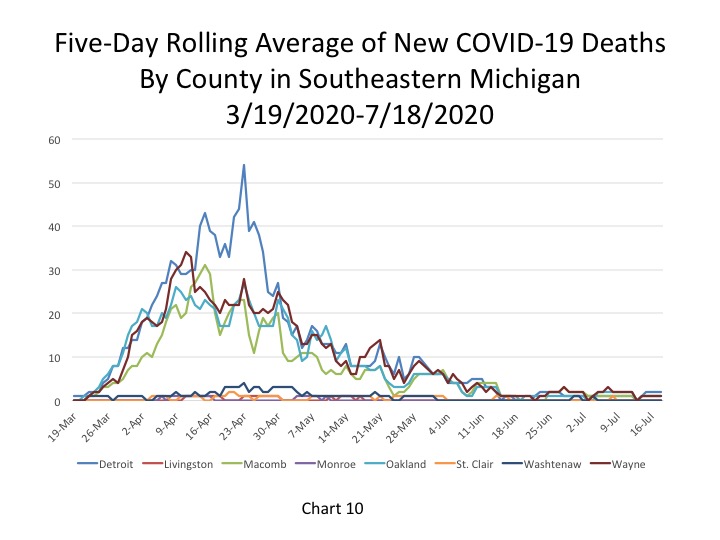
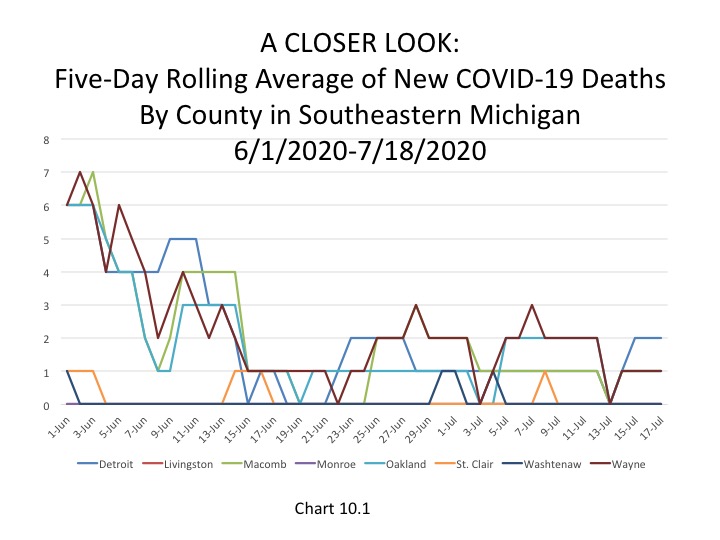
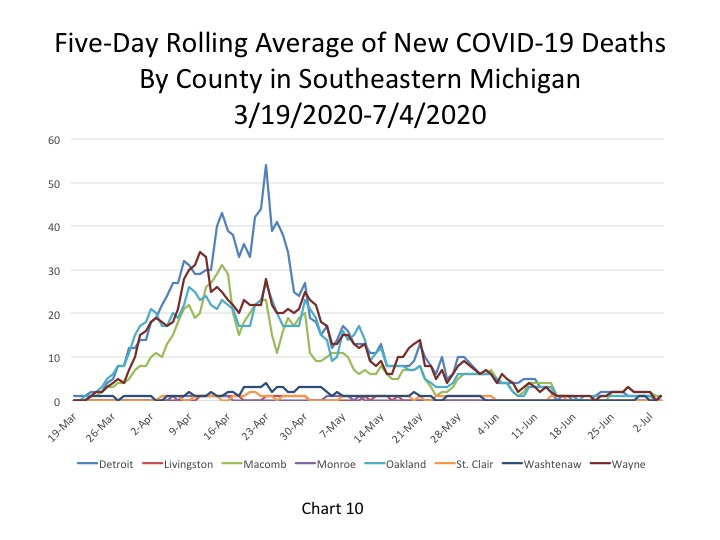
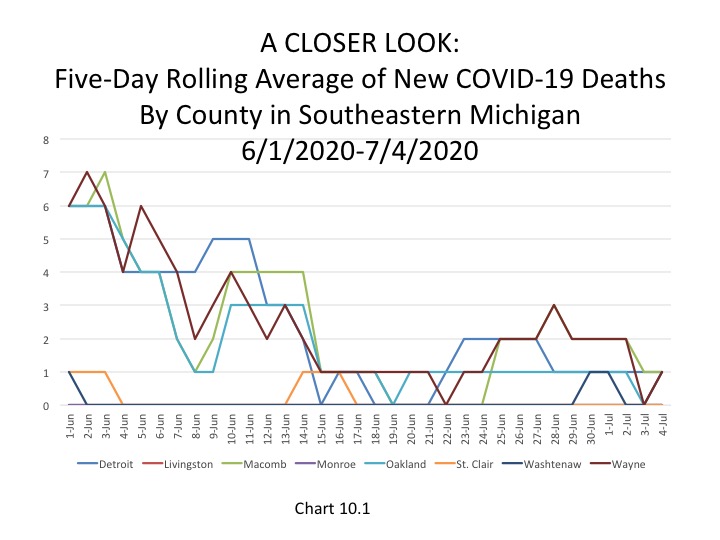
Chart 9, the five day rolling average of deaths, shows the number of new statewide deaths was reported at 15 on July 18. Furthermore, Chart 10 and Chart 10.1 shows how the number of deaths in Southeastern Michigan continues to remain low. Chart 10.1 shows a more in-depth look at the number of new daily COVID deaths in the last month so viewers can better discern where in the Southeastern Michigan the numbers are increasing, decreasing or remaining the same. Detroit reported 2 new daily deaths on July 18 while Macomb, Oakland and Wayne each reported 1.
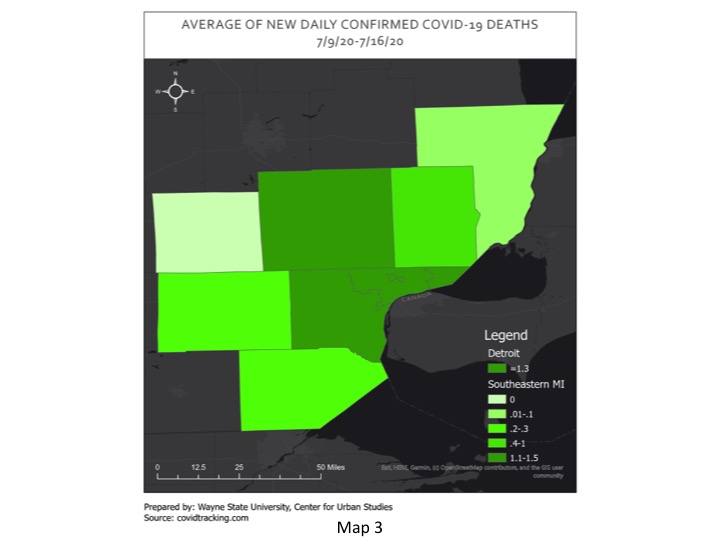
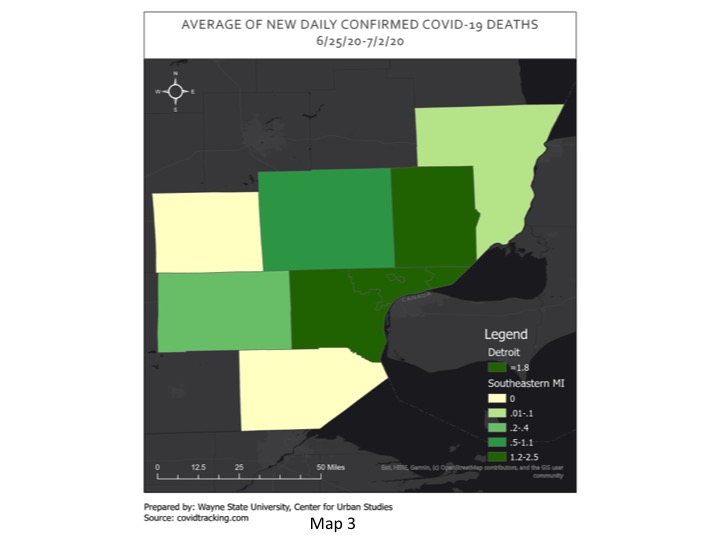
In Map 3, Wayne and Oakland counties had the highest average number of daily COVID deaths between July 9 and July 16 at 1.5 and Detroit averaged 1.3 deaths. Macomb County averaged 1 death during that time frame. The averages last week reported in the map are similar to the daily death numbers that have been being reported in Southeastern Michigan.
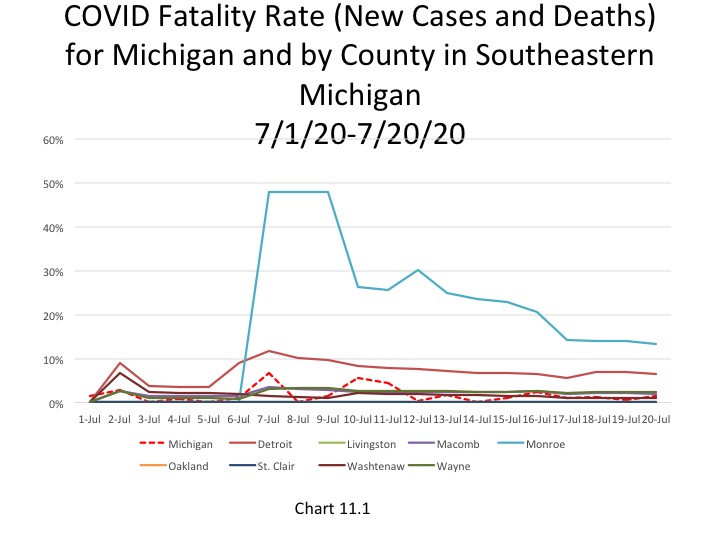
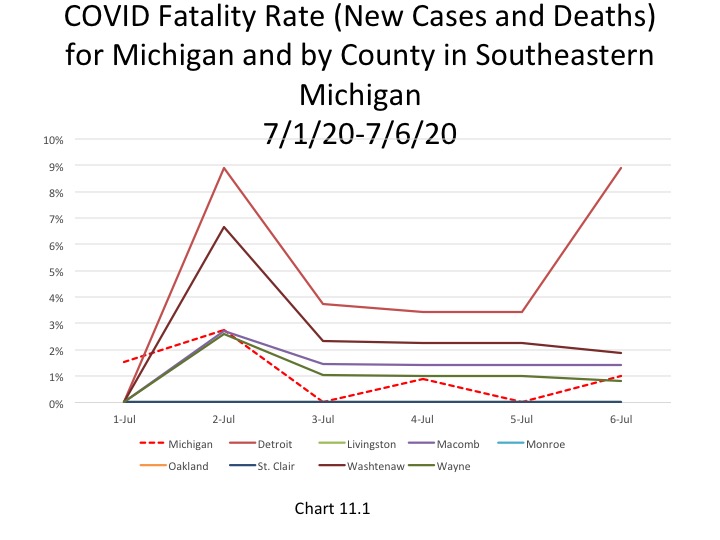
Chart 11.1 shows the fatality rate for just the month of July with the cumulative number of new cases and deaths for only this month. This chart was created in recognition that case and death numbers are lower than they were even a month ago and to highlight how even if case numbers spike death numbers continue to remain low. Using only July cumulative data for the new number of cases and deaths, Monroe County has recently had the highest fatality rate, which was reported at 13.4 percent on July 20, which is based on 13 new cumulative deaths since the beginning of July and 97 new cumulative cases. The overall fatality rate for most of the region is much higher than the new recent cumulative look we are exploring. For example, the City of Detroit had an overall fatality rate of 12 percent on July 20 but with a more recent look, which includes lower new daily case and death numbers, it was 6.45 percent (as shown in the chart below).
On July 20 the State of Michigan reported 489 new COVID cases, which is amongst the lowest daily total reported in about a week. With weekend numbers reaching close to 700, the decline is welcomed but also means we—as a State and a society—have a ways to go to get to a more manageable number of new daily case numbers.
The coronavirus pandemic has impacted the daily lives of everyone-from their work and school schedules to the way we obtain goods and services to how we recreate and interact with others. These changes directly relate to national and local mobility trends, especially since several Executive Orders in Michigan have either mandated or encouraged people to stay home and telecommute whenever possible.
The data we present here show the changes in mobility in Southeastern Michigan. These data were produced by Google, which is creating mobility reports for each State during this pandemic. The data presented below highlights the percent change in visits to places like grocery stores and parks in the seven counties that make up Southeastern Michigan. The list below is the percent change in mobility to these places between the first of April to mid-May for the State of Michigan. The maps below also reflect that timeframe and show the percent change in mobility trends at the county level for Southeastern Michigan compared to what baseline for mobility was to these places before the pandemic hit.
Shifts in Mobility Trends: Michigan
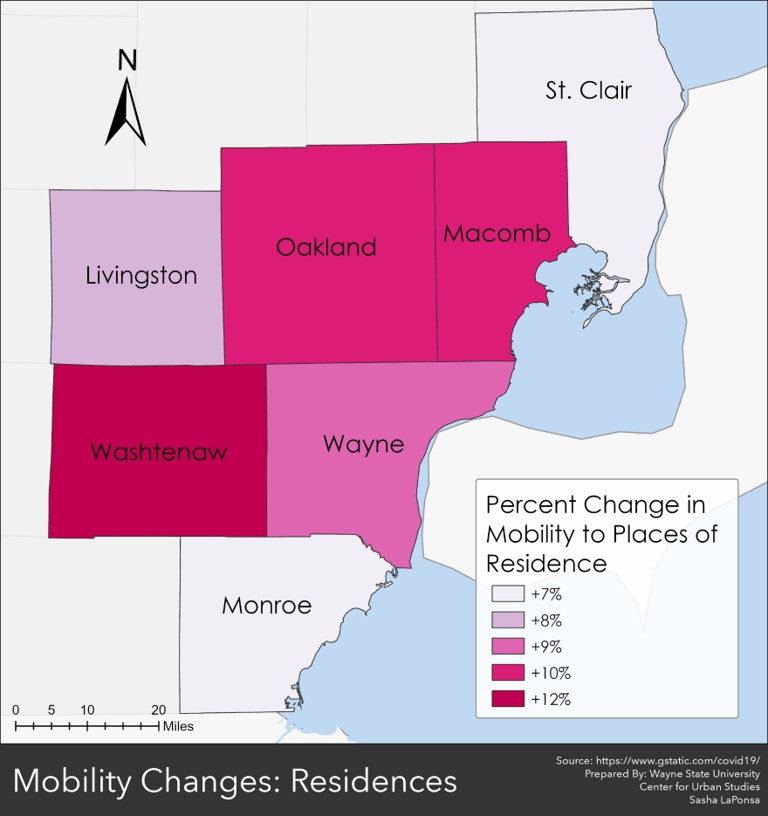
Residential: +8%
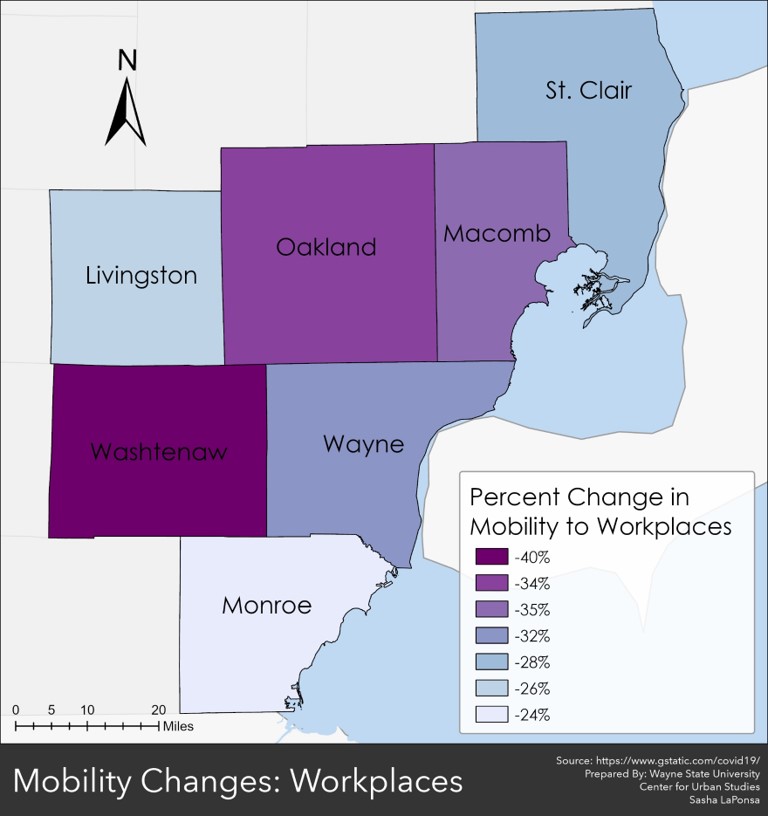
Workplaces: -28%
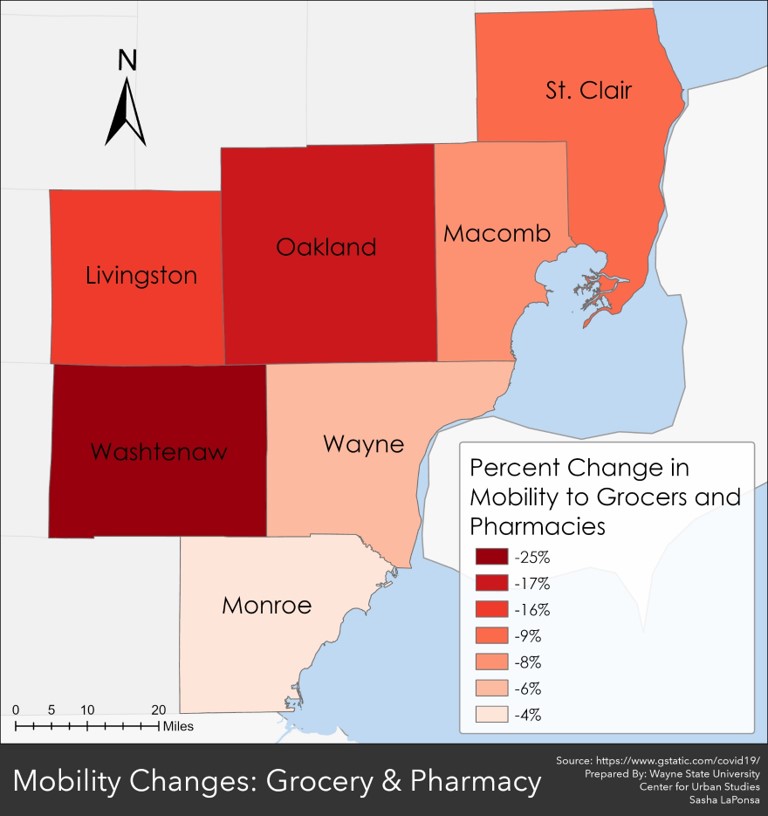
Grocery and pharmacy: -6%
Retail and recreation: -34%
Parks: +180%
Transit stations:-24%
Places of Residence
With the coronavirus pandemic came a statewide lockdown, which mandated people only leave their homes for necessities and not to visit with anyone outside of their homes, unless they were an essential worker. However, even with the mandate there was an increase in mobility between residences, statewide and locally. Statewide, there was an 8 percent increase in mobility to residential homes, and in Southeastern Michigan there was between a 7-12 percent increase, depending on the county. Washtenaw County had the highest percent increase in mobility between residences at 12 percent; St. Clair County had the lowest percent change at 7 percent. In Wayne County there was a 9 percent increase in mobility between residences, and in Macomb and Oakland counties there was a 10 percent increase.
Workplaces
As noted, the Governor’s emergency orders throughout the pandemic have required certain places of business to close and for others to allow for telecommuting whenever possible. With such policy shifts came a decline in mobility to workplaces all throughout Michigan. At the State level there was a 28 percent decline from the normal amount of mobility to workplaces, and throughout Southeastern Michigan there was between a 24-40 percent decline in mobility to workplaces between the beginning of April and mid-May. Washtenaw County had the largest decline at 40 percent. In Wayne County there was a 32 percent decline in mobility to workplaces prior the coronavirus pandemic, in Oakland County there was a 36 percent decline, and in Macomb County there was a 35 percent decline. Monroe County had the smallest percent decline from the baseline at 24 percent.
Grocery Stores and Pharmacies
Between April and mid-May there was a decrease in mobility to grocery stores and pharmacies throughout Michigan, including in Southeastern Michigan. Washtenaw County experienced the largest decline at 25 percent while Monroe County’s shift was only 4 percent lower than the amount residents normally commute to these places. Although we witnessed bare shelves at the beginning of the pandemic, with certain product shortages continuing through today, the decline in mobility to these stores is not surprising as both consumers and businesses shifted to online and third party delivery services.
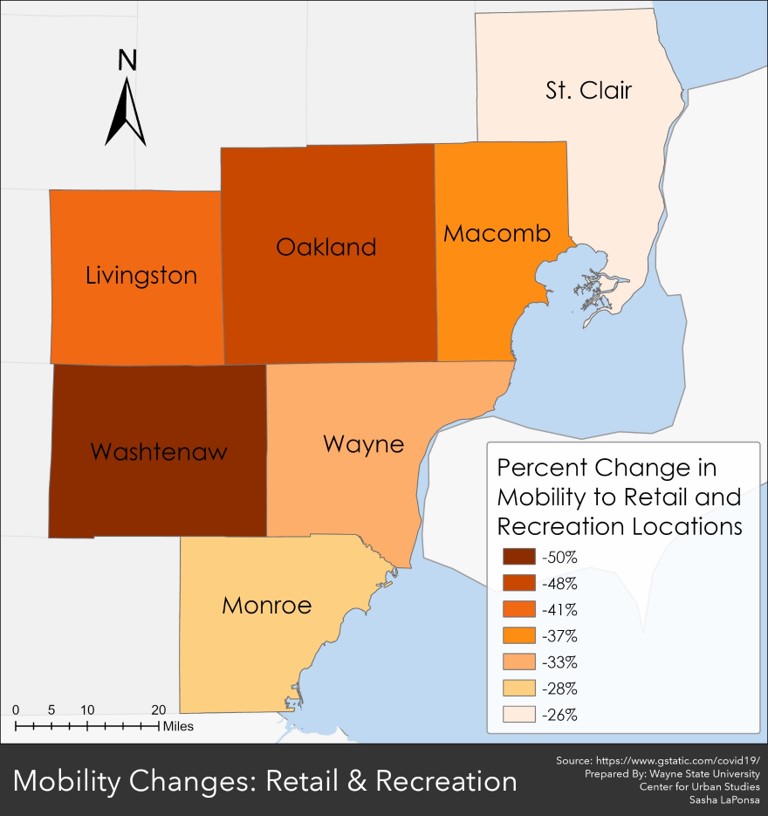
Retail and Recreation Locations
With the restrictions on business operations, including if they could even remain open to the public, it is also not surprising that at the State and local levels mobility trends have experienced a decline to retail and recreation locations. Washtenaw County again experienced the largest decline in mobility from the frequency residents were traveling before the pandemic to retail and recreation locations. According to the data, there was a 50 percent decline in commuting to retail and recreation locations for Washtenaw County. In Wayne County that decline was 33 percent, in Macomb County it was 37 percent, and in Oakland County it was 48 percent. At the State level there was a 34 percent decline from the baseline in the amount people traveled to retail and recreation locations.
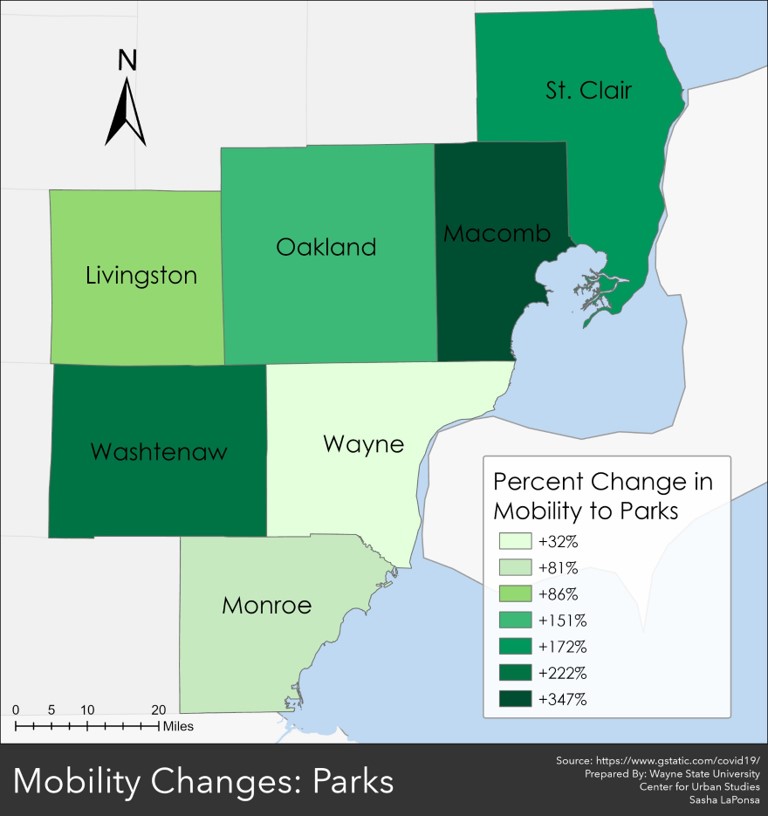
Parks
Similar to the trend being experienced at the State level, all counties in Southeastern Michigan have experienced an increase in mobility to parks. Wayne County experienced the smallest percent change at 32 percent while Macomb County experienced the largest percent change at 347 percent. There were three counties-Macomb, St. Clair and Washtenaw – where mobility to parks increased at a higher rate than the mobility rate increase at the State level (180 percent).
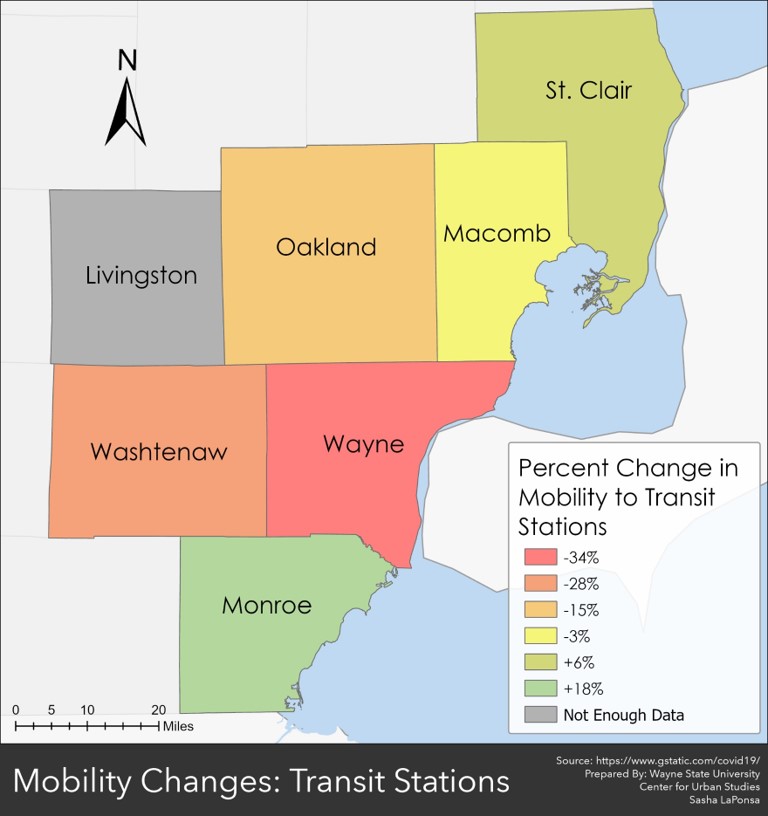
Transit Stations
The data also shows that there was a decrease in mobility to transit stations throughout most of Southeastern Michigan, but not the entire region. In Monroe and St. Clair counties there was an 18 and 6 percent increase in mobility, respectively. In Wayne County, which provides public transportation via both the Detroit Department of Transportation and the Southeastern Michigan Authority of Regional Transit (SMART) mobility to these stations decreased by 34 percent. There are also communities in Oakland County and all of Macomb County that offers public transportation via SMART; mobility to these stations declined by 15 percent and 3 percent, respectively. In Washtenaw County, where there is also a local transportation system, mobility to these stations declined by 28 percent. There was a 24 percent decline in mobility to transportation stations at the State level.
Overall, this data provides a glimpse into how the coronavirus pandemic has shifted certain aspects of our everyday ways of life. These current shifts could lead to long-term policy changes as we as a state and a nation are seeing that telecommuting, road diets and contactless shopping, among other changes, are possible. Pros and cons can be argued for the long-term impacts of such changes, however, decreases in commuting does mean a decline in certain pollutants being emitted, which is environmentally beneficial and a shift we need to implement for the long-term viability of this planet.
Michigan, like many states throughout the U.S., continues to see new confirmed daily COVID case numbers that are higher than what was reported less than a month ago. On July 16, the State of Michigan reported 71,842 total COVID cases, an increase of 645 cases from the day prior. In terms of the number of new daily cases, the 645 reported on July 16 was a decrease from the 891 new cases reported on July 15. Also, of the 645 new COVID cases, 324 were documented in Southeastern Michigan. In total, 50 percent of the new COVID cases were in Southeastern Michigan. Up until the last few days, in recent weeks majority of the new case numbers in Michigan were occurring outside of Metro-Detroit region. In Chart 1 we show that the State total for the number of COVID cases on July 14 was 70,481–a five-day rolling average. The five-day rolling average for the total number of COVID cases (Chart 1) reflects a smoother curve and adjusts for fluctuations in testing and/or the quality of reporting or failure to report. A closer look at Chart 1 shows how the once flattened curve has been increasing at a higher rate since late June, with case numbers now about 70,000.
Chart 2 shows that, based on the five-day rolling averages, the growth of new COVID cases in Southeastern Michigan continues to increase, with noticeable upticks particularly in Wayne and Oakland counties. On July 14 Wayne County reported 11,323 confirmed COVID cases and Oakland County reported 10,063. Between June 24 (when new case numbers began to rise again) and July 14 Wayne County reported 1,260 new cases and Oakland County reported 1,043 new cases. On July 14, Detroit, which still has the highest total number of confirmed COVID cases, reported 11,461 cases. However, since June 24 Detroit has reported about half of the new number of COVID cases that Wayne County has. Between June 24 and July 14 Detroit reported 584 new cases. On July 14 Macomb County reported 7,784, an increase of 753 new cases since June 24.
As noted, new daily COVID case numbers have been increasing at a faster rate in July than in June. The two five-day rolling average charts below (Chart 3 and Chart 3.1) show that up through early June daily COVID case numbers were declining, but since about June 24 those numbers have been on the rise. A little over a week ago is when daily case numbers really began to spike. However, on July 14 there was a decline from the number of new daily cases reported by the State from the days prior; this is on trend with the fact that the State of Michigan had a lower number of new COVID cases than the previous day. Oakland County had the highest number of new daily cases on July 14 at 50, with Wayne County following at 37. Detroit reported 22 new cases and Macomb County reported 25 new cases.
While the number of new daily COVID cases has been experiencing an overall increase over the last few weeks, the cumulative number of COVID deaths has remained low and fairly stagnant. The State reported on July 16 there was a cumulative total of 6,101 COVID deaths, an increase of 16 deaths from the day prior. Of those 16 deaths, 13 were added to the daily count as a result of death certificates being compared with the State’s COVID database. Additionally, of those 16 total deaths, 12 were reported out of Southeastern Michigan.
In Chart 4, the five-day rolling average for the number of deaths in Michigan, shows the number of deaths in the State of Michigan continued to slowly inch toward 6,081.
Chart 5 (a 5-day rolling average) further hones in on how majority of the COVID deaths in Michigan have occurred, and continue to occur, in Southeastern Michigan. On July 14, the City of Detroit reported 1,459 deaths. Wayne County had the second highest total at 1,185 deaths on July 14.
Chart 6, the five day rolling average of deaths, shows the number of new statewide deaths was reported at 5 on July 14. Furthermore, Chart 7 and Chart 7.1 shows how the number of deaths in Southeastern Michigan continues to remain low, with a noticeable decrease beginning to occur on June 15. Chart 10.1 shows a more in-depth look at the number of new daily COVID deaths in the last month so viewers can better discern where in the Southeastern Michigan the numbers are increasing, decreasing or remaining the same. Detroit, Macomb, Oakland and Wayne counties each reported 1 new death on July 14; these were the only new deaths reported in the region. As Chart 10.1 highlights, no more than 7 new daily deaths have been reported since June 1 and those numbers have not reached above 3 since July 7. Due to Detroit and Wayne County reporting the same numbers on some dates it may appear that the Detroit line does not go all the through, however this is just due to the fact that the Wayne County data points are the same.
Michigan has not been immune to the national trend of confirmed daily COVID case increases. With new daily numbers hovering above 400, and beyond, for the last week we have seen Gov. Gretchen Whitmer roll back on her re-opening plan and institute a public face mask mandate to help ensure residents’ safety and a decline in the spread of the virus. However, neither can be ensured if the public doesn’t adhere to the laws and standards set forth by local, state and federal government agencies.
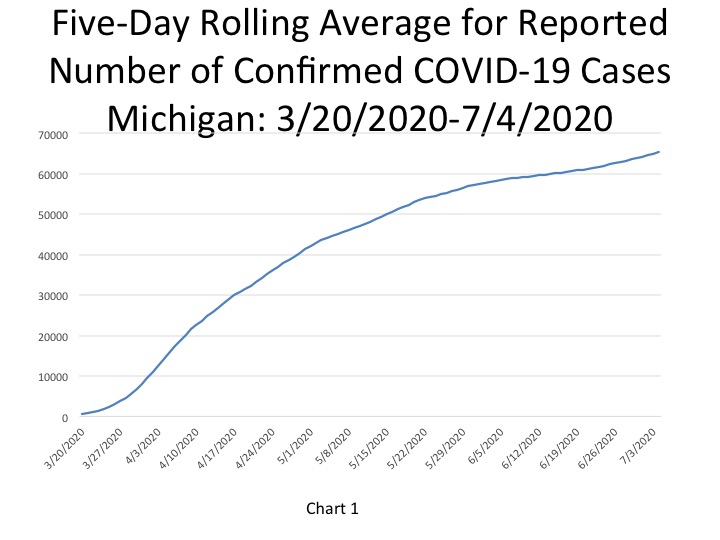
On July 6, the State of Michigan reported a total of 66,173 cases, an increase of 297 cases from the day prior. In terms of the number of new daily cases, the 297 new COVID cases reported on July 6 is a decrease from the 543 new cases reported on July 5. Of the new 297 new COVID cases, 97 were documented in Southeastern Michigan. In total, 33 percent of the new COVID cases were in Southeastern Michigan, meaning case numbers are increasing at a higher rate outside of the region than locally. In Chart 1 we show that the State total for the number of COVID cases on July 4 was 65,346–a five-day rolling average. The five-day rolling average for the total number of COVID cases (Chart 1) reflects a smoother curve and adjusts for fluctuations in testing and/or the quality of reporting or failure to report. A closer look at Chart 1 shows how the once flattened curve has been increasing at a higher rate since late June.
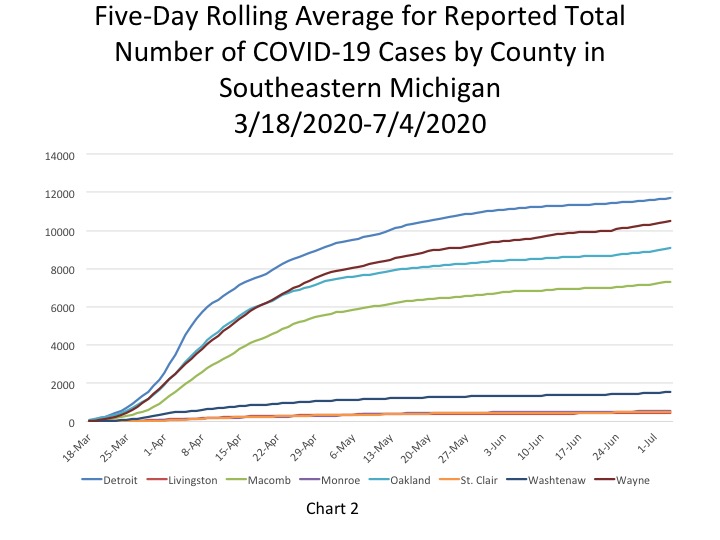
Chart 2 shows that, based on the five-day rolling averages, the growth of new COVID cases in Southeastern Michigan continues to increase, with a noticeable uptick particularly in Wayne County. On July 4, Wayne County’s numbers reached 10,514, an increase of 199 new cases since July 1. Detroit, which continues to have the highest overall number of cases, reported 11,697 COVID cases on July 4. Oakland County reported 9,081 cases and Macomb County reported 7,315.
The City of Detroit had 1,744 COVID cases per 100,000 people as of July 6, an increase from 1,741 on July 5(Chart 3). This is based upon a reported increase of 19 new COVID cases between July 5 and July 6, bringing the total number of COVID cases in Detroit to 11,728. Wayne County reported 982 cases per 100,000 people, and Oakland County had 725 cases per 100,000 people. These per capita rates were based upon 10,578 total cases for Wayne and for 9,123 Oakland. Macomb County reported 840 cases per 100,000 people, which is based upon 7,339 cases.
The daily data highlighted in these posts is from Michigan.gov/coronavirus, where data is updated daily at 3 p.m. Historical data were supplied from covidtracking.com, which republishes COVID data from the State. Additionally, the case totals do not reflect the number of people who have recovered, just those who have been infected. In early June the State changed how it reports its data on the website, making data more accurate in the long-term but more complicated to track as well. The State regularly updates older data and as we continue to publish regular updates on COVID the State’s changes to past data many not always be reflected in our posts. The data published in new posts is accurate for the day we received it on though.
On July 6, the State of Michigan reported a total of 66,173 cases, an increase of 297 cases from the day prior. In terms of the number of new daily cases, the 297 new COVID cases reported on July 6 is a decrease from the 543 new cases reported on July 5. Of the new 297 new COVID cases, 97 were documented in Southeastern Michigan. In total, 33 percent of the new COVID cases were in Southeastern Michigan, meaning case numbers are increasing at a higher rate outside of the region than locally. In Chart 1 we show that the State total for the number of COVID cases on July 4 was 65,346–a five-day rolling average. The five-day rolling average for the total number of COVID cases (Chart 1) reflects a smoother curve and adjusts for fluctuations in testing and/or the quality of reporting or failure to report. A closer look at Chart 1 shows how the once flattened curve has been increasing at a higher rate since late June.
Chart 2 shows that, based on the five-day rolling averages, the growth of new COVID cases in Southeastern Michigan continues to increase, with a noticeable uptick particularly in Wayne County. On July 4, Wayne County’s numbers reached 10,514, an increase of 199 new cases since July 1. Detroit, which continues to have the highest overall number of cases, reported 11,697 COVID cases on July 4. Oakland County reported 9,081 cases and Macomb County reported 7,315.
The City of Detroit had 1,744 COVID cases per 100,000 people as of July 6, an increase from 1,741 on July 5(Chart 3). This is based upon a reported increase of 19 new COVID cases between July 5 and July 6, bringing the total number of COVID cases in Detroit to 11,728. Wayne County reported 982 cases per 100,000 people, and Oakland County had 725 cases per 100,000 people. These per capita rates were based upon 10,578 total cases for Wayne and for 9,123 Oakland. Macomb County reported 840 cases per 100,000 people, which is based upon 7,339 cases.
The daily data highlighted in these posts is from Michigan.gov/coronavirus, where data is updated daily at 3 p.m. Historical data were supplied from covidtracking.com, which republishes COVID data from the State. Additionally, the case totals do not reflect the number of people who have recovered, just those who have been infected. In early June the State changed how it reports its data on the website, making data more accurate in the long-term but more complicated to track as well. The State regularly updates older data and as we continue to publish regular updates on COVID the State’s changes to past data many not always be reflected in our posts. The data published in new posts is accurate for the day we received it on though.
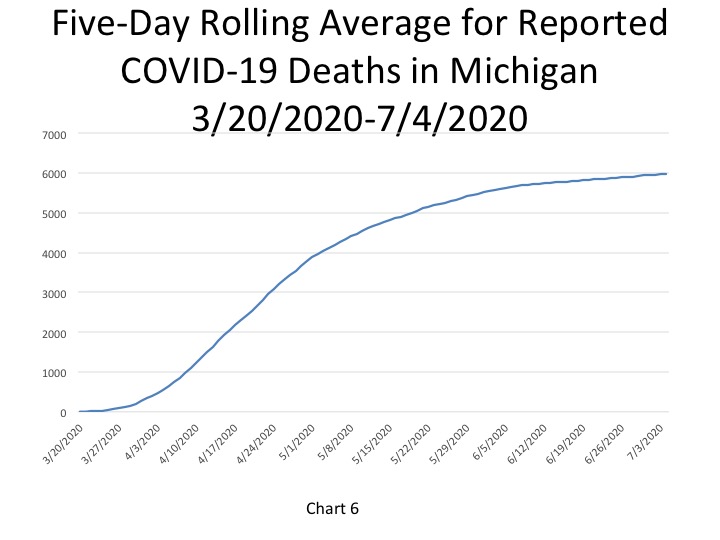
In Chart 6, the five-day rolling average for the number of deaths in Michigan, shows the number of deaths in the State of Michigan continued to slowly inch toward 6,000. On July 4, the cumulative deaths were 5,970 deaths (an increase of 6 deaths from the day prior). The actual cumulative COVID-19 deaths on July 6 was 5,975, an increase of 3 deaths from the prior day. Of the 3 deaths that were reported on July 6, all of them occurred in Southeastern Michigan.
Chart 7 (a 5-day rolling average) further hones in on how majority of the COVID deaths in Michigan have occurred, and continue to occur, in Southeastern Michigan. On July 4, the City of Detroit reported 1,445 deaths, the same number it reported the day prior. Wayne County had the second highest total at 1,164 deaths on July 4.
The per capita rates for the number of total COVID deaths in Southeastern Michigan continues to remain stagnant across the region as counties, and the City of Detroit, experience zero to minimal increases in COVID death numbers. Detroit reported 215 total COVID deaths per 100,000 people on July 6, which was equivalent to 1,445 deaths. Wayne County reported a per capita rate of 108 (1,166 deaths), Macomb County reported a per capita rate of 101 (882 deaths) and Oakland County reported a per capita rate of 83 (1,049 deaths). The State of Michigan reported a per capita rate for the number of total COVID deaths at 60 per 100,000 people, which was equivalent to 5,975 total deaths.
Chart 9, the five day rolling average of deaths, shows the number of new statewide deaths was reported at 6 on July 4. Furthermore, Chart 10 and Chart 10.1 shows how the number of deaths in Southeastern Michigan continues to remain low but also how the region is the largest contributor to the number of Statewide deaths. Chart 10.1 shows a more in-depth look at the number of new daily COVID deaths in the last month so viewers can better discern where in the Southeastern Michigan the numbers are increasing, decreasing or remaining the same. Macomb, Washtenaw and Wayne counties each reported 1 new death on July 4; these were the only new deaths reported in the region. As Chart 10.1 highlights, no more than 7 new daily deaths have been reported since June 1, and those numbers have dropped even lower in recent weeks.
In Map 3, Wayne County had the highest average number of daily COVID deaths between June 25 and July 2 at 2.5 and Macomb County averaged 2.4. Detroit and Oakland County were the only other two regional entities that averaged more than 1 death during that time frame. Detroit averaged 1.8 COVID deaths between June 25 and July 2 and Oakland County averaged 1.1.
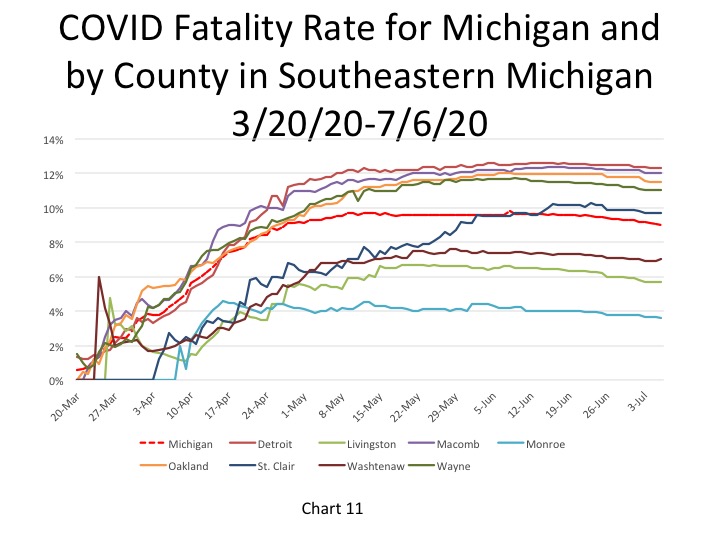
Chart 11 shows the overall fatality rates for Detroit, the counties that make up Southeastern Michigan and the State of Michigan. This large scale look shows that fatality rates continued to rise until about May and have remained fairly stagnant—generally within a percentage point—since then. On July 6 the State’s fatality rate was 9.3 percent and Detroit’s, which continues to be the highest, was 12.3 percent. While these fatality rates haven’t shown large signs of change, they are slowly decreasing throughout the region, except in St. Clair County.
Chart 11.1 shows the fatality rate for just the month of July with the cumulative number of new cases and deaths for only this month. This chart was created in recognition that case and death numbers are lower than they were even a month ago and to highlight how even if case numbers spike death numbers continue to remain low. Using only July cumulative data for the new number of cases and deaths, Detroit continues to have the highest fatality rate at 9 percent and Washtenaw County has the second highest at 1.8 percent. The fatality rate for the State was 1 percent on July 6.
Michigan COVID numbers continue to increase by more than 200 cases a day over the last week, with a spike even higher likely to come after parties such as the one at Diamond Lake in Cass County took place. But, while the public continues ease up on following regulations meant to slow the spread of COVID, daily death numbers show that officials are gaining a better understanding on how to fight the disease once it is contracted. However, just because we are understanding the disease more does not mean it is any less of a threat. As has been noted since the beginning, COVID spreads quickly and if safety regulations are not followed we are at risk of seeing daily COVID case and death numbers rise.
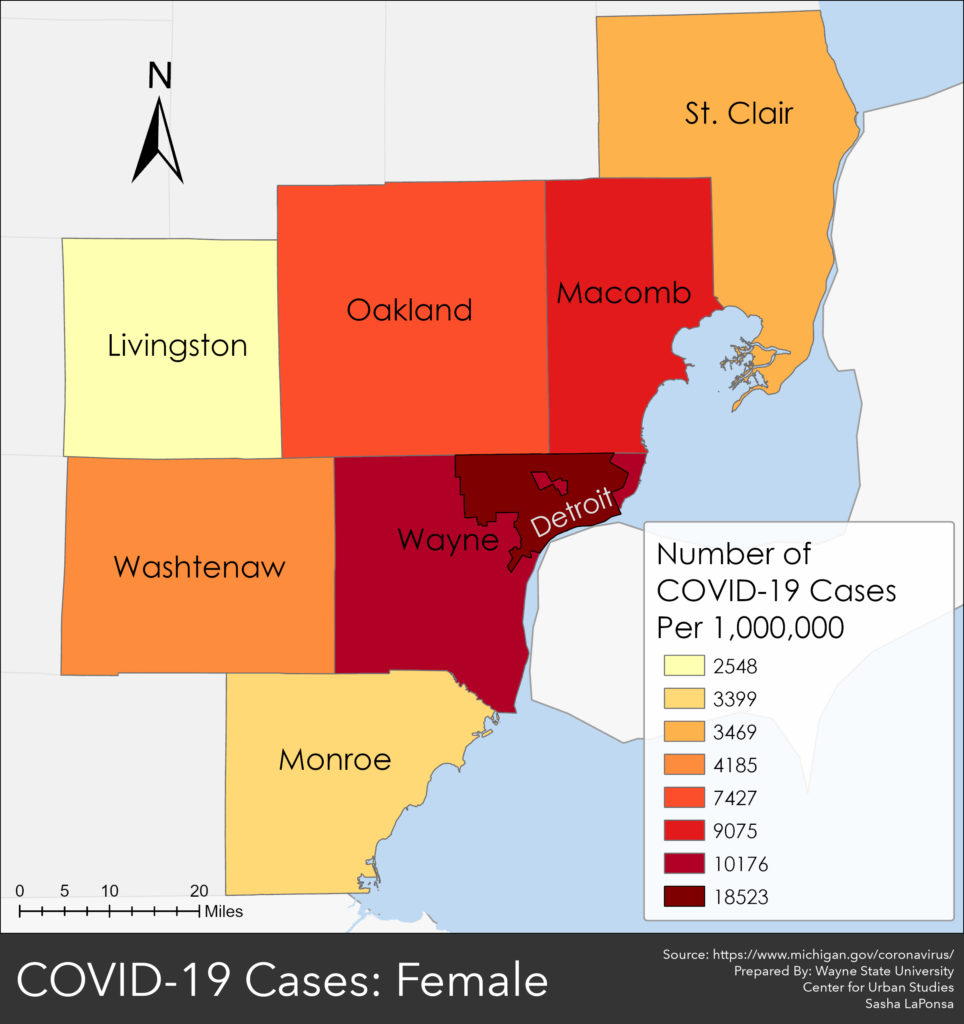
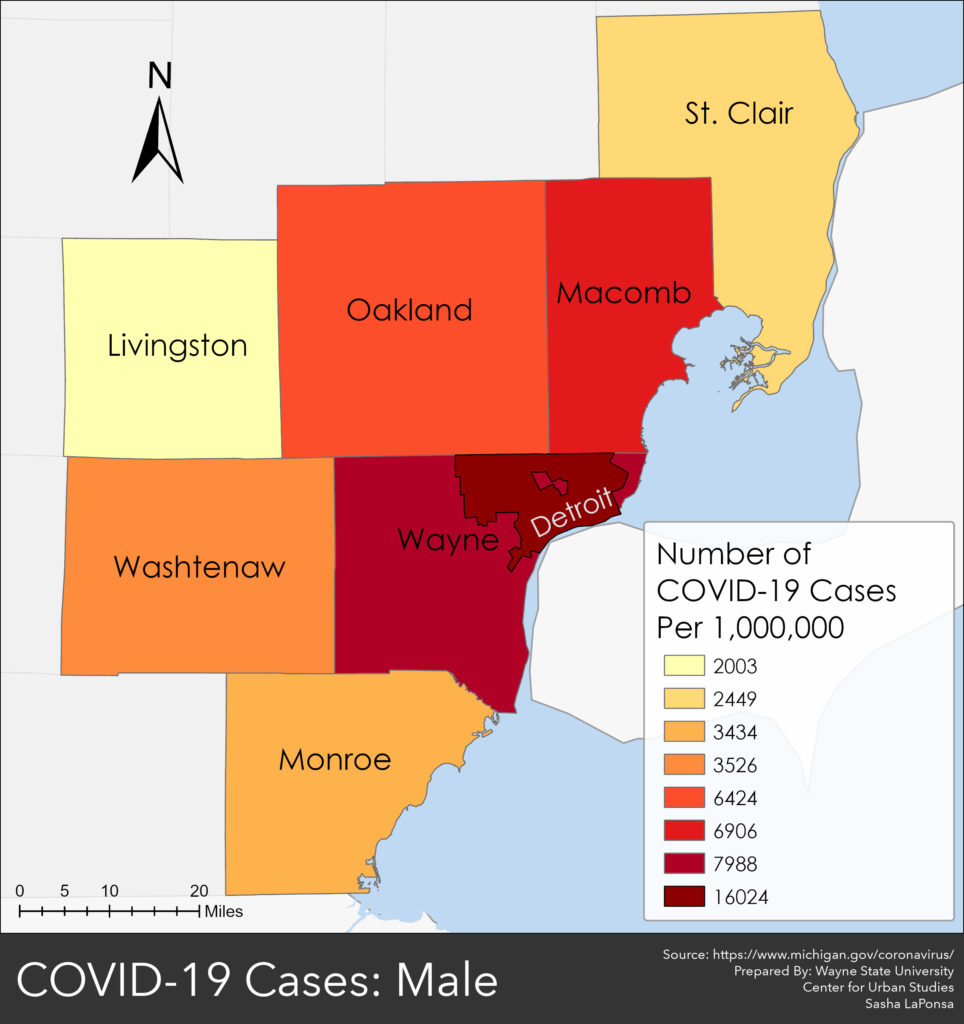
In the State of Michigan females are testing positive for coronavirus at a higher rate than males, according to the data from the Michigan Department of Health and Human Services. As of July 5, 65,876 COVID cases were reported Statewide, and of those 34,387–or 52 percent–were reported in the female population. In the maps below, we show the number of COVID cases per million by county and the City of Detroit in Southeastern Michigan for both the female and male populations. While the maps reflect data from late June they still highlight trends of areas that are being hit harder than others; this post simply narrows in on that through a gender lens.
The first map above shows that the City of Detroit had the highest per capita rate for the number of females who tested positive for COVID. According to the data, there were 18,523 females per million who tested positive. This was the highest per capita rate in the region. As of July 5 there were 6,518 females who tested positive in Detroit. The second map above shows that, on a per capita basis, Detroit also had the highest rate of males testing positive for COVID. According to the data, there were 16,024 males per million people in the City of Detroit who tested positive for COVID in late June. As of July 5, there were 5,117 males in Detroit who tested positive. In Detroit, females are testing positive for COVID at a rate 1.2 times higher than males. Overall, the City of Detroit had 11,709 cumulative positive COVID cases on July 5.
Wayne County had the second highest per capita rate of females and males who tested positive for COVID. According to the data there were 10,176 females per million who tested positive and 7,988 males per million who tested positive. On July 5, there were 6,009 females who tested positive for COVID in Wayne County and 4,495 males; females are testing positive for COVID at a rate 1.3 times higher than males.
Livingston County had the lowest per capita rates of both females and males affected by COVID; it also has the lowest numbers of individuals who have tested positive for the virus. According to the data, Livingston County had 2,548 females per million who tested positive for COVID; as of July 5 there were 260 total females who tested positive. For the male population in Livingston County, there were 2,003 per million who tested positive. On July 5 there were 214 total males in Livingston County who tested positive for COVID. Females are testing positive for COVID at a rate 1.2 times higher than males in Livingston County. Overall, there were 473 cumulative COVID cases reported in Livingston County on July 5.
As noted above, this post was intended to show the gender distribution of COVID in Southeastern Michigan. And, while the data does show women are testing positive for COVID at a higher rate than males, this post also further highlights how the City of Detroit is being affected by the virus at a higher rate than other areas in the State no matter what way you look at the data.
While per capita rates are used as a statistical measurement to show how certain indicators or events are affecting various places despite the varying population numbers, we know that Detroit has the highest number of cases at the municipal level statewide. We also know, as shown in our last post, that the black population is being disproportionately affected by COVID and the City of Detroit has the highest black population in the State.
The first map above shows that the City of Detroit, cumulatively, had the highest per capita rate for the number of females who tested positive for COVID. According to the data 18,523 females per million had tested positive. This was the highest per capita rate in the region. As of July 5 6,518 females had tested positive in Detroit. The second map above shows that, on a per capita basis, Detroit also had the highest rate of males testing positive for COVID. According to the data, there were 16,024 males per million people in the City of Detroit who tested positive for COVID in late June. As of July 5, there were 5,117 males in Detroit who tested positive. In Detroit, females are testing positive for COVID at a rate 1.2 times higher than males. Overall, the City of Detroit had 11,709 cumulative positive COVID cases on July 5.
Wayne County had the second highest per capita rate of females and males who tested positive for COVID. According to the data there were 10,176 females per million who tested positive and 7,988 males per million who tested positive. On July 5, there had been 6,009 females who tested positive for COVID in Wayne County and 4,495 males; females are testing positive for COVID at a rate 1.3 times higher than males.
Livingston County had the lowest per capita rates of both females and males affected by COVID; it also has the lowest numbers of individuals who have tested positive for the virus. According to the data, Livingston County had 2,548 females per million who tested positive for COVID; as of July 5 there were 260 total females who tested positive. For the male population in Livingston County, there were 2,003 per million who tested positive. On July 5 there were 214 total males in Livingston County who tested positive for COVID. Females are testing positive for COVID at a rate 1.2 times higher than males in Livingston County. Overall, there were 473 cumulative COVID cases reported in Livingston County on July 5.
As noted above, this post was intended to show the gender distribution of COVID in Southeastern Michigan. And, while the data does show women are testing positive for COVID at a higher rate than males, this post also further highlights how the City of Detroit is being affected by the virus at a higher rate than other areas in the State no matter what way you look at the data. While per capita rates are used as a statistical measurement to show how certain indicators or events are affecting various places despite the varying population numbers, we know that Detroit has the highest number of cases at the municipal level statewide. We also know, as shown in our last post, that the black population is being disproportionately affected by COVID and the City of Detroit has the highest black
On July 2, the State of Michigan reported a total of 64,675 cases, an increase of 534 cases from the day prior. The daily total was equivalent to 648 cases per 100,000 people (Chart 4). Of those 534 cases, 219 were documented in Southeastern Michigan. In total, 41 percent of the new COVID cases were in Southeastern Michigan, meaning case numbers are increasing at a higher rate outside of the region than locally. In Chart 1 we show that the State total for the number of COVID cases on June 30 was 63,887–a five-day rolling average. The five-day rolling average for the total number of COVID cases (Chart 1) reflects a smoother curve and adjusts for fluctuations in testing and/or the quality of reporting or failure to report. A closer look at Chart 1 shows how the once flattened curve is spiking upward again.
Chart 2 shows that, based on the five-day rolling averages, the growth of new COVID cases in Southeastern Michigan continues to increase but at a slower rate that of the entire State. On June 30, the number of cases in Detroit reached 11,580, the highest in the region. Wayne County’s numbers reached 10,315 on June 30, Oakland County reported 8,899 cases and Macomb County reported 7,173.
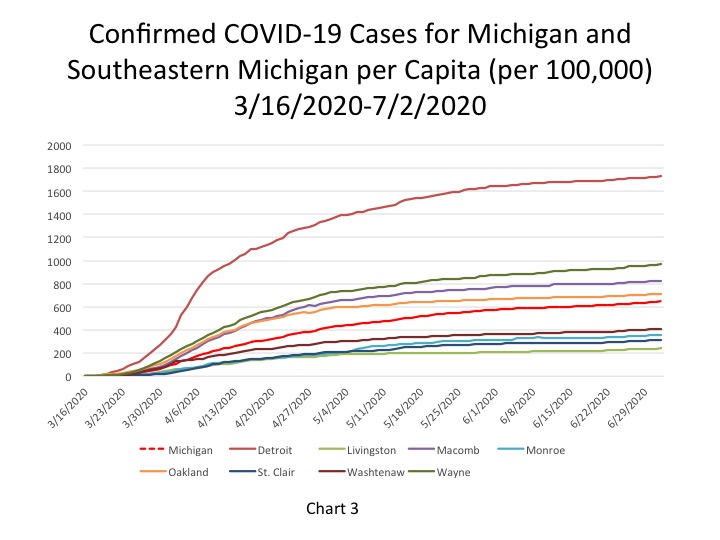
The City of Detroit had 1,730 COVID cases per 100,000 people as of July 2, an increase from 1,724 on July 1(Chart 3). This is based upon a reported increase of 40 new COVID cases between July 1 and July 2, bringing the total number of COVID cases in Detroit to 11,638. Wayne County reported 967 cases per 100,000 people, and Oakland County had 714 cases per 100,000 people. These per capita rates were based upon 10,409 total cases for Wayne and for 8,980 Oakland. Macomb County reported 827 cases per 100,000 people, which is based upon 7,228 cases.
The daily data highlighted in these posts is from Michigan.gov/coronavirus, where data is updated daily at 3 p.m. Historical data were supplied from covidtracking.com, which republishes COVID data from the State. Additionally, the case totals do not reflect the number of people who have recovered, just those who have been infected. In early June the State changed how it reports its data on the website, making data more accurate in the long-term but more complicated to track as well. The State regularly updates older data and as we continue to publish regular updates on COVID the State’s changes to past data many not always be reflected in our posts. The data published in new posts is accurate for the day we received it on though.
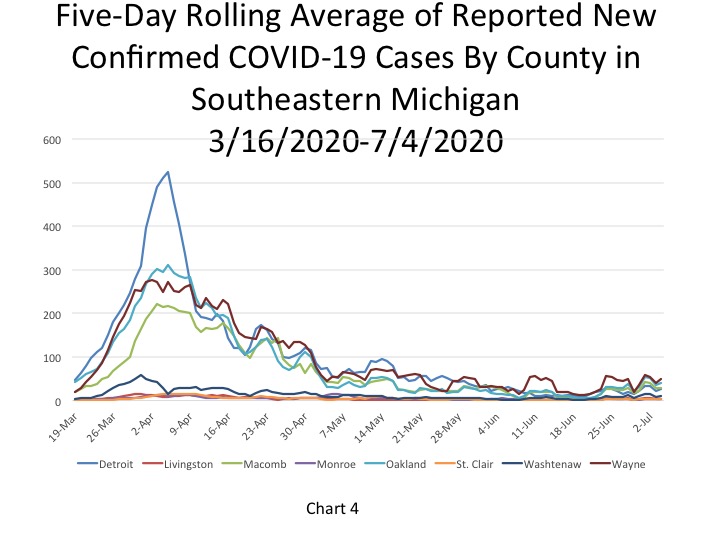
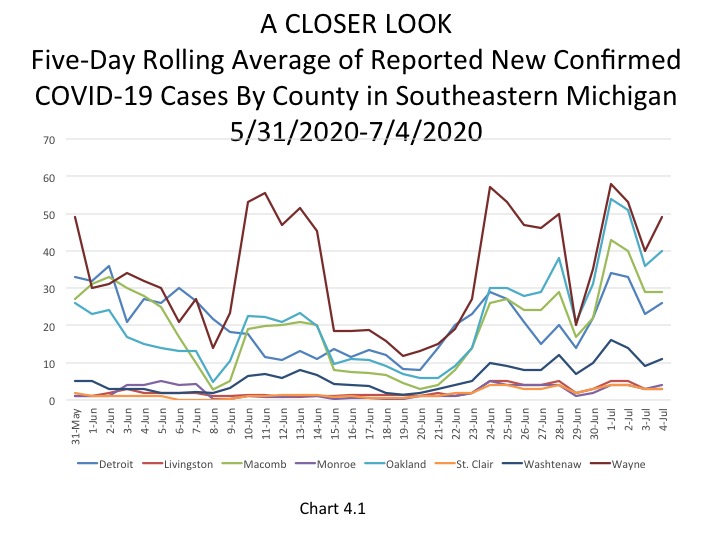
Chart 4 shows that Wayne County continues to report the highest number of daily cases, according to the five-day rolling average, at 35 on June 30. Detroit and Macomb County each reported 22 new daily cases while Oakland County reported 31. The chart shows that the number of new daily cases in the last several days is higher than what was reported in mid-June.
On July 2, the per capita rate for the number of new daily COVID cases per 100,000 people was 5 for the State, which was equivalent to 543 new cases. The last time similar numbers were reported at the State level was May 31. On July 2, Detroit and Wayne County were the only local government entities in the region to have a higher per capita rate than the State. Wayne County reported 7 new daily COVID cases per 100,000 people on July 2, which was equivalent to 76 new cases and Detroit reported a per capita rate of 6, which was equivalent to 40 new cases. Oakland County reported a per capita rate of 5 and Macomb County reported a per capita rate of 4, these rates were equivalent to 58 and 34 new cases, respectively. In Southeastern Michigan there were 219 new COVID cases reported on July 2.
In Chart 6, the five-day rolling average for the number of deaths in Michigan, shows the number of deaths in the State of Michigan is increasing at a much lower rate than the number of new COVID cases. On June 30 the cumulative deaths were 5,938 deaths (an increase of 12 deaths from the day prior). The actual cumulative COVID-19 deaths on July 2 was 5,966, an increase of 14 deaths from the prior day. Of the 14 deaths that were reported on July 2, 8 occurred in Southeastern Michigan. Additionally, 13 of the those 14 deaths were added on to the July 2 total as a result of comparing death records with the COVID database.
Chart 7 (a 5-day rolling average) echoes the message the statewide data is conveying regarding COVID deaths in Michigan-they are occurring at minimal rates and mostly in Southeastern Michigan. On June 30 the City of Detroit reported 1,441 deaths, an increase of 1 death from the day prior. Wayne County had the second highest total at 1,158 deaths on June 30.
The per capita rates for the number of total COVID deaths in Southeastern Michigan continues to remain fairly stagnant across the region as counties, and the City of Detroit experience zero to minimal increases in COVID death numbers. Detroit reported 215 total COVID deaths per 100,000 people on July 2, which was equivalent to 1,445 deaths. Wayne County reported a per capita rate of 108 (1,163 deaths), Macomb County reported a per capita rate of 110 (880 deaths) and Oakland County reported a per capita rate of 83 (1,049 deaths). The State of Michigan reported a per capita rate for the number of total COVID deaths at 60 per 100,000 people, which was equivalent to 5,966 total deaths.
Chart 9, the five day rolling average of deaths, shows the number of new statewide deaths was reported at 12 on June 30. Furthermore, Chart 10 shows how the number of deaths in Southeastern Michigan continues to remain low but also how the region is the largest contributor to the number of Statewide deaths. Macomb and Wayne counties each reported 2 new deaths on June 30, and Detroit and Oakland and Washtenaw counties reported 1; the other counties in the region reported 0. These numbers are based on 5-day rolling averages.
Detroit and Macomb County were the only two government entities in Southeastern Michigan to maintain a fatality rate above 12 percent as of July 2. Detroit’s fatality rate was 12.4 percent and Macomb County’s was 12.2 percent. The fatality rate continues to decline, it was reported at 9.2 percent on July 2.
While COVID death numbers remaining low is encouraging, the fact that the number of new daily cases continues to increase is just the opposite. With 534 new COVID cases reported on July 2, the highest number since May 31, cause for concern also continues to increase. Gov. Gretchen Whitmer has also seen the increasing number of new daily cases as a risk to public health, which is why she recently ordered indoor bars to close throughout most of Michigan.
With the holiday weekend here and case numbers rising it is vital that citizens continue to remain distant from others, wear masks, regularly wash their hands and stay home if they feel sick. As has been seen with examples such as the one coming out of an East Lansing bar, one infected person in a crowded area with little to no protection can cause a major outbreak, putting the public at a greater risk.