The number of unemployment claims in the state
of Michigan has continued to climb as the coronavirus-19 (COVID-19) has caused
businesses to shutter in an effort to keep residents safe and to “flatten the
curve.” Over the last several weeks Gov. Gretchen Whitmer has issued numerous
executive orders forcing the closure of businesses, telling residents to stay
home and allowing unemployment benefits to be expanded as a result of the
increasing number of claims.
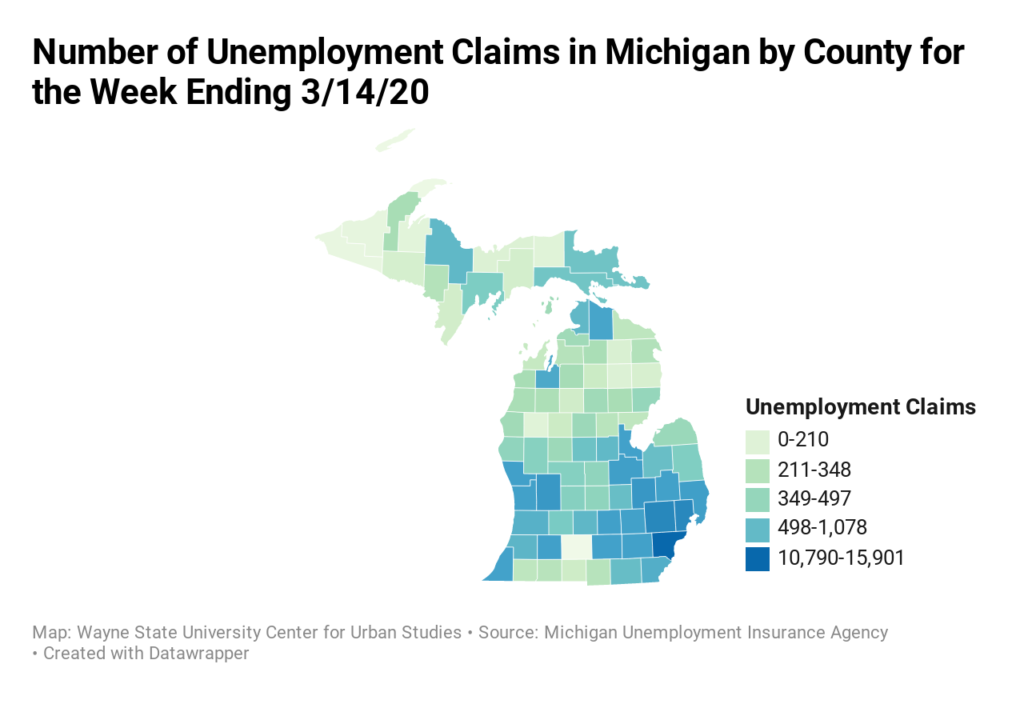
According to the Michigan Unemployment Insurance
Agency there were 83,177 unemployment claims for all counties in Michigan for
the week ending March 14, 2020. This number is for all claims, including
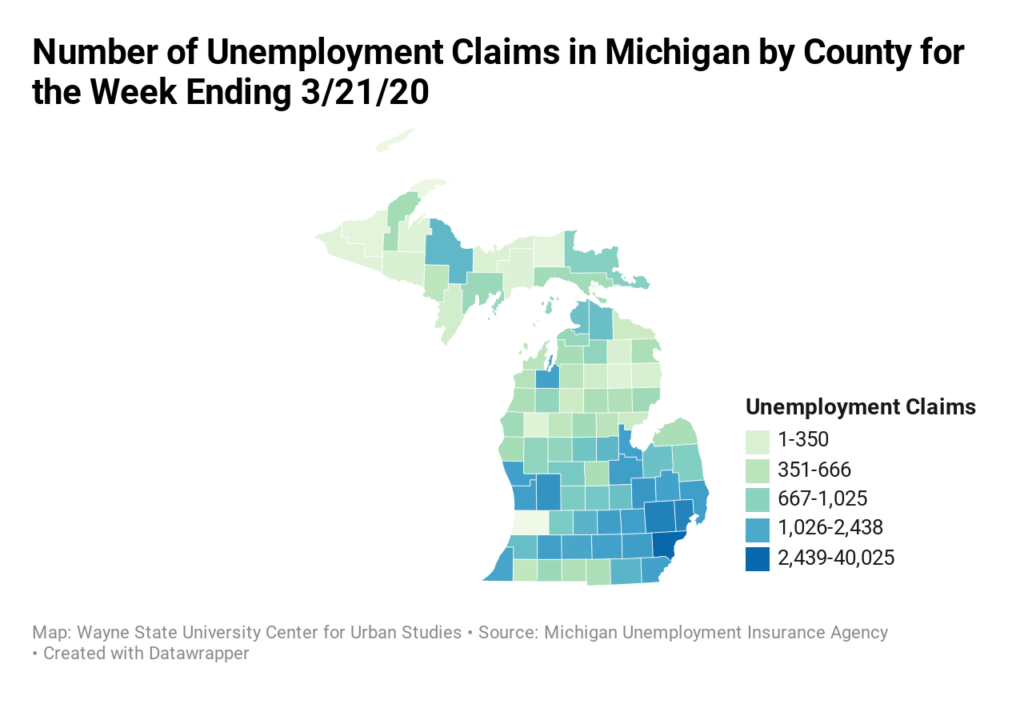
continued and initial claims. By the following week, the number of unemployment
claims increased to 207,048 for the week ending on March 21, 2020. In total,
that was a week-over-week increase of about 123,000 claims.
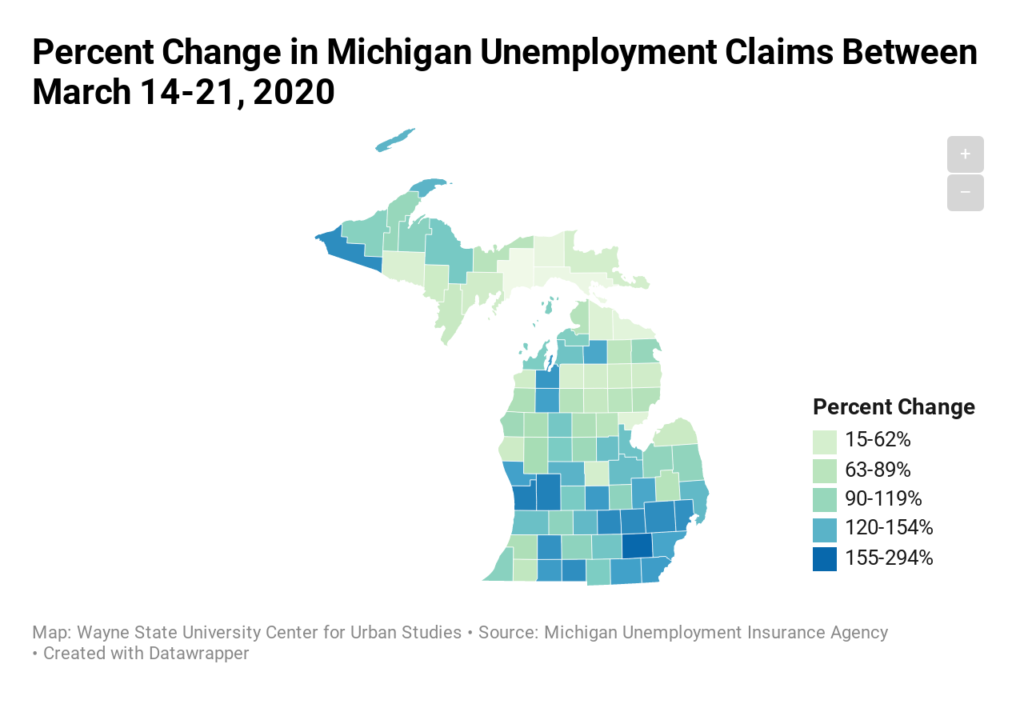
The three maps below show the total number of unemployment claims by county in Michigan for the weeks that end on March 14, 2020 and March 21, 2020 and the percent change in claims between those two weeks. All maps will show that Wayne County had the highest number of unemployment claims for both weeks at 15,901 and 40,025, respectively.
The counties with the 10 highest number of unemployment
claims in the last few weeks were:
County
Number of Claims Week Ending 3/14/2020
Number of Claims Week Ending 3/21/2020
Wayne County
15,901
40,025
Oakland County
7,810
23,799
Macomb County
7,596
22,542
Kent County
3,544
11,885
Genesee County
3,782
9,443
Washtenaw County
1,343
5,286
Ingham County
1,680
5,219
Ottawa County
1,386
4,666
Saginaw County
1,939
4,499
Kalamazoo County
1,487
4,341
While Wayne County had the highest number of unemployment claims, Washtenaw County had the largest percent change between both weeks at 294 percent (increase of 3,943 claims), followed by Ottawa County at 237 percent (increase of 3,280 claims) and then Kent County at 235 percent (increase of 8,341 claims). In Wayne County there was a percent increase of 152 between the two weeks, which was equivalent to an increase in 24,124 claims. For Oakland County there was a percent increase in unemployment claims of 205 percent (15,989 claims) and for Macomb County the percent increase was 197 percent (14,946 claims).
With the Stay Home, Stay Safe order being issued by Gov. Whitmer on March 23, 2020 it is likely that unemployment claims in the State of Michigan will continue to increase. According to a recent article from Michigan Radio, the State of Michigan has a $4.6 billion trust fund to pay unemployment benefits and it has assured people that if they file for unemployment benefits they will be paid.
Today, Gov. Gretchen Whitmer
placed a three week stay-at-home order on the residents of Michigan to slow the
spread of the coronavirus disease (COVID-19). This order, along with other
executed orders issued in the last week means restaurants are limited to takeout,
casinos are shuttered and the Big 3 (Ford, GM and Chrysler-Fiat) all
temporarily closed their manufacturing plants, along with hundreds of other
businesses deemed non-essential. As the number of confirmed cases in Michigan
continue to rise so do the concerns about economic stability. Staying home and
social distancing are necessities at a time like this but businesses, and their
employees, are grappling with how to stay afloat. Some have the ability to have
their employees work from home, others can pay their workers for some period of
time despite being closed, and many employees are left without knowing where
their next paycheck will come from.
According to Bridge Magazine, the Michigan
Department of Labor and Economic Opportunity reported about 108,000 unemployment
claims as
between March 16-20, 2020. The same agency reported that the average weekly
unemployment claims during the height of the Great Recession peaked at about
90,000.
To provide a better glimpse as to how
many people in Michigan may be economically impacted due to this global
pandemic we have provided the most recent annual employment numbers from the
State for occupations and industries that have been or are most likely to be
impacted.
All the employment data in this post is from the Michigan Department of Management, Technology and Budget and focuses on Metropolitan Statistical Areas (MSA) in Michigan, which are areas with a dense population at its core and close economic ties to the surrounding areas in the region. Not all MSAs in this post had data to reflect the industries or occupations examined in this post. Additionally, some State totals may vary from the totals in the pie charts due to the fact not all MSAs had data and some areas, such in the Upper Peninsula, do not have an MSA but do still have employees in the various industries and occupations examined.
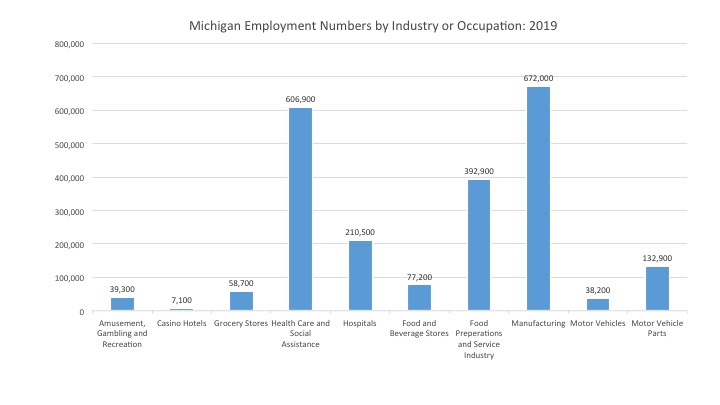
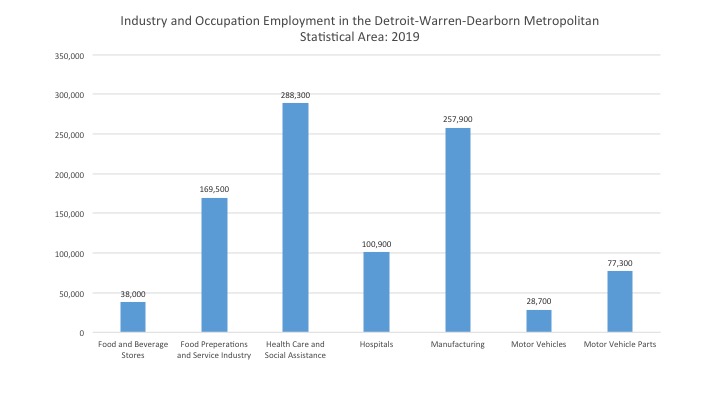
The chart below shows the number of employees in 2019 of the various industries and occupations that are arguably amongst the hardest hit due to COVID-19, whether it be from being forced to or from being overworked due to community needs (health care workers and grocery stores, who have been deemed essential employees by the governor).
In 2019, there were 672,000 people who
declared manufacturing as their occupation; this was the highest number in the
State of Michigan of those examined in this post; those declaring health care
and social assistance as their occupation came in second at 606,900. The food
preparations and serving industry came in third with 392,900 people employed in
the State of Michigan.
In breaking the data down further, we look at the same industries and occupations (if data was available) for the Detroit-Warren-Dearborn MSA. For just this area, the health care and social assistance occupation had the most number of employees at 288,300 in 2019, followed by manufacturing at 257,900. In the Detroit-Warren-Dearborn MSA there were 169,500 people in the food preparation and serving industry.
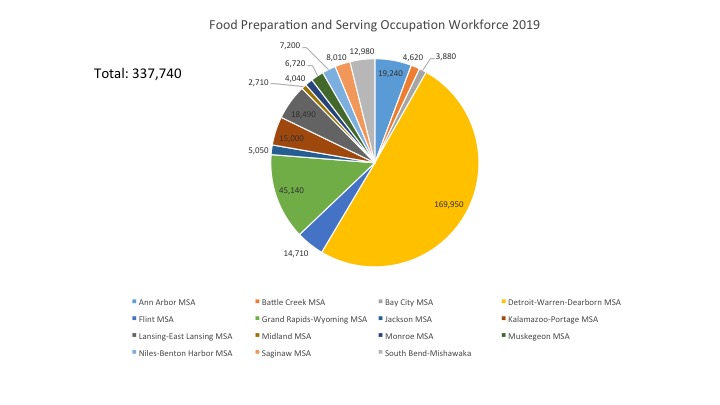
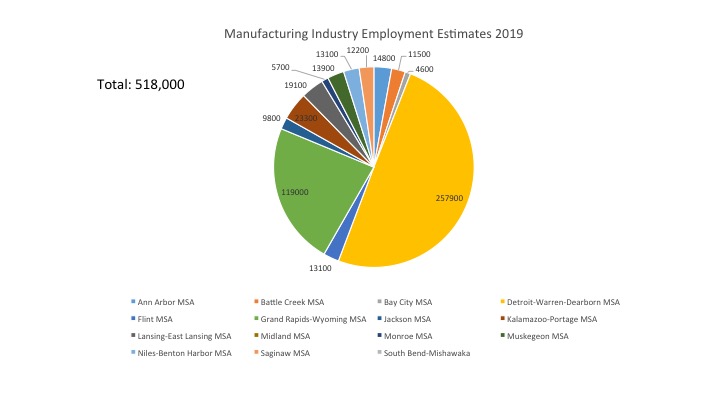
The two pie charts below highlight what areas (MSAs) are likely to be impacted the most in terms of unemployment as a result of COVID-19 related closures. Food preparation and serving and manufacturing were the only two occupations with comprehensive data sets for 2019, and as both charts show, the Detroit-Warren-Dearborn MSA had the highest number of employees (this is also the most densely populated area in the State). For food preparation and serving there were 169,950 employees in the Detroit-Warren-Dearborn MSA followed by the Grand Rapids-Wyoming MSA with 45,140 employees. For manufacturing there were 257,900 employees in the Detroit-Warren-Dearborn MSA in 2019 and 119,000 in the Grand Rapids-Wyoming MSA.
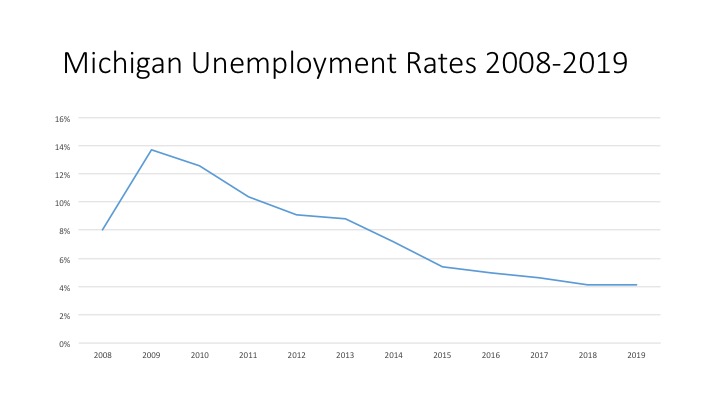
As the snapshots above show, thousands of people are at risk of being unemployed for an unknown amount of time. And, as noted earlier, the number of unemployment claims continue to rise as a result of COVID-19 and the precautions being taken to “flatten the curve.” In 2019 the unemployment rate for the State of Michigan was 4.1 percent, the lowest it has been since the start of the Great Recession in 2008. We certainly have a long way to go before unemployment rates reach what they were during the peak of the recession (14%) but with such a swift shift in employment for hundreds of thousands of people the possibility is certainly on the minds of many.
While the economic future of Michigan and the country is not exactly certain at this time, actions are being taken by federal and state officials to aid citizens. At the federal level officials are working to secure a coronavirus stimulus check for qualifying citizens and in Michigan Gov. Whitmer extended unemployment benefits, among other forms of support. For now, what we can do is adhere to the guidelines created by the Centers for Disease Control to “flatten the curve,” which include: remaining at home-especially when sick, keeping at least six feet away from others, washing your hands frequently for at least 20 seconds, covering coughs and sneezes and regularly cleaning frequently touched surfaces. Additionally, local businesses can be supported by: purchasing gift cards, donating to funds they may have created or are being supported through, ordering their products online or purchasing carry-out and writing your elected officials to find means to further support them through public policy decisions.
Those in poverty often experience food insecurity, including children. With schools across the State of Michigan closed for the next several weeks due to the threat of the coronavirus disease (COVID-19) it is important to understand which school districts have students at a higher risk of food insecurity while school is out.
Those in poverty often experience food insecurity, including children. With schools across the State of Michigan closed for the next several weeks due to the threat of the coronavirus disease (COVID-19) it is important to understand which school districts have students at a higher risk of food insecurity while school is out.
In Southeastern Michigan there are 17 school districts with 50 percent or more of the households being run by a single parent. This is an important statistic as it can relate to the financial well-being of a family, which often correlates with a child’s access to quality education and educational and extra curricular opportunities. According to the Pew Research Center, in 2017, 32 percent of parents were unmarried. Of the 110 public school districts in Southeastern Michigan 44 have 32 percent or more of households with a single parent.
The district with the highest percentage of single parents is
the Highland Park School District where 83 percent of households with
school-aged children have a single parent.
Highland Park School District also has the lowest median income for
single mothers at $15,224, and, while the two are not mutually exclusive, it does provide
insight into the economic and family backgrounds of many of the students in the
district. The district with the second
highest percentage of single parents is the Ecorse Public School District at 74
percent; the median income for single mothers in that district is $16,108.
Following the same pattern, Detroit Public Schools has the third highest
percentage of single parents at 71 percent.
On the
opposite end of the spectrum, Garden City School District in Wayne County has
the lowest percentage of households with a single parent at 8 percent. The next
two districts with the lowest percentage of single parents were Milan and
Saline public schools, both in Washtenaw County, at 10 percent. In Oakland
County, Bloomfield Hills and Birmingham school districts have the highest
median income for single mothers at just under $83,000, and the percentage of
single parents in these districts is 16 percent for both.
As we’ve noted throughout this series,
family income does often have an affect on the type of education a child
receives, and this post highlights that while tying in how family background
may also have an affect.
Funding for the Michigan Council for Arts
and Cultural Affairs has increased nearly ten-told since 2011, but is still far
below what it was prior to the Great Recession. Michigan Council for Arts and
Cultural Affairs is the state’s lead agency that develops art and culture
policy and distributes grants to support such policies throughout the state.
This state agency receives both federal and state funding, the federal funding
of which is typically a match to state funding.
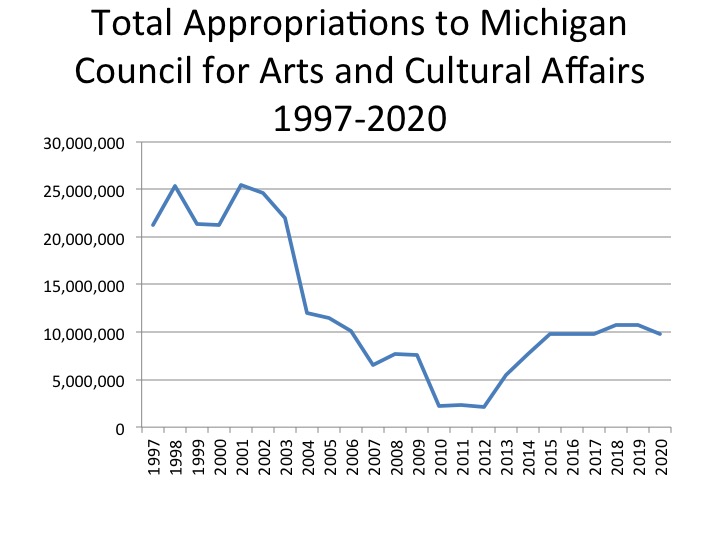
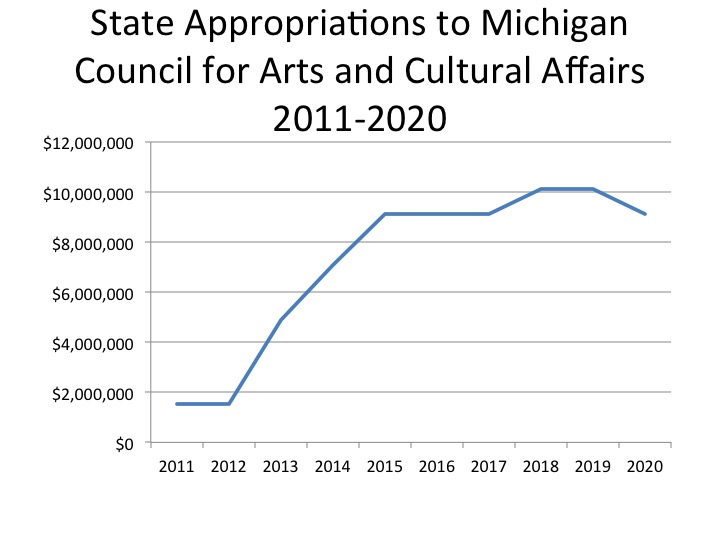
The first chart below reflects the total amount appropriated to the Michigan Council for Arts and Cultural Affairs from both the State and the federal government and the second chart shows how much has been allocated from just the State.
Overall, the total appropriation for
the Michigan
Council for Arts and Cultural Affairs in fiscal year 2020 is $9.7 million. That
amount has been the agency’s total annual allocation since 2015, except in 2018
and 2019 when the total appropriation amounts were $10.7 million. Since 1997 the
highest total appropriation amount Michigan Council for Arts and Cultural
Affairs has received is $25.5
million
in 2001.
So,
while state funding for the Michigan Council for Arts and Cultural Affairs has
been increasing in recent years it is still at less than have of where it was
at in the late 1990s.
According to budget data provided by the
Michigan Arts Council the State of Michigan appropriated $10.1 million for the
arts in fiscal years 2018 and 2019 and $9.1 million in 2020; $9.1 million was
also appropriated between 2015 and 2017. However, in 2011 and 2012 the State
appropriated $1.5 million to the Michigan Council for Arts and Cultural
Affairs. The federal government has consistently provided a grant to the Michigan
Council for Arts and Cultural Affairs for $1.05 million since at least 2011.
When these funds are allocated from the federal government each year the
Michigan Council for Arts and Cultural Affairs is expected to match, at the
most, what has been allocated to them by the federal government.
The overall purpose of the Michigan
Council for Arts and Cultural Affairs is to promote civic engagement, economic
development and educational opportunities. This agency has been able to do this
by supporting field trips and classroom initiatives, providing funding to area
government capital improvements, along with a host of other programs throughout
the state. While this agency does infuse local governments and schools with
access to arts and culture, it does not provide funding to the Detroit Institute
of Arts (DIA). The DIA is instead funded through a public millage (which is up
for a 10 year renewal on March 10), an endowment fund, revenue through
admissions and programs and donations.