453 Hate Crimes Reported in Michigan in 2020

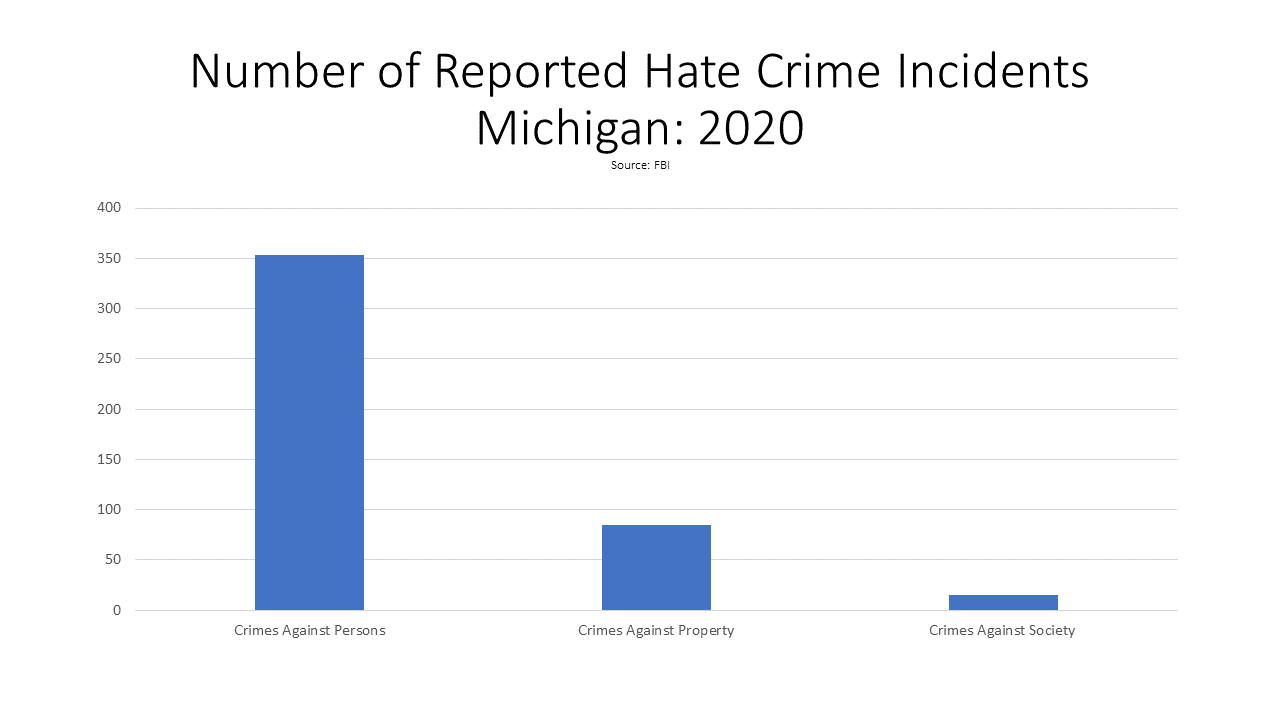
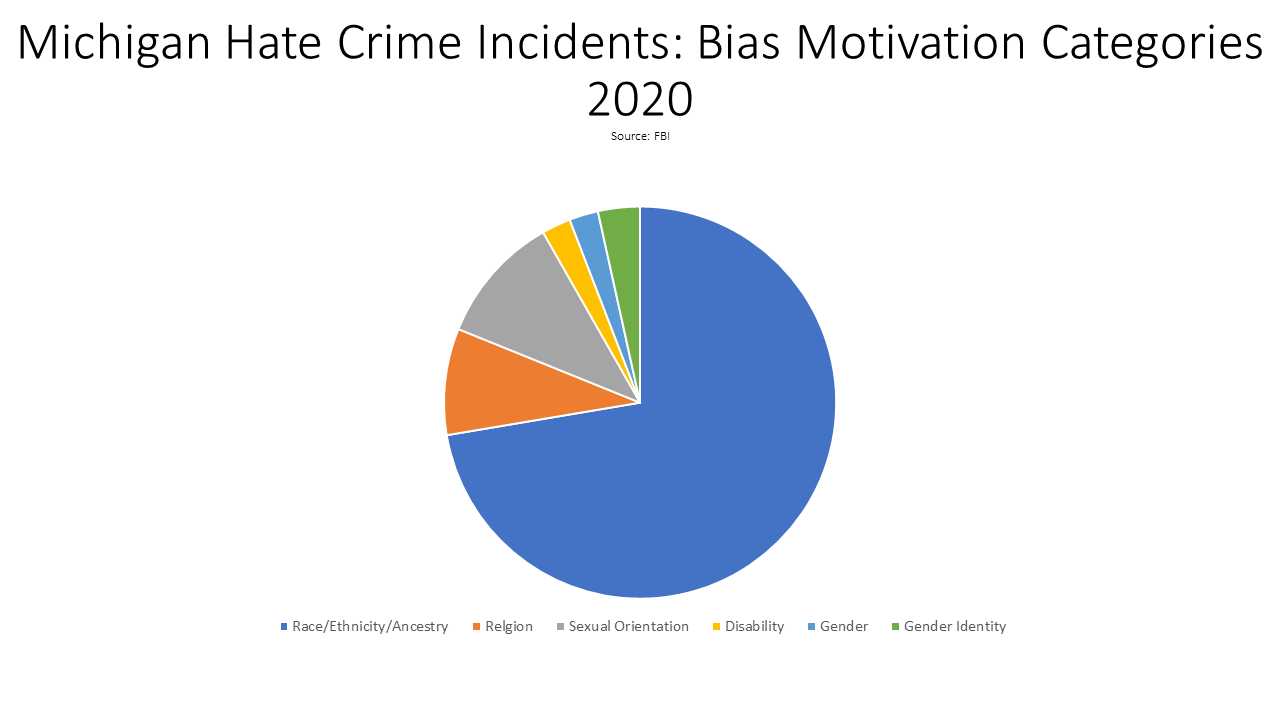
In 2020 the Federal Bureau of Investigation (FBI) reported 453 hate crimes in the State of Michigan, an increase from the 434 hate crimes reported the year prior (Chart 1). According to the FBI, hate crimes are defined as a crime motivated by bias against race, color, religion, national origin, sexual orientation, gender, gender identity or disability. In 2020, majority of the hate crimes reported were motivated by race/ethnicity/ancestry (77%). Sexual orientation was the second highest bias that motivated a hate crime at 11 percent, followed by religion at 9 percent in 2020 (Chart 2).

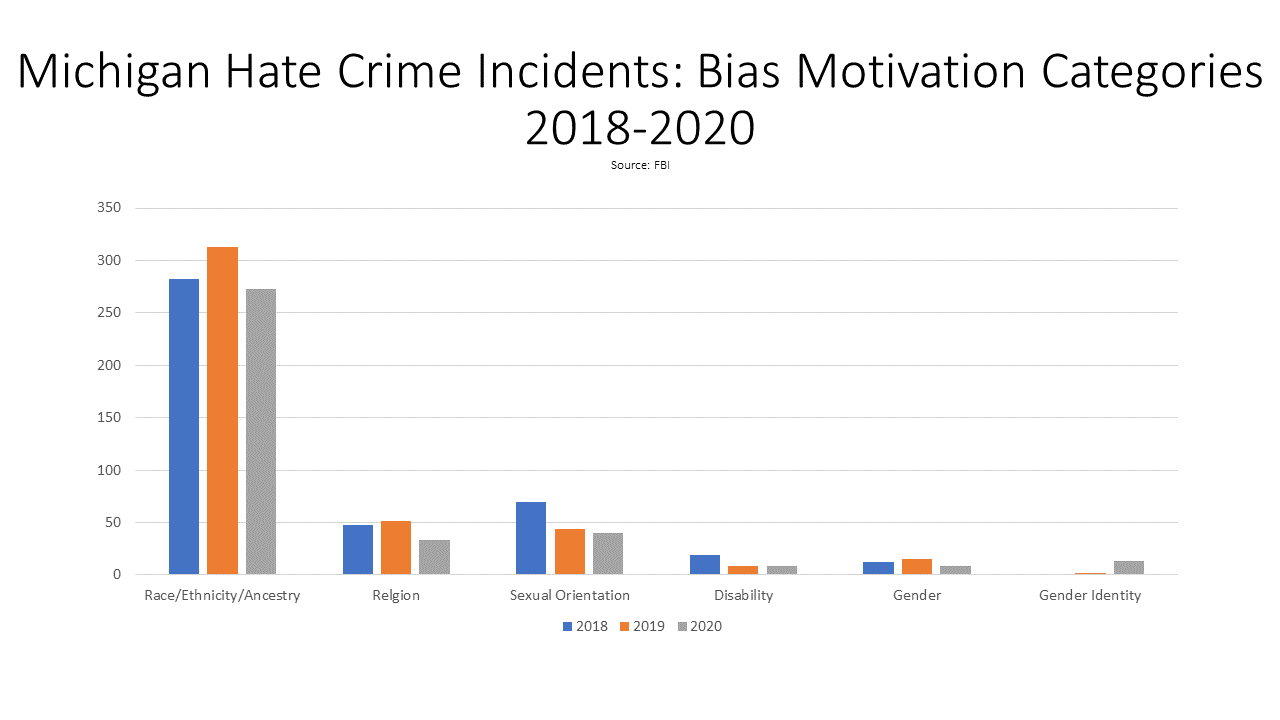
In 2018 and 2019, race/ethnicity/ancestry were also the bias motivator category with the highest number of reported at hate crimes. In 2018 there were 282 hate crimes motivated by race/ethnicity/ancestry, in 2019 there were 313 hate crimes motivated by race/ethnicity/ancestry and in 2020 there were 273 hate crimes motivated by race/ethnicity/ancestry (Chart 3).

The FBI has not yet released the agencies/locations where hate crimes were reported for 2020, but in 2019 the data showed that some of the reported hate crimes occurred at Eastern Michigan University, Oakland University, University of Michigan (Ann Arbor and Flint) and Washtenaw Community College. University of Michigan Ann Arbor had the highest number of reported hate crimes in 2019 at 7, with the race/ethnicity/ancestry being the highest bias motivator. Washtenaw Community College also had a reported hate crime under that bias motivator category. Gender identity as a bias motivator with the second highest number of reported incidents at 2, with Eastern Michigan University and Oakland University each having a reported incident.

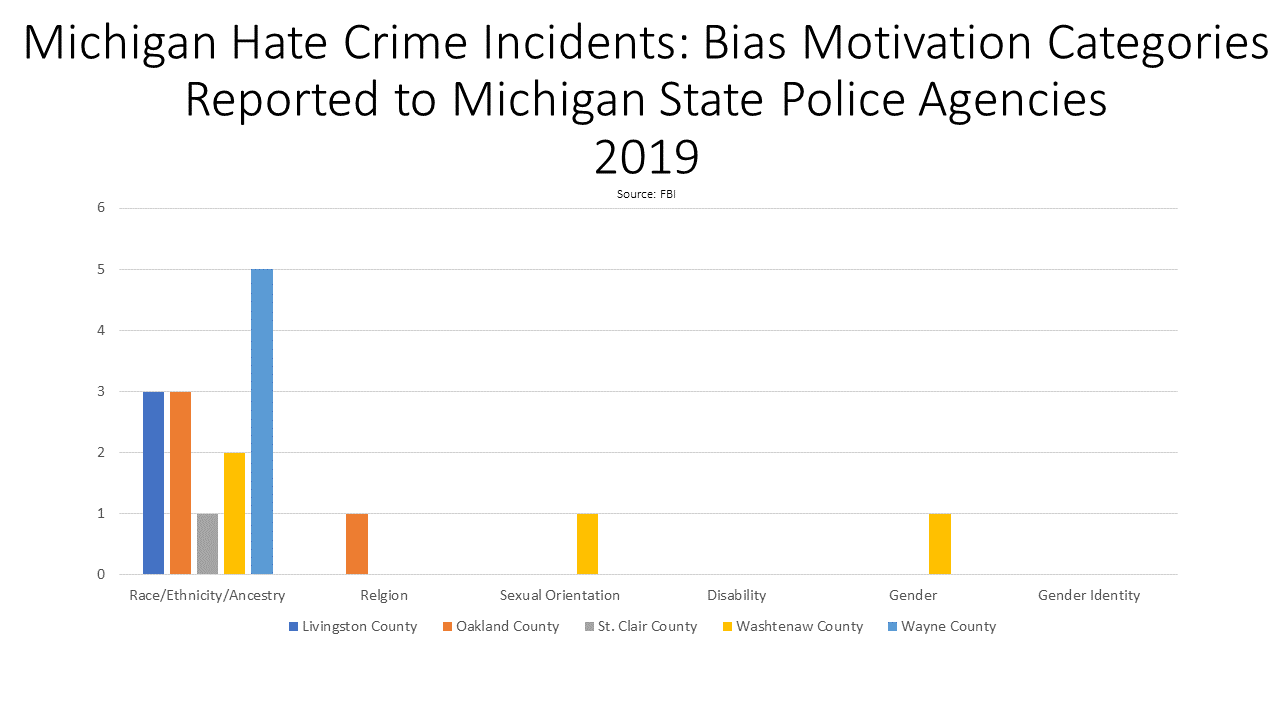
When examining the State Police agencies by county, Wayne County had the highest number of reported hate crime incidents at 5, with the race/ancestry/ethnicity bias motivator category being the highest and only category in which hate crimes were reported under. The Wayne County State Police agency reported 5 race/ancestry/ethnicity motivated hate crimes. Of the seven counties in Southeastern Michigan only Livingston, Oakland, St. Clair, Washtenaw and Wayne reported hate crimes out of their respective State Police agencies. All these counties, except for Oakland and Washtenaw counties only had hate crimes reported under the race/ancestry/ethnicity bias motivation category. The State Police agency located in Oakland County also reported a hate crime under the religion category in 2019, and the Washtenaw County State Police agency also reported hate crimes under both the sexual orientation and gender categories.
 

Those who believe they are the victim of a hate crime or believe they have witnessed a hate crime should dial 911 in an emergency situation. Individuals can also report the crime to their local police department and then follow up with the report with a tip to the Federal Bureau of Investigation’s (FBI) tip line at 1-800-225-5324.

All the Single Ladies (And Gentlemen): Marriage Rates in Southeastern Michigan Continue to Decline

Overall, there was a greater percentage of individuals in Southeastern Michigan who were never been married in 2019 compared to 2010, according to US Census data. In 2019, the county with the highest percentage of married individuals was Livingston County where 58 percent of those who were 15 years of age or older were married; comparatively 63 percent were married in 2010. Wayne County had the lowest percentage of those 15 years of age and older who were married in 2019 at 38 percent, compared to 40 percent who were married in 2010. Overall, each county in Southeastern Michigan experienced a decline between 1 and 4.5 percent of married individuals between 2010 and 2019.

While the percentage of married individuals declined between 2010 and 2019, the percentage of those never married increased. Livingston County experienced a 3.5 percent increase between 2010 and 2019; 22.5 percent of individuals were never married in 2010 and 26 percent were never married in 2019. Overall in 2019 Washtenaw County had the highest percentage of individuals who were never married at 43 percent; Washtenaw County also had the highest percentage of individuals who were never married in 2010 at 40 percent.

As the general data shows, there is a growing trend of individuals not getting married, and a deeper dive into the data also shows that the age group further highlights that trend is the 20-34-year-old age group. According to the Census data, four of the seven counties in the region experienced a 3 to 7 percent increase in the percentage of 20-34-year-old individuals who have never been married between 2010 and 2019. Livingston County experienced the greatest increase at 7 percent; in 2010 56 percent of 20-34-year-olds in Livingston County were never married, and by 2019 that increased to 73 percent. Washtenaw County experienced a 5 percent increase while Macomb and Wayne counties each experienced 3 percent increases. Monroe County was the only one in the region to experience a percent decrease in 20-34-year-olds who were never married; that increase was only 0.3 percent.

In addition to the percent increase of 20-34 year-olds who were never married between 2010 and 2019, there was also a small increase the percentage of 45-54-year-olds who were never married. In that time frame there was a 0.04 to 2.2 percent increase in that age group never married amongst six of the seven counties. Wayne County experienced the largest increase at 2.2 percent; 23 percent of the 45-54-year-olds in Wayne County were married in 2010 and by 2019 that increased to 25.2 percent. St. Clair County was the only one to experience a small decrease; about 1 percent less of the 45-54-year-olds in St. Clair were marred in 2019 compared to 2010.

Just as there were increases in the percentage of 20-34-year-olds and 45-54-year-olds never married amongst the seven counties in the region, there was also a decrease in those getting married amongst those two age groups.

Nationally, the trend of non-married individuals has been increasing since 1990, according to the Pew Research Center. Factors such as different societal priorities, such as increased focus on the workforce, and higher costs of living are in part driving this trend. Furthermore, the Brookings Institute found that marriage rates are also declining amongst the middle class, possibly due to the cost of raising children.

Michigan’s Deaths Out Pace Births

More people died in Michigan in 2020 than were born, and it has been trending this way for quite some time. The Michigan Department of Health and Human Services reported that in 2020 there 104,166 people born and 117,087 who died; the 2020 data was only available at the state level. While COVID certainly impacted the number of 2020 deaths (11,362 were COVID related), there still would have been a greater number of deaths than births without the pandemic.

While 2020 data is not yet available at the county level, the 2019 data shows how birth and death rates have long been trending toward more deaths than births. In Wayne County, the largest county in the state, a birth rate of 12.9 births per 1,000 residents was reported, which was equivalent to 22,553 births. Wayne County had the highest birth rate in the region in 2019, but it did not have the largest change in birth rates between 2009 and 2019. According to the data, there was a birth rate of 12.9 births per 1,000 residents in Wayne County in 2019 and a birth rate of 13.6 births per 1,000 residents in 2009. Washtenaw County had the largest difference in birth rates between 2009 and 2019 at a rate decrease of 1.4 per 1,000 residents. In 2019 Washtenaw County had a birth rate of 9.7, which was equivalent to 3,560 births, and in 2009 that birth rate was 11.1. Oakland, Macomb, Monroe and St. Clair counties all also reported birth rates above 10 in 2009 (11.1, 11.1, 11.4 and 10.9, respectively); Livingston County was the only one in the region to report a birth rate below 10 in 2009. By 2019 only Macomb, Monroe, Oakland and Wayne counties reported birth rates above 10 (10.4, 10.1, 10.3 and 12.9, respectively).

Michigan’s birth rate per 1,000 residents was 11.8 in 2009 and 10.8 in 2019.

As birth rates in Michigan were declining, death rates were on the rise. In 2019, St. Clair County had the highest death rate at 1,170.8 per 1,000 residents in 2019, which was equivalent to 1,863 deaths. Macomb, Monroe and Wayne counties were the only other counties with death rates above 1,000 ( 1,026.2, 1,047.8 and 1,044.7, respectively). In 2009 though there was not one county in the region with a death rate above 1,000. St. Clair County reported 961.5 deaths per 1,000 residents, which was the highest death rate in the region reported. Overall, Monroe County experienced the highest increase in its death rate between 2009 (847 per 1,000 residents) and 2019 (1,047.8 per 1,000 residents) at a 221.8 rate increase per 1,000 residents.  

It should also be noted that Michigan’s death rate per 1,000 residents was 871.7 in 2009 and 992.3 in 2019.

A decline in births will certainly impact Michigan long-term if things don’t turn around. While

 Michigan did experience a small uptick in its population between 2010 and 2020 probably because of immigration, the rate of increase wasn’t as high as compared to other states, hence why Michigan lost a Congressional seat. Population decline, and even stagnation, could cause negative economic impacts and further loss of political power. On the other hand, it would give the environment a break from human interventions, giving forests and wildlife a chance to expand, perhaps.  

Union Membership in Michigan Rises

In 2020 there was an increase in the percentage of employees who were members of a union; there was also an increase the percentage of employees who were represented by unions. This comes after an overall decline in union membership and representation since 2010, according to the Bureau of Labor Statistics (BLS). In 2010 16.5 percent of employees were members of a union in Michigan and 17. 3 percent were represented by a union. In 2020 15.2 percent of employees were members of a union and 16.6 percent were represented by a union; both categories experienced increases from 2019. Overall in Michigan in 2020 there were 604,000 union members.   In addition to these members, another 57,000 wage and salary workers in Michigan were represented by a union on their main job or covered by an employee association or contract while not union members themselves.

While the BLS does not track union membership by sector or occupation at the state level, nationally the BLS reports that the union membership rate of public-sector workers is more than five times higher than the rate of private-sector workers who are union members. According to the BLS, 33.9 percent of the public-sector employees were union members in 2021. Of those public-sector employees in the union, majority were represented those in the education, training, library and protective service occupations. The percentage of private-sector employees who were union members was 6.1 percent in 2021. According to the BLS, and a recent New York Times article, majority of the union membership decline has come from the private sector. Nationally, private-sector union membership was at 6 percent in 2021 and in 1983 it was at 17 percent.

Overall there are a greater number of private-sector employees than government employees, and while the charts below show there was a decline in the total number of employees in both sectors after COVID, the lack of union representation in the private-sector is causing, at least some, to leave their jobs, according to the New York Times article. With a shift in the labor market and workplace practices since the pandemic began, more and more workers are feeling confident in their ability to leave jobs that don’t fit their needs. While the New York Times sites that this doesn’t always leave to increased union activity, the current labor market has certainly allowed more people to be more vocal and how their employer can meet their needs, and not just the other way around.

Labor unions have experienced an overall increase in sentiment since 2009, according to Gallup, with 68 percent of those polled expressing approval of labor unions in 2021. This approval rate is the highest it has been since 1965 when there was a 71 percent approval rating. With increased media attention on the successful efforts of employees at Kellogg in Battle Creek, Kroger (King Sooper) employees in Denver, and more throughout the country to earn better wages and benefits, it should not be surprising there is an increased interest and approval in the purpose of a union. Additionally, with the makeup of the current labor market, as noted earlier, individuals have more room to seek jobs that offer better wages, benefits and overall safer and better experience—much of which the mission of unions is based around.