Environmental Injustices Continue in Detroit

Environmental injustice occurs when certain populations, typically those who are marginalized, and the environment are both harmed from certain actions. We have seen this occur with the Flint water crisis and we continue to witness it right here in Detroit. While pollution can come in many forms, it is air pollution that we are focusing on in this post and what is at least one factor in Detroit’s environmental injustice.

Before we dive into some of the sources of Detroit’s air pollution it is important to understand Detroit’s socioeconomic makeup. With a population of about 620,000 residents, 78 percent of the population is black, nearly 25 percent of the population is under the age of 18 and 32 percent of the population lives in poverty, according to the US Census Bureau.

Furthermore, according to the University of Michigan School of Public Health it is estimated that air pollution kills more than 650 Detroiters a year, with thousands more being hospitalized and children missing a disproportionate number of days at school because of illnesses and asthma.

According to the 2021 update on the State of Michigan’s “Detroit: The Current Status of Asthma Burden,” the asthma rate of the in the City of Detroit in 2019 was four times higher than the State of Michigan’s rate. Additionally, there were 1,458 asthma hospitalizations of Detroit residents in 2019.

Between 2017 and 2019, 71 Detroit residents died due to asthma. The rate of asthma mortality among Detroit residents was 31.4 per 1,000,000 population. The rate of asthma mortality in Detroit in 2017-2019 was about three times the rate for Michigan as a whole.

Now, when further digging into asthma rates el, the “Detroit: The Current Status of Asthma Burden,” states that in 2019, the rate of asthma hospitalization among Detroit’s Black population was 31 per 10,000 while the rate among Detroit’s white population was 7.9 per 10,000.  Asthma hospitalization among Detroit Blacks were over three times that of Detroit whites. Michigan Blacks had over five times the hospitalization rate of Michigan whites.

According to the American Lung Association, the exact cause of asthma remains unknown, but there are certain factors that play a role in developing the disease. These factors include family history, allergies, viral respiratory infections, obesity, smoking, certain jobs and air pollution, especially including dust and mold.

As noted in our last post, there are several secondary particle pollution sources that have a negative impact on the area’s air quality in Metro-Detroit. According to climatetrace.org, a global non-profit organization that independently traces greenhouse gas emissions, some of the area’s highest emitters are an oil refinery, two steel plants, an airport and a powerplant. These emitters are:

Marathon Petroleum CO Detroit:

Ranked 378/80,188 Worldwide: for Carbon Dioxide emissions (CO2E)

Cleveland-Cliffs Dearborn Steel Plant

Ranked 296/80,188: for Carbon Dioxide emissions (CO2E)

Detroit Metropolitan Wayne County Airport

Ranked 917/80,188 for Carbon Dioxide emissions (CO2E)

Gerdau Monroe Steel Plant

Ranked 1,450/80,188 for Carbon Dioxide emissions (CO2E)

Monroe Michigan Power Plant (DTE)

Ranked 37/80,188 for Carbon Dioxide emissions (CO2E)

Other secondary sources that contribute to particle pollutants in the Metro-Detroit are the the Mistersky and River Rouge power plants, highways, the Ambassador Bridge and Stellantis manufacturing plants in Warren and on Detroit’s eastside.

The media has long reported the history of the Detroit’s 48217 ZIP code, which is located in Southwest Detroit. With the Marathon plant and the DTE Delray and Mistersky powerplants, along with nearby highways and international trucking routes (Ambassador Bridge and soon to be Gordie Hower International Bridge), the amount of air pollution in this area is at concerning levels.

According to a recent released by the University of Michigan School of Public Health, between 2016-2021 the major source of PM2.5 ( which is fine inhalable particles, with diameters that are generally 2.5 micrometers and smaller) in the area was “mobile sources of emissions,” or vehicle exhaust and construction equipment, at 40 percent. Industrial sources of emissions also contributed a “sizable” amount to the PM2.5 levels, but were on the decline due to recent closures of coal-burning power plants and other facilities in the area.

Another area of growing concern is Detroit’s eastside, where the Stellantis production plant has not only grown to two production lines, but the amount of traffic has also increased due to the addition of a logistics warehouse that services the Stellantis plant. As has been noted in this and previous air quality posts, high traffic and industrial areas are major factors in both environmental pollution and an individual’s health.

So, what we know thus far is that Detroit is a primarily a city composed of minorities, particularly African-Americans and Hiuspanics with a lower median income than neighboring communities in Southeast Michigan. We also know that in Detroit there are pockets of dedicated space for industry, whether it be manufacturing plants, power plants or other forms that push PM2.5 into the air. Poor air quality is not only a major concern for many Detroit residents, but also a reality. This type of environmental injustice has led to severe health problems for thousands of residents, both children and adults.

With strong regulations, from zoning to emission standards and even traffic regulations, we can work toward alleviating environmental injustices. However, as we continue to see at an increasing rate, pollution and other negative impacts on the environment have a long-lasting impact. Advocating for and taking steps to implement equitable solutions when it comes to housing, education and access to jobs is crucial.

Southeast Michigan’s Poor Air Quality a Result of Climate Change

Air quality in Southeast Michigan has been notably poor in recent weeks, with three Ozone Action Days occurring in June thus far. According to the Southeast Michigan Council of Governments, Ozone Action season began on May 1 in Southeast Michigan. This year is the 30th year of the voluntary program that helps keep Southeast Michigan’s air clean. In 2022, there were five Ozone Action days.

As we’ve discussed in previous posts, clean air is vital to healthy populations, and in Southeast Michigan clean air has been hard to come in recent weeks. The Canadian wildfires have been the easy culprit to blame for the poor air quality, the real root of the problem goes much deeper….climate change.

Wayne State University Center for Urban Studies Director Lyke Thompson further dives into what is causing poor quality in Southeast Michigan in this recent opinion piece published by the Detroit Free Press.

Small Businesses Growth in Michigan is Occurring, But at What Pace?

The growth of small businesses, or lack thereof, in Michigan varies depending on the sources.

While we know business closures have declined since the height of the pandemic and business applications continue to be submitted, anecdotes around employment in Southeastern Michigan tell a story that larger companies, which often have the capacity to offer higher wages and additional benefits, are gaining and retaining more employees than smaller businesses.

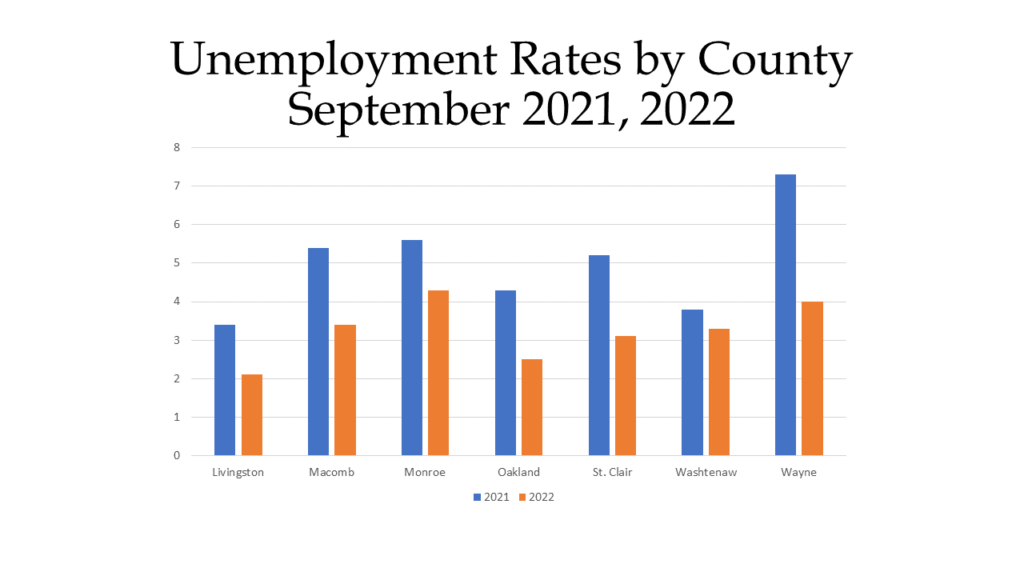
The data that we do know is that, according to a May 2022 press release from Gov. Gretchen Whitmer’s office there are 902,000 small businesses in Michigan which employ 1.9 million individuals.  We also know that unemployment in Detroit and Michigan has seen an overall decline. In September of 2022, according to the Michigan Department of Technology, Management and Budget the unemployment rate for the City of Detroit was 7 percent; the unemployment rate for the State of Michigan was 4.1 percent. These are two of the lowest unemployment rates each area has seen in over two years. When comparing unemployment rates by county between September of 2021 and September of 2022 we again see that unemployment rates for September of 2022 were down from the year prior. Overall, Livingston County had the lowest unemployment rate of 2.1 percent in September of 2022 and Wayne County experienced the largest decline with its unemployment rate changing from 7.3 percent in September of 2021 to 4 percent in September of 2022.

While low unemployment rates are one sign of a strong economy, according to a recent Detroit News article, 88 percent of respondents in a Goldman Sachs survey said small businesses are struggling compared to larger businesses. The reason? According to the survey, 42 percent of respondents said they lost employees to larger businesses that are paying more. With inflation continuing to rise, this is not surprising.

However, despite such challenges laid out by survey respondents, according to the 18th Annual Small Business Association of Michigan Entrepreneurship  Score Card, since 2020 small businesses in Michigan have outperformed the U.S. as a whole in terms of percent growth in businesses open and business revenue.

According to the scorecard, between January of 2020 and Feb. 6, 2022 small businesses in the State of Michigan have opened at a rate of 8.5 percent. In the U.S. small businesses have opened at a rate of 3.1 percent in that time frame. The Michigan rate represents an increase in small business revenue of 24.2% compared to 8% for the U.S., the report stated.

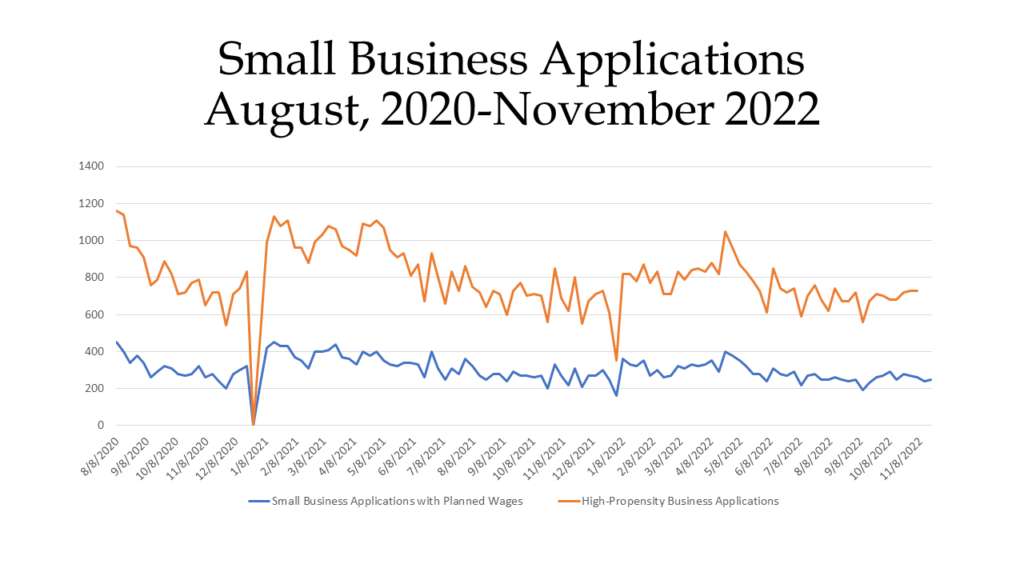
As displayed in the first chart below, the Southeast Michigan Council of Governments (SEMCOG) obtains data for the U.S. Census Bureau on small business applications in Michigan. According to this data, there 730 High-prosperity Business Applications during the week of November 18, 2022 and 250 Small Business Applications with Planned Wages. While the data for each category can shift somewhat dramatically from week-to-week, there is an overall trend of business applications in Michigan increasing since September of 2022 yet decreasing from both earlier in 2022 and since the beginning of the pandemic.

According to SEMCOG, high-Propensity Business Applications (HBA) are applications for a federal Employer Identification Number (EIN) where the characteristics of the application indicate that it is more likely to form a business with payroll. Businesses Applications with Planned Wages (WBA) are a subset of HBA that indicate a first wages-paid date, increasing the likelihood that such a business will have a paid employees.

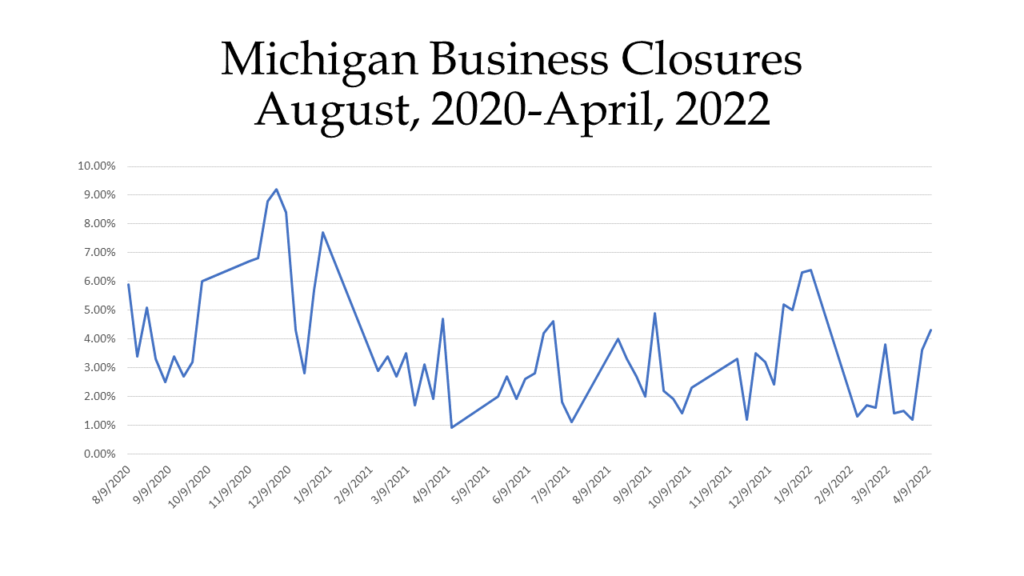
While the data shows businesses continue to open in Michigan, business closures slowed through April of 2022 (The last time such data was available through SEMCOG) compared to early on in the pandemic. According to SEMCOG data obtained from through the Census Bureau’s Small Business Pulse Survey, 4.3 percent of the 900,000 single-location businesses sample size closed during the week of April 9, 2022. The highest percent closure of this sample size was 9.2 percent during the week of November 20, 2020.

One way to help keep small businesses open is to shop local. This is the goal of Small Business Saturday, which occurs the Saturday after Thanksgiving. This is a campaign that American Express began in 2010 to help support small businesses in the midst of the Great Recession. It has certainly seen success over the years, with 51 million shoppers in the U.S. spending more than $23 billion at small businesses in 2021, according to American Express. However, the real takeaway here should be that for every $1 spent at a small business, it is estimated that $0.68 of those funds remain in the local economy (or, for every $100 spent, $68 remains in the local economy). This is something we should consider as part of our regular shopping habits, and not just one day a year.

Michigan’s Energy Consumption Tops its Production

https://forms.office.com/r/WZB2vvRXNt

In Michigan, we consume more energy, overall, than we produce, and the type of energy we produce is more limited than the types of energy sources we consume. For example, according to the Energy Information Administration (EIA), Michigan does not produce any coal for energy. However, in 2020, according to the EIA, 334.4 trillion BTUs were consumed. The coal powered energy consumed in Michigan is brought in from elsewhere, primarily Wyoming and Montana.

The largest energy source produced in Michigan is nuclear energy, with 316.7 trillion BTUs being produced in 2020. The amount of nuclear energy produced in 2020 is nearly a third more than what was produced in 2000; in 2000 196.9 BTUs of nuclear electricity was produced in Michigan. In the last 20 years, the largest amount of nuclear energy produced in Michigan was 344.2 trillion BTUs in 2011.

In 2020 there were three nuclear power plants in Michigan. However, in May of 2022 one of the nuclear power plants shut down. We will dig deeper into Michigan’s nuclear power next week.

While nuclear energy most recently reigned supreme in energy production totals, at one-point, natural gas was the largest energy source in Michigan. The amount of natural gas energy produced in Michigan reached its peak production at 312 trillion BTUs in 2000. Since then, the amount produced has steadily declined. Between 2007 and 2008 the amount of natural gas produced in Michigan declined from 275 trillion BTUs to 162 trillion BTUs. By 2020, the amount produced was 69.9 trillion BTUs. Overall, between 2007 and 2020 the amount of natural gas produced in Michigan declined by 204.7 trillion BTUs.

In 2020, Michigan ranked 19th in the amount of natural gas produced.

Crude oil production has ranged between 45 and 24 trillion BTUs since 2000, with a steady decline happening since 2013. According to the EIA, Michigan ranked 18th out of the 50 states for crude oil production in 2020. In 2020, 24 trillion BTUs of crude oil was produced.  This is a decrease from the 45.9 trillion BTUs produced in 2000.

Crude oil production in the state comes from reserves; in 2020 about 4.5 million barrels of crude oil were produced compared to the 34.7 million barrels that were produced in 1979.  Please note the chart references BTUs, while barrels of crude oil is another measurement used to detail production of this energy source.
The amount of renewable energy produced in Michigan has grown since 2000, outclimbing energy production numbers of crude oil and natural gas. In total in 2020, according to the EIA, 225 trillion BTUs of renewable energy was produced. While this was a slight decrease from 237 trillion BTUs produced two years earlier, it is still an increase overall in the amount of renewable energy produced.

The highest amount of renewable energy produced by a source was from wood and waste since 2000. In 2020 the amount of wood and waste renewable energy produced in Michigan was 99.4 trillion BTUs, a decline from the 119.5 trillion BTUs in 2018.

In 2002, biofuels did not produce any energy, and by 2020 that number increased to 43.1 trillion BTUs. This was a slight decline from the 50.8 trillion BTUs produced.
 
For “other” renewable energy sources, which include wind, solar and hydroelectric energy, there has been a steady increase in production. There was however somewhat of a spike in 2014 when the amount produced shadowed the amount of biofuel energy produced in Michigan. In 2014 there were 58 trillion BTUs of “other” renewable energy produced in Michigan; in 2020 that number increased to 82.5 trillion BTUs.
While there has been somewhat of a shift in the type of energy produced in Michigan, such as a more nuclear and renewable energy being produced and less natural gas, the overall amount produced has remained fairly stable. The gap between the amount of energy produced in Michigan and the amount consumed has also remained somewhat stable, but large. In 2000, there was a 2,559.8 trillion BTU gap between the amount of energy consumed and produced in Michigan. By 2020 that gap only decreased to 1,975.1 trillion BTUs.

As noted last week, Michigan consumes 240.2 trillion BTUs of renewable energy sources, 100.3 trillion BTUs of natural gas and more than three times those amounts in both coal and oil energy sources. With consumption levels where they are at, and the necessary shift to clean energy sources growing greater and greater, Michigan’s energy policies should also shift. There needs to be further encouragement, and enforcement, of creating more renewable energy production sources in the state, with that energy than being used in-state. Michigan should prioritize consuming the clean energy it produces and increasing such production.

Child Homelessness in Michigan is Real

Child homelessness in Michigan is real.

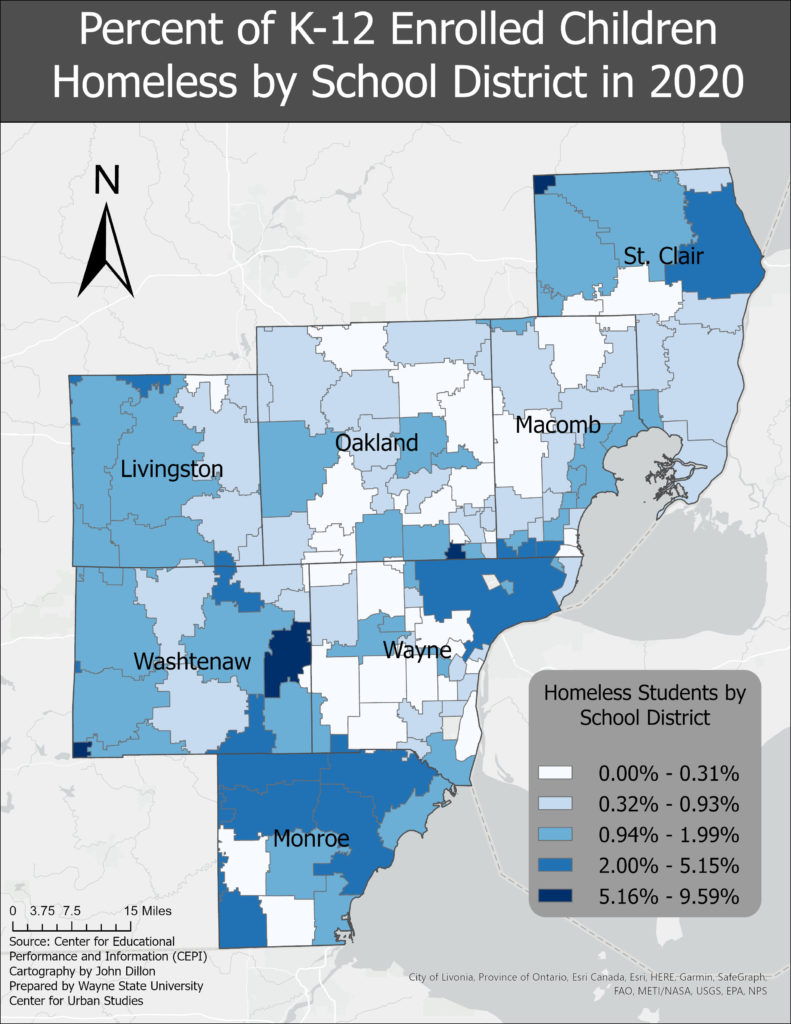
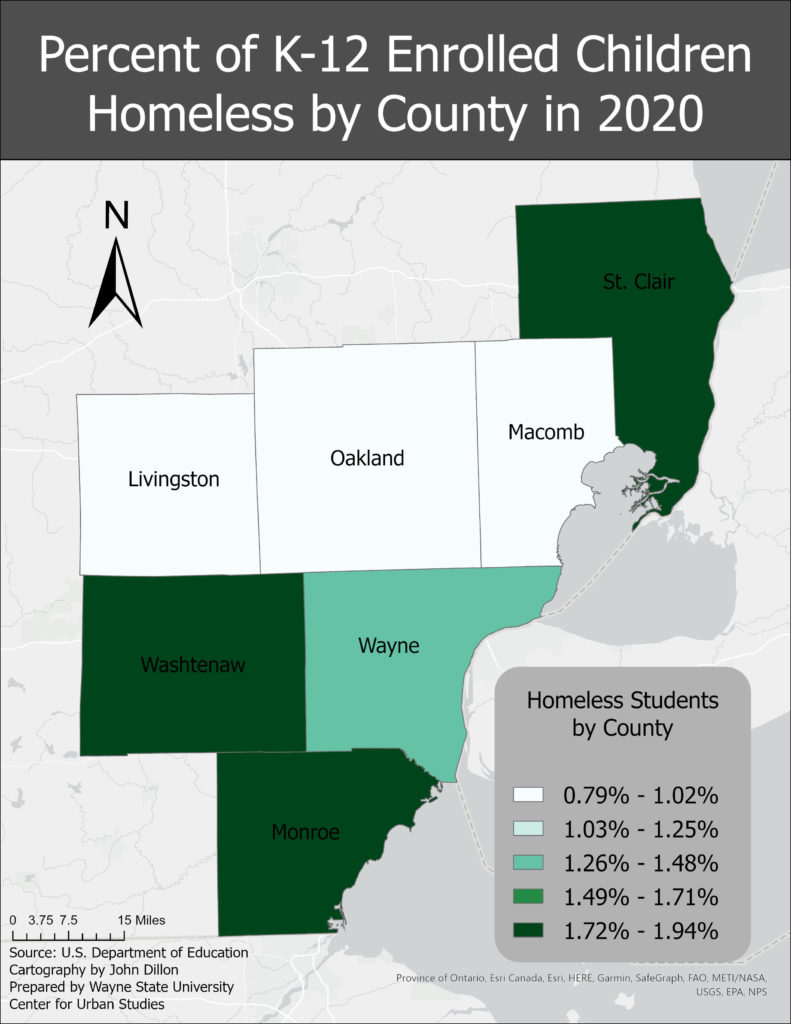
According to the University of Michigan, in more than 40 percent of Michigan’s schools more than 10 percent of students struggle with homelessness during the school year. Furthermore, it is believed that even those numbers are under reported in certain areas, including the City of Detroit. Detroit was estimated to have about a 4 percent homeless student rate for the 2020-21 school year, which was equivalent to about 1,700 students according to the US Department of Education’s Center for Educational Performance and Information. However, as noted, it is believed this number is under reported. While Detroit public schools had the highest total number of students estimated to be affected by homelessness, it was the Ypsilanti School District that had the highest percentage of homeless students in the region. According to the data, the Ypsilanti School District had the highest estimated homelessness rate for the 2020-21 school year at about 10 percent, which was equivalent to about 340 students. Oak Park Public Schools had the second highest percentage of homeless students for the 2020-21 school year at about 9 percent, which was equivalent to more than 340 students.

As shown in the maps above homelessness impacts students throughout the region, but those who live in more urban and/or rural districts are impacted more. While the Center for Educational Performance and Information reports the percentage of estimated homeless students, it does not breakdown the age groups most affected. But the 2022 report from the University of Michigan’s Poverty Solutions Initiatives highlights that most homeless students are teenagers, Black, Native American and/or Hispanic and/or transgender.

This report further breaks down that the percentage of Black, Native American and Hispanic homeless students in Michigan in 2019 was 8 percent, 8 percent and 7 percent, respectively. Additionally, it was reported that about 25 percent of transgender youth in Michigan were homeless, according to the study.

While the data shows there are certain demographics that are more impacted by homelessness than others, it is clear that it impacts thousands upon thousands of students in Michigan—more than 22,000 to be exact. Many of these students are unaccompanied minors who don’t often access homeless shelters, or utilize public services. Policy shifts must occur to not only protect students from homelessness, but also provide greater safety nets for them to access healthcare, nutritional and housing services if they do experience homelessness. This means greater investment into K-12 programs, transitional foster care programs and stronger policies to prevent family homelessness.

Union Membership in Michigan Rises

In 2020 there was an increase in the percentage of employees who were members of a union; there was also an increase the percentage of employees who were represented by unions. This comes after an overall decline in union membership and representation since 2010, according to the Bureau of Labor Statistics (BLS). In 2010 16.5 percent of employees were members of a union in Michigan and 17. 3 percent were represented by a union. In 2020 15.2 percent of employees were members of a union and 16.6 percent were represented by a union; both categories experienced increases from 2019. Overall in Michigan in 2020 there were 604,000 union members.   In addition to these members, another 57,000 wage and salary workers in Michigan were represented by a union on their main job or covered by an employee association or contract while not union members themselves.

While the BLS does not track union membership by sector or occupation at the state level, nationally the BLS reports that the union membership rate of public-sector workers is more than five times higher than the rate of private-sector workers who are union members. According to the BLS, 33.9 percent of the public-sector employees were union members in 2021. Of those public-sector employees in the union, majority were represented those in the education, training, library and protective service occupations. The percentage of private-sector employees who were union members was 6.1 percent in 2021. According to the BLS, and a recent New York Times article, majority of the union membership decline has come from the private sector. Nationally, private-sector union membership was at 6 percent in 2021 and in 1983 it was at 17 percent.

Overall there are a greater number of private-sector employees than government employees, and while the charts below show there was a decline in the total number of employees in both sectors after COVID, the lack of union representation in the private-sector is causing, at least some, to leave their jobs, according to the New York Times article. With a shift in the labor market and workplace practices since the pandemic began, more and more workers are feeling confident in their ability to leave jobs that don’t fit their needs. While the New York Times sites that this doesn’t always leave to increased union activity, the current labor market has certainly allowed more people to be more vocal and how their employer can meet their needs, and not just the other way around.

Labor unions have experienced an overall increase in sentiment since 2009, according to Gallup, with 68 percent of those polled expressing approval of labor unions in 2021. This approval rate is the highest it has been since 1965 when there was a 71 percent approval rating. With increased media attention on the successful efforts of employees at Kellogg in Battle Creek, Kroger (King Sooper) employees in Denver, and more throughout the country to earn better wages and benefits, it should not be surprising there is an increased interest and approval in the purpose of a union. Additionally, with the makeup of the current labor market, as noted earlier, individuals have more room to seek jobs that offer better wages, benefits and overall safer and better experience—much of which the mission of unions is based around.

The $100K Home May Soon be a Dream of the Past in Southeastern Michigan

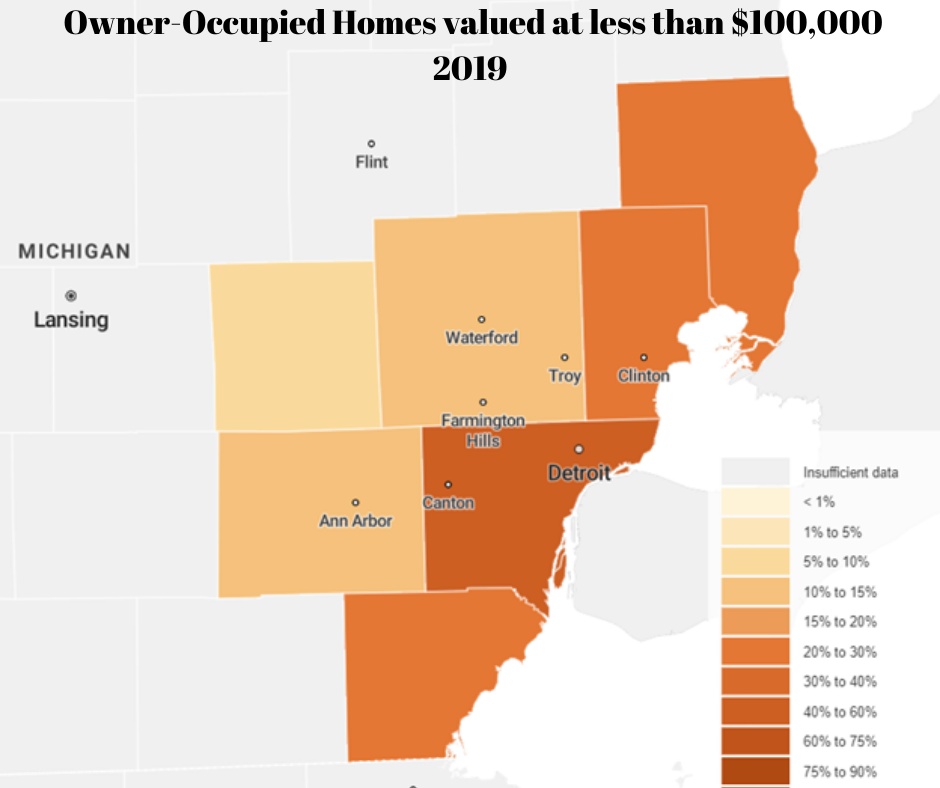
Housing prices continue to soar in the Metro-Detroit region, and beyond.  According to the Case-Shiller Home Price Index, the average price of single-family dwellings sold was $154,160 in July of 2021; this was $1,560 higher than the average family dwelling price in June. Furthermore, the July 2021 price was an increase of $21,700 from July of 2020 and $56,030 from July of 2014. This means, that the average single-family dwelling was being sold for under $100,000 in 2014. The data below shows how pressed a homebuyer would be to find a home for such a price in 2019 (most recent American Community Survey), meaning it is even more difficult today.

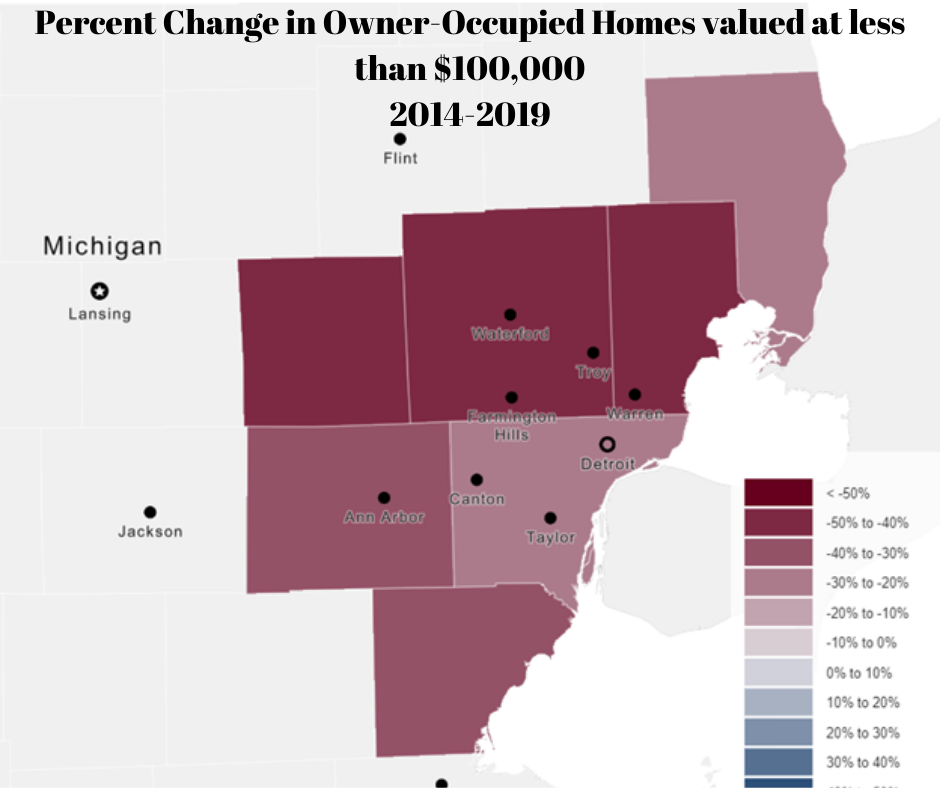
According to the 2019 ACS data, Wayne County had the highest percentage of owner-occupied units that were valued at less than $100,000 at 44.8 percent. The percentage of owner-occupied homes valued at less than $100,000 available in Wayne County in 2019 was 24 percent less than what was available five years prior (2014). Wayne County experienced the smallest decline in owner-occupied units valued at less than $100,000, while Oakland County experienced the largest. In 2019, 12.5 percent of the owner-occupied units in Oakland County were valued at less than $100,000. That number is a 47 percent decrease in the percentage of owner-occupied units valued at less than $100,000 in 2014—five years prior.

While Oakland County had the largest decline in the percentage of owner-occupied units valued at less than $100,000 between 2014 and 2019, it was Livingston County that had the smallest percentage of owner-occupied units valued at less than $100,000 both in 2014 and 2019. In 2019, 8 percent of Livingston County’s owner-occupied housing stock was valued at less than $100,000 and in 2014 it was 14 percent (still the lowest in the region).

Overall, the data shows some of what we already know—particularly that housing prices continue to increase, and at a more rapid rate than in previous years. However, we also know that wages are not increasing with the rate of inflation, and for many, with the rate of increased home prices. As affordable housing continues to remain an issue, it is important to understand where those gaps are also growing at an increased rate. The data shows that, regionally, Wayne County had the largest percentage of homes available for under $100,000, with the number available decreasing at the slowest rate.

Majority of Detroit Home Problems Involve Water Inside

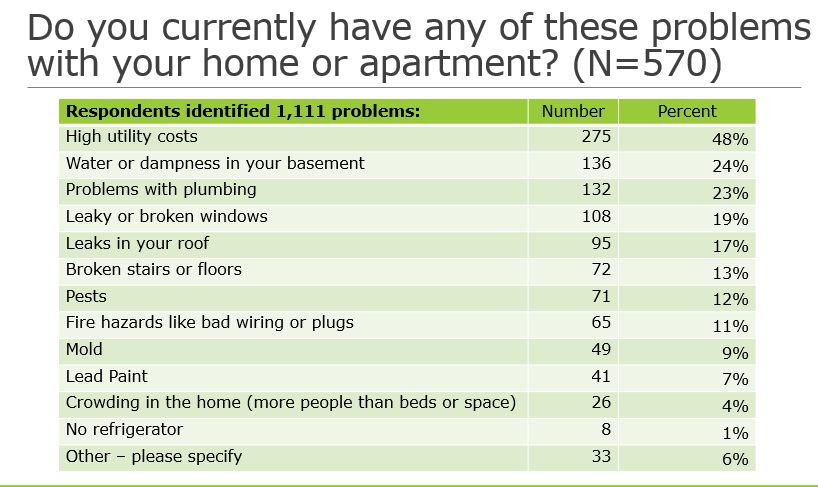
There are household problems, and then there are home problems. Home problems range from lead paint to inadequate infrastructure to high utility costs. The respondents of the 2021 Detroit Citizen Survey were provided a list of home problems and asked to identify which ones apply to their house or apartment. There were 570 respondents to this question and of those a total of 1,111 problems were identified.

High utility costs was the most common problem, which was identified by 275 people or 48 percent of the respondents. Water or dampness in the basement was the second most identified problem and plumbing issues was the third. Four of the five top problems (mentioned by 83% of householders) concern water in the home, and mold is later mentioned by another 9 percent. Water and dampness in homes is highly correlated with asthma, which is one of the most frequently occurring problems for children and adults in Detroit.

The University of Michigan recently produced a study titled “A Decent Home: The Status of Home Repair in Detroit,” which found that more than 24,000 housing units in Detroit are “severely or moderately inadequate,” but only about 3,000 residents were able to access funds to fix the problems. These funds are aimed at low income residents and provided through grants or loans.

A little background about Detroit’s housing stock, according to the US Census Bureau, 78 percent of Detroit’s housing stock was built before 1960. Of the occupied housing units in the City, 75 percent are worth less than $100,000. Additionally, 67 percent of the occupied rental units have rental prices of less than $1,000. The age of housing and its cost plays a role in ongoing home problems, as does the average income of a household. According to a Bridge Detroit article, 73 percent of Detroit renters earned less than $35,000 in 2019, and about half of those households spent at least 50 percent of their monthly income on rent in. This means either less money for home repairs or having to live in housing units that are less than desirable.

The City of Detroit does have a 0% Home Repair Loans Program that offers zero percent interest loans from $5,000 to $25,000 to help Detroit homeowners invest in and repair their homes. Projects that are eligible for funding through this program include correcting health and safety hazards, electrical repairs, furnace replacement, roof replacement and plumbing. Jefferson East Inc. and Rocket Community Foundations are two other organizations in the City that offer funding for home repairs

Detroit, Wayne County Remain Epicenter for Coronavirus

The total number of COVID cases in Michigan increased to 29,263 (Chart 1), which was equivalent to 293 cases per 100,000 people (Chart 2) on April 16. Of those total COVID cases, the City of Detroit had 7,382 cases, Oakland County had 5,778 cases, Wayne County (excluding Detroit) had 5,619 cases and Macomb County had 3,992 cases (Chart 3).  The number of confirmed cases in Washtenaw, Livingston, Monroe and St. Clair counties combined totaled 1,538, with Washtenaw County accounting for 826 of those cases,  according to the most recent data from the State.

The daily data highlighted in these posts is from Michigan.gov/coronavirus, where data is updated daily at 3 p.m. Historical data was supplied from covidtracking.com, which republishes COVID data from the State.

In Chart 4 we see that the City of Detroit has consistently had the highest number of COVID cases per 100,000 people, which was a rate of 1,097 on April 16. Oakland County had the second highest rate at 859 cases per 100,000 people and Wayne County (excluding Detroit) had 835 cases. Macomb County had 593 COVID cases per 100,000 people. When looking at Chart 4 we also see that there were per capita increases for every county between April 15 and April 16, with Detroit having the largest day-to-day per capita rate increase at 36.

Chart 5 shows that Detroit, Macomb, St. Clair, Wayne and Washtenaw counties experienced decreases in the number of new COVID cases between April 15 and April 16. On April 16, Detroit reported the highest number of new COVID cases at 246. Wayne County had 211 new cases, Oakland County had 202 and Macomb County had 200. Washtenaw County had the fifth highest number in the region at 28 new cases.

When looking at new COVID cases on a per capita basis, the data shows that Detroit and Macomb County still have the highest rates (Chart 6). According to the data, on April 16 Detroit had 37 new COVID cases per 100,000 people and Macomb County had 23 new COVID cases per 100,000 people; Wayne County had 20 and Oakland County had 16.  In Oakland County, the number of new COVID cases per 100,000 people has been decreasing since April 14.

In addition to the raw data of confirmed cases, we also show the percent change in the number of cases reported day-to-day. On April 16 the percent change from April 15 was 4.29 percent, an increase from the day’s prior change of 4 percent.

Originally, we were reporting the day-to-day percent change in the number of cases from March 16. However, there was a spike in the number of tests available early on that made this data set also spike (on March 18 the day-to-day percent change as 320%). We have now started showing percent change data from March 21 forward to allow readers a more precise visual. If you would like to see the earlier versions of this data set please review our earlier posts. 

It was reported by the State of Michigan that on April 16 the total of COVID-19 deaths reached 2,093. This was a 9 percent increase from April 15, which had a slightly smaller increase of 8.7 percent of the day prior (Chart 9). The 2,093 total deaths reported for April 16 was 172 deaths higher than what was reported on April 15 (Chart 10). According to the State of Michigan, the reported increase in deaths on April 16 is related to a new weekly death certificate review the Michigan Department of Health and Human Services has put in place. As a part of this process, records that identify COVID-19 infection as a contributing factor to death are compared against all laboratory confirmed cases of COVID-19 in the Michigan Disease Surveillance System (MDSS). If a death certificate is matched to a confirmed COVID-19 case and that record in the MDSS does not indicate a death, the MDSS record is updated to indicate the death and the appropriate local health department is notified. These matched deaths are then included with mortality information posted to the State’s Michigan Coronavirus website. As a result of this week’s assessment, the data from April 16 includes 65 additional deaths that have been identified through this methodology.

Of the total deaths reported, the number of COVID deaths in Detroit on April 16 toped over 500 at 546. On April 16, the Michigan Department of Health and Human Services also reported 435 total deaths in Wayne County (excluding Detroit), 420 in Oakland County and 354 in Macomb County. Washtenaw County had 25 deaths and Livingston, Monroe and St. Clair counties all had 10 deaths or less (Chart 11).

On a per capita basis, per 100,000 people, Detroit also continues to have the highest number of deaths per 100,000 people at 81; there were 71 deaths per 100,000 people in Detroit on April 15 (Chart 12). On April 16 Wayne County had 65 COVID deaths per 100,000 people, Oakland County had 62, and Macomb County had 53.

The number of new COVID deaths reported in Detroit on April 16 was nearly three times higher than those reported in Wayne, Oakland or Macomb counties. On April 16 there were 71 new COVID deaths in Detroit, 26 in Wayne County (excluding Detroit), 28 in Oakland County and 24 in Macomb County. Monroe County reported 0 new deaths.

Detroit and Wayne County continue to remain the epicenter of the virus. When looking at the entire state, only one county in the Lower Peninsula has not reported any coronavirus cases and that is Benzie County (near Traverse City). The spread has not stopped, and in areas such as Detroit and Wayne and Macomb counties it doesn’t appear to have slowed much. Oakland County though has reported a decrease in the number of new daily cases for the last few days, and the number of new daily deaths has remained stagnant for the same time period. In Macomb County, the number of new daily deaths has decreased but the number of new daily cases has continued to increase.

Census 2020: Hard to Count Areas in Southeastern Michigan

The goal of the 2020 Census is to count each person in the U.S., based on their primary residence, by April 1, 2020. However, the fear is that several communities in Michigan will be undercounted in the 2020 Census, meaning a lack of federal funding in the future. And a major portion of 7-county Southeastern Michigan area is in the so-called “hard to count” category.

The majority of the Census is completed by households self-responding via mail or online, starting this year. Throughout the country there are areas where self-response rates are very high, and in other areas they are just the opposite. The areas with previously low self-response rates have been deemed as “hard to count” areas; these areas often include minority and immigrant populations, along with renters and children under the age of 5.

Data for this post was provided by City University of New York, and they deemed an area hard to count if its self-response rate was 73 percent or less for the 2010 Census. This percentage is based on the mail return rate from occupied housing units for the 2010 Census.

As the map shows below, at the county level, self-response mail in rates are high throughout Southeastern Michigan, ranging from 78.5 percent to 86.6 percent. Livingston County had the highest self-response rate at 86.6 percent while Wayne County had the lowest at 78.5 percent. Breaking this data down to the census tract level helped determined what areas would be hard to count for the 2020 Census.

Overall, at the county level, five of the seven counties have hard to count populations. Wayne County has the highest hard to count population at 30 percent and Macomb County has the lowest hard to count population (of those with such a population) at 2 percent. Livingston and St. Clair counties did not have any hard to count data available. Wayne and Washtenaw counties are the only two in the region with hard to count populations in the double digits (30 and 10 percent, respectively).

When looking at the counties on a deeper level, by census tract, we see that Highland Park, Inkster and Detroit (all in Wayne County) have the largest hard to count populations in the region. In Highland Park 100 percent of the population is considered hard to count for the 2020 Census; in Inkster that percentage is 91 percent and in Detroit 86 percent of the population is considered hard to count. The top reason for all three of these cities having such a percentage of hard to count populations is due to the high poverty levels. Other reasons, according to AP News, include a high African American population, low response rates to the American Community Survey and a high percentage of children living below the poverty level. Of the hard to count communities in Southeastern Michigan (27), nine have hard to count populations above 50 percent.

Washtenaw County has the second overall highest percentage of hard to count populations. This is because Ypsilanti has 52 percent of the population considered hard to count. Ann Arbor is estimated to have 29 percent of its population designated as hard to count. The main reason for Ann Arbor’s hard to count status is because of the high percentage of residents between the ages of 18-24 years of age (the University of Michigan is located in Ann Arbor); there is also a high proportion of renters there and a high proportion of individuals who move residences from one year to the next. In Ypsilanti there is a high hard to count population due to high poverty levels and the high number of renters.

To ensure overall high self-response rates the Census Bureau has now made it possible for individuals to complete the Census online, by mail and over the phone. If residents do not respond by one of those methods census takers will knock on the doors of homes that have not responded. Additionally, communities throughout the stateare also putting together large outreach campaigns to ensure members of their communities complete the Census. For example, the City of Detroit has a website that lists Census resources, ways to volunteer for outreach events and how to apply for a job with the Census. For more information on the Census visit 2020census.gov.