There are three universities in the state of Michigan that make up the University Research Corridor, an alliance committed to transforming and diversifying the state’s economy. These three universities are the only public universities in the state to have their governing bodies appointed by the voters of the State of Michigan. These universities are Wayne State University (WSU), the University of Michigan (UofM) and Michigan State University (MSU). This post aims to show where students who attend these universities come from within the state, country and across the nation.
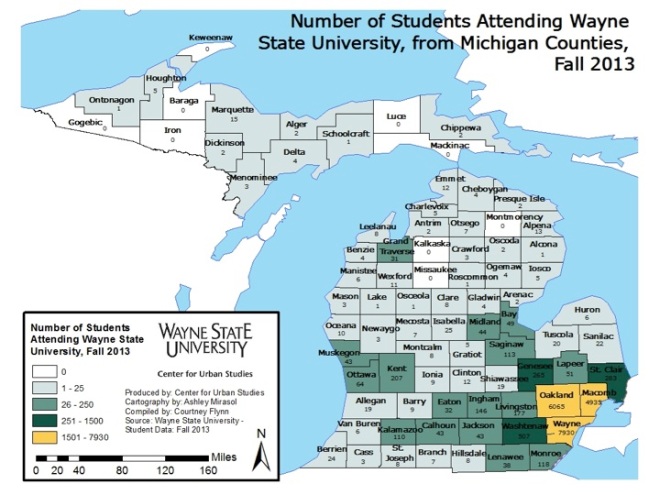
In looking at all three maps, it becomes obvious that WSU’s population is largely representative of residents from the tri-county area (Wayne, Oakland and Macomb Counties). As WSU is historically a commuter school centered in Detroit, this reflects what one would expect. In fall of 2013, about 7,900 of the students who enrolled at WSU lived within Wayne County. During that same time, there were about 6,000 students from Oakland County and about 4,900 from Macomb County. Although Washtenaw County is still within the Southeastern Michigan region, only 507 students were from there; Washtenaw County residents represented the fourth largest population in the state.
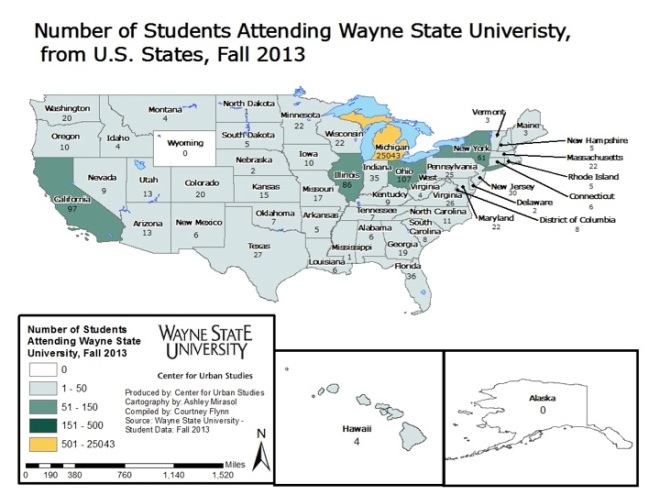
Just as geographic representation decreased the farther away one got from Wayne County within the state, the same continued for states outside of Michigan. Ohio and California were the two states mostly highly represented in fall of 2013 with 107 and 97 students, respectively, coming from each. These two states, individually, had more representation at WSU than some counties in Michigan, such as Jackson and Ionia to name a few.
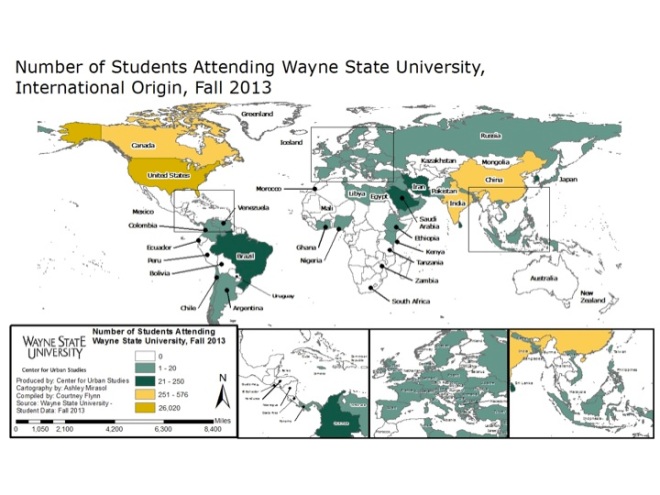
When looking at the geographic makeup of WSU on a global scale, aside from the United States, Canada had the largest population with 576 students and China had the second largest representation with 332 students. There are 26,020 students, including both graduate and undergraduate students, who attended Wayne State in fall of 2013 who were from the U.S.
Overall, enrollment in fall of 2013 was recorded at 27,897 students. Of that, 25,043 (89%) were from within the state of Michigan, 977 (4%) were from another state and 1,877 (7%) were from another country.
Similar to Wayne State University, much of the University of Michigan’s student population came from Wayne, Oakland, Washtenaw or Macomb Counties. For UofM, however, the representation of Washtenaw County residents, where UofM is located, was five times higher than those who attend WSU. Conversely, WSU had more than twice the number of Wayne County residents than UofM.
Although both universities largely drew from the same geographic locations in state, UofM had a much greater overall representation of students from across the state. At WSU, there were some counties with no representation, but at UofM, every Michigan county was represented. Keeweenaw and Oscoda Counties had the lowest in-state representation at 1 student.
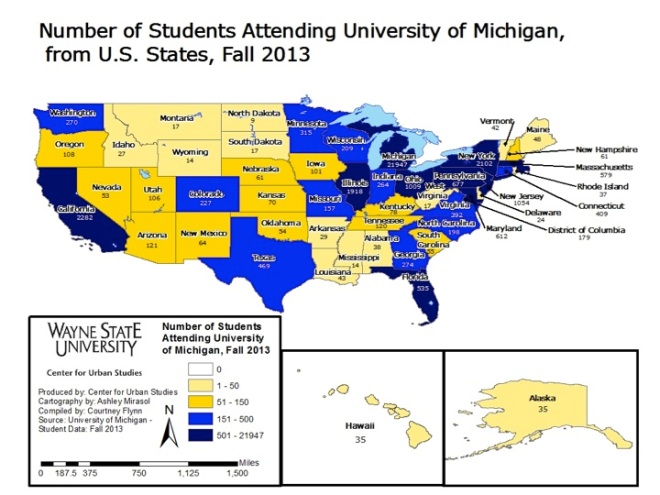
When looking at the representation from across the country, UofM out-did both WSU, and as you will see below, Michigan State University. In fall of 2013, UofM enrolled 15,704 students from across the country (not including Michigan); this represented 36 percent of the student population. Illinois was the state with the largest representation; 1,918 students from there attended UofM in fall of 2013. Only nine students from the state of North Dakota enrolled in UofM at the state time, making it the state with the least representation.
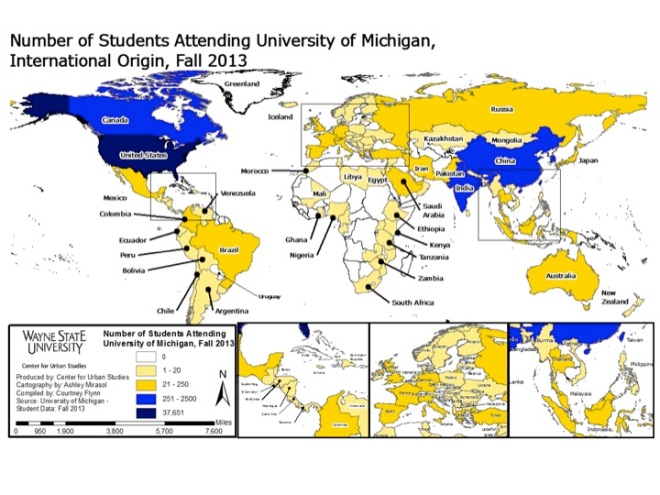
On an international scale, China was the most represented with 2,334 students enrolled at UofM for fall of 2013. The international population at UofM during this time represented about 14 percent of the student body.
Overall enrollment at UofM during this time was 43,710; 37,651 of those students were from the U.S.
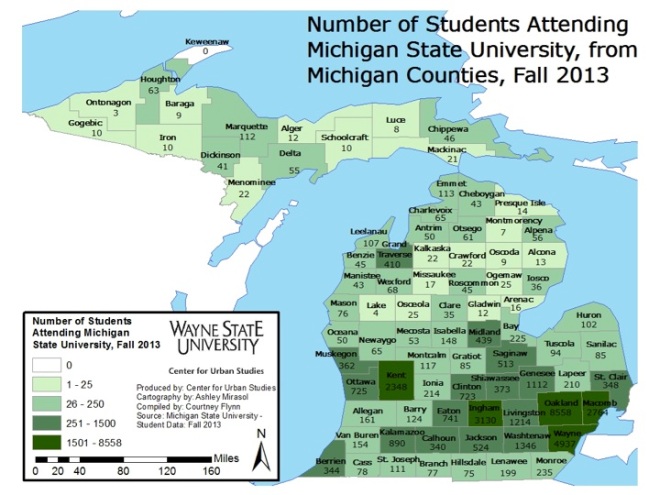
Unlike UofM and WSU, where the largest geographic representation comes from the universities’ home counties, Michigan State University drew the majority of students from outside of the region it is located in (Ingham County). Like its sister schools, Wayne, Oakland, Macomb and Washtenaw counties were heavily represented. From in-state, Oakland County was the most represented with 8,558 students. There were 4,937 students from Wayne County who attended MSU in fall of 2013, 2,764 from Macomb County and 1,364 from Washtenaw County. There were 3,130 students from Ingham County, where MSU is located, who attended the university; this was more than those sent from Macomb and Washtenaw Counties. Kent County was also highly represented with 2,348 students attending MSU in fall of 2013.
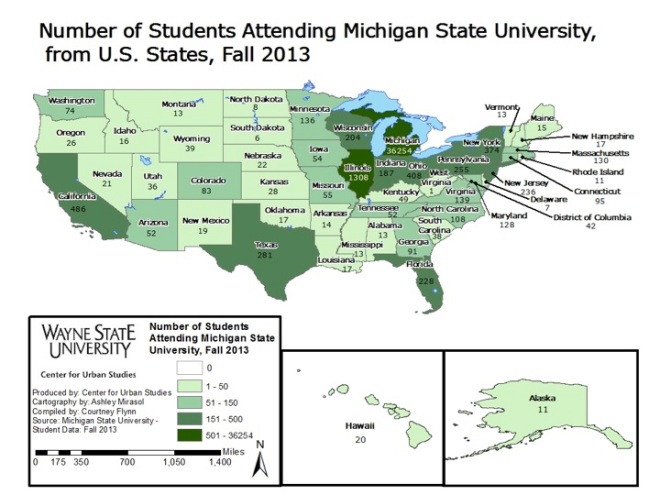
When looking at enrollment from out-of-state residents, Illinois again had the highest representation with 1,308 students. West Virginia had the lowest with one student. Overall, the out-of-state student population at MSU in fall of 2013 represented 11.6 percent of the student body.
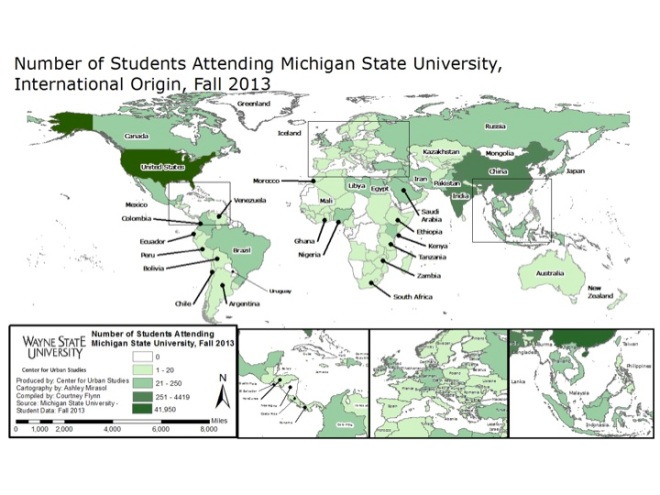
In 2013, 4,419 students from China attended MSU, making it the country with the highest representation, aside from the U.S. The international population at MSU during fall of 2013 represented about 15 percent of the student body.
Overall, in fall of 2013 enrollment at MSU was 49,292; the number of full-time students from the U.S. was 41,950.
For this data set, MSU only counted all full-time students.
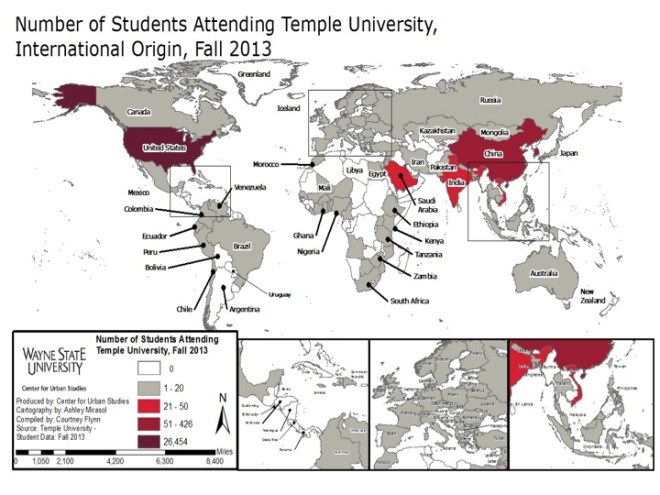
In comparison, above is a map that shows where students who attended Temple University in Philadelphia, Pennsylvania in fall of 2013 originally resided. This university was chosen because it is located in a similar environment as WSU and typically has similar enrollment numbers.
Temple University had 38,148 students enrolled in fall of 2013, of whom 22,318 were from Pennsylvania. The state of New York had the highest out-of-state representation with 564 students.
Overall, the Temple student population of only undergraduate students was 26,454 and the overall student undergraduate population was 27,514.
For the purpose of this post, Temple was the only school to only count undergraduates for its student population.
