-
- From June 2014 to July 2014, the unemployment rate across the state and the city of Detroit increased (monthly);
- The Purchasing Manager’s Index for Southeast Michigan decreased from June 2014 to July 2014 (monthly), but increased over the last month;
- The Commodity Price Index increased from June 2014 to July 2014 for Southeast Michigan (monthly);Standard and Poor’s Case-Shiller Index declined for June.
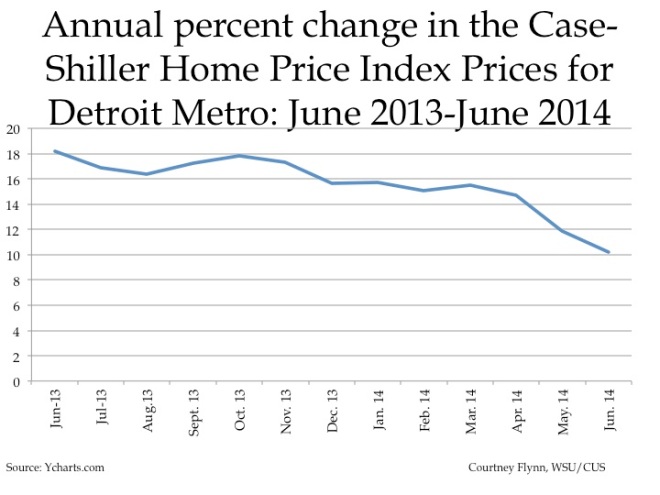
- Data also indicate a decline in the rate of year-to-year increases in the prices of homes in the Detroit Metropolitan Statistical Area;
- Wayne and Macomb counties experienced increases in the number of monthly building permits pulled.
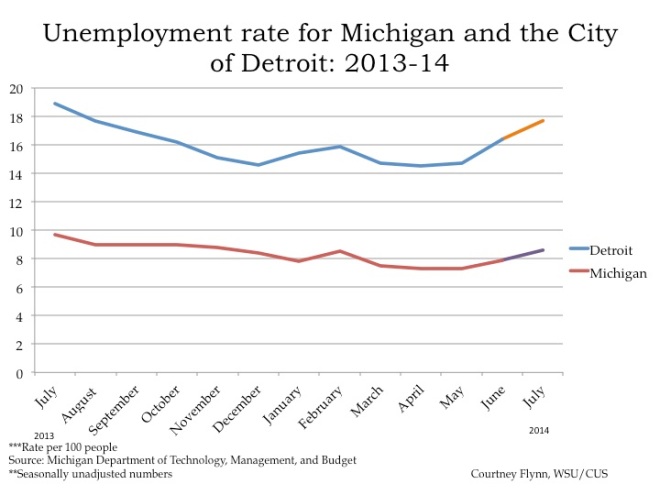 According to the most recent data provided by the Michigan Department of Technology, Management and Budget, from June to July the unemployment rate for the state of Michigan increased from 7.9 to 8.6 percent. The city of Detroit experienced a more severe unemployment rate increase — from 16.4 percent in June to 17.7 percent in July. The unemployment rate in Detroit has decreased 1.2 points since July of 2013.
From June to July the number of people employed in the City of Detroit decreased by about 250, leading to a total of to 284,497 people employed.

The above chart shows the number of people employed in the auto manufacturing industry in the Detroit Metropolitan Statistical Area (MSA) (Detroit-Warren-Livonia) from July 2013 to July 2014. During the period under consideration, the highest employment levels in the auto manufacturing and auto parts manufacturing industries occurred in June 2014, when there were 99,100 people employed in the Detroit MSA. That number dropped by 7,500 people to a total of 91,600 people employed in July.

The Purchasing Manger’s Index (PMI) is a composite index derived from five indicators of economic activity: new orders, production, employment, supplier deliveries, and inventories. A PMI above 50 means the economy is expanding.
According to the most recent data released on Southeast Michigan’s Purchasing Manager’s Index, the PMI for July was 60, a positive increase of 12.9 points from the prior month and 16.9 points from a year ago.

The Commodity Price Index, which is a weighted average of selected commodity prices, was recorded at 59.1 points in July, which was 2.6 points higher than the previous month.
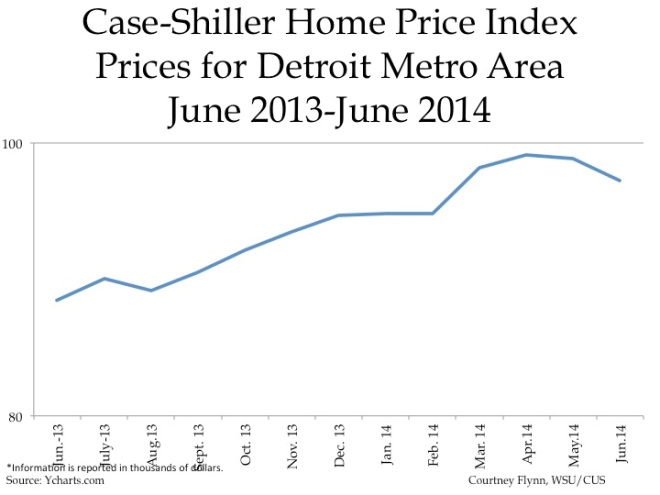
The above charts show the Standard and Poor’s Case-Shiller Home Price Index for the Detroit Metropolitan Statistical Area. The index includes the price for homes that have sold but does not include the price of new home construction, condos, or homes that have been remodeled.
According to the index, the average price of single-family dwellings sold in Metro Detroit was $97,260 in June 2014. This was an increase of approximately $8,790 from the average price in June 2013.
The percent changes in price from the year prior decreased from 18.2 percent in June of 2013 to 10.2 percent in June of 2014. This shows that the prices of area dwellings are not increasing as much as they were at this time last year.


The above charts show the number of residential building permits obtained each month in Wayne, Oakland, and Macomb counties from January 2013 until July 2014. These numbers are reported by local municipalities to the Southeastern Michigan Council of Governments and include single-family units, two-family units, attached condos, and multi-family units.
Oakland County showed a slight increase from June 2014 to July 2014, while the other two showed more substantial increases. Oakland saw 201 permits pulled in June, while in July 205 were pulled. Macomb County experienced the largest increase; in June 153 permits were pulled and in July 274 were pulled.


