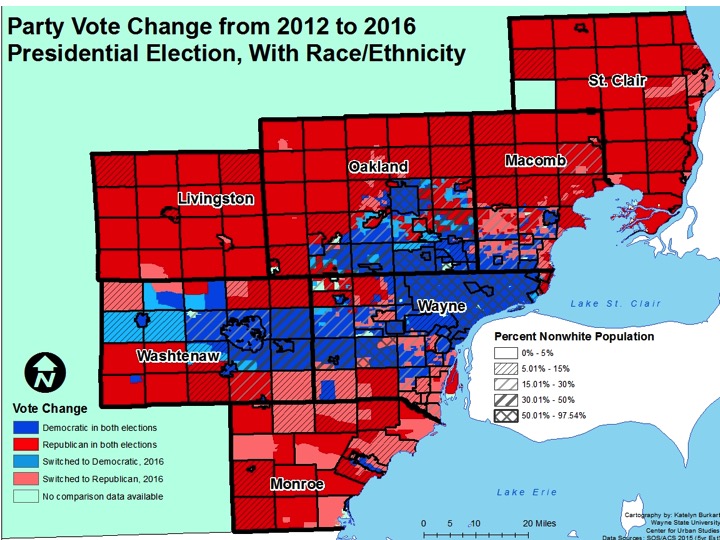
Several of the areas that flipped from Democratic to Republican from the 2012 to 2016 Presidential Elections had populations composed of 15 percent or less non-white populations. There were exceptions to this though in areas in Southern Macomb County and Romulus in Wayne County. The Southeastern Michigan regional map below also highlights that Republican areas, in both elections, almost exclusively had populations where 15 percent or less of the residents were non-white.
Detroit, Highland Park and Royal Oak Township, had the highest percentages of non-white residents and also went Democratic in both elections.
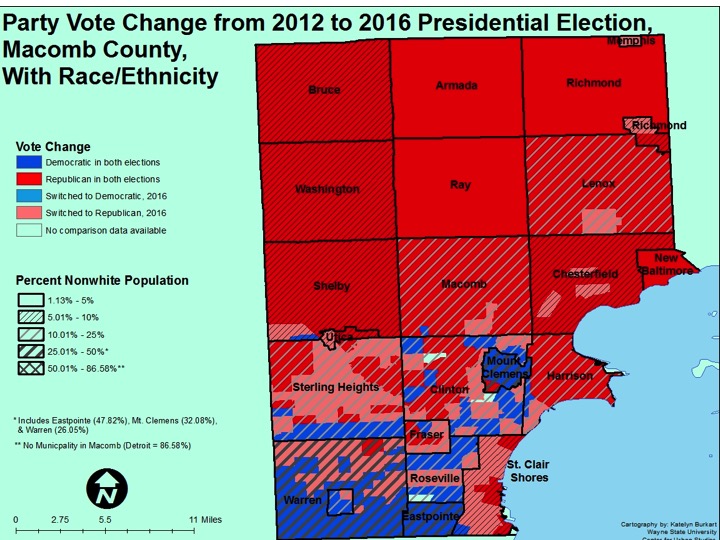
In Warren the non-white population is 26 percent, and it was here and in Sterling Heights were several precincts flipped from Democratic to Republican in Macomb County. Sterling Heights’s non-white population is 16 percent. Portions of Roseville also flipped from Democratic to Republican and here the non-white population is 23 percent.
Of the Macomb County communities with several of precincts that flipped, St. Clair Shores had the lowest percentage of non-white residents at 8 percent. These communities that flipped also had middle-class incomes, as shown in our previous post.
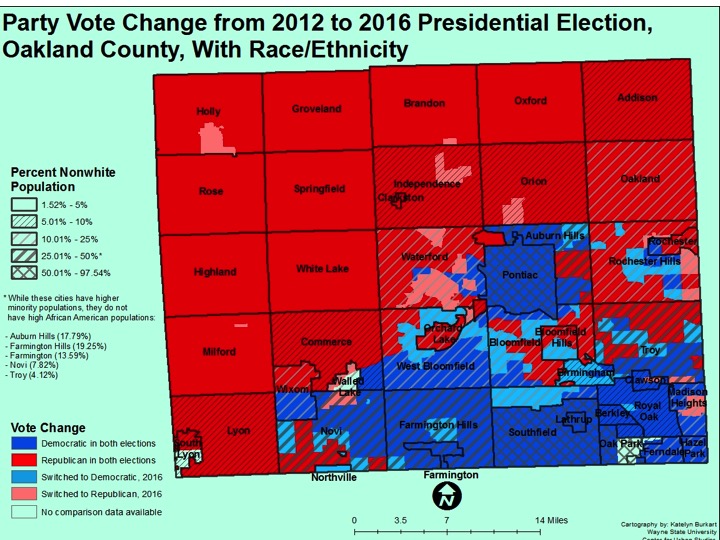
In the areas in Oakland County that flipped from Republican to Democratic (Birmingham, Bloomfield Hills) the percentage of the non-white population typically ranged between 10 and 25 percent. Of those communities, West Bloomfield had the highest percentage of non-whites at 25 percent.
As shown in our previous post, these areas also had some of the highest median incomes in the region.
Of the communities in Oakland County that had several precincts that remained Republican in both elections, Novi and Troy had the highest percentage of non-white populations, 14 and 31 percent, respectively.
Communities that remained entirely Republican across both elections varied substantially from many that had less than ten or even 5 percent non-white to a few precincts that had between 10 and 50 percent non-white residents.
The City of Southfield had the highest percentage of non-white populations of the communities that remained Democratic at 75 percent.
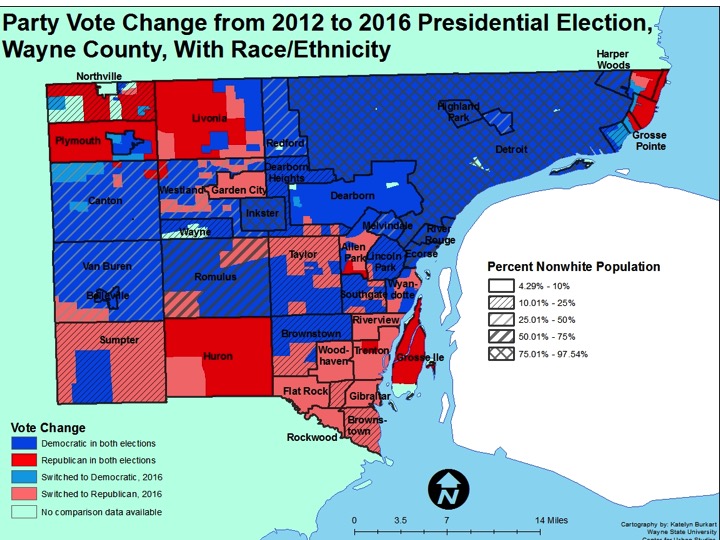
Highland Park and Detroit had among the highest non-white populations in both the region and the state. Both of these communities, along with several others surrounding them (River Rouge, Ecorse, Redford, etc.) went Democratic in the 2012 and 2016 elections. As we’ve highlighted throughout this series, the Downriver area had several communities flip from Democratic in 2012 to Republican in 2016. These communities have mid-range incomes, and the majority, with the exception of Brownstown and Taylor, had non-white populations below 15 percent. Brownstown had a non-white population of 16 percent and Taylor had one of 23 percent.
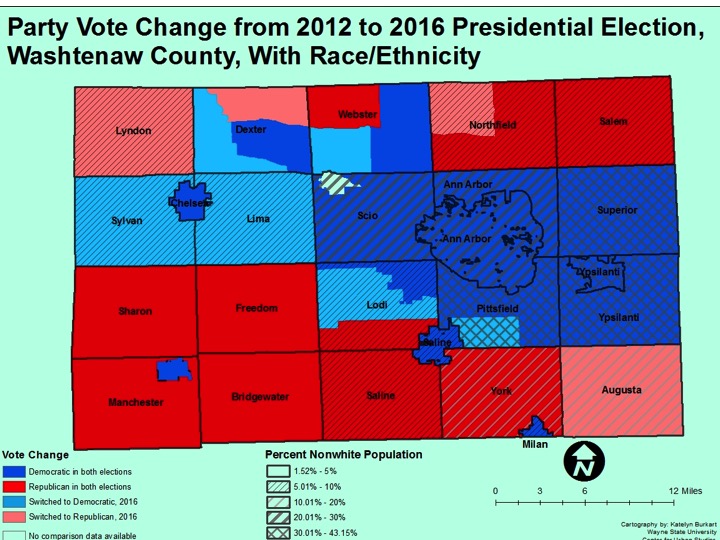
Pittsfield, Superior and Ypsilanti had the highest percentages of non-white populations in Washtenaw County, with the City of Ypsilanti having the highest at 38 percent. It was Lima, Sylvan and portions of Dexter, Webster, Lodi and Pittsfield townships that flipped from Republican to Democratic between the two elections. Pittsfield had the highest percentage of non-white populations of these communities at 37 percent and Webster had the lowest at 3 percent.
While there were portions of Dexter that flipped Democratic, there were also portions that flipped Republican. The township’s non-white population stands at 3 percent. However in Augusta and Lyndon, two communities that flipped entirely Republican, the non-white population percentages were 14 and 10 percent, respectively.
Our last post showed that majority of the communities that flipped from Democratic to Republican had mid-range incomes. In this post the data does not show a consistent trend on the racial makeup of communities that flipped. For example, in Southern Macomb County, Warren, Roseville, Sterling Heights and Clinton Township all had non-white populations above 15 percent while in the Downriver communities in Wayne County majority had non-white populations below 15 percent (Taylor and Brownstown were the exception).
One trend this post did show though was that communities with non-white populations above 25 percent went Democratic in both elections. On the opposite end of the spectrum, areas that stayed Republican across both elections almost always had populations where 15 percent or less of the residents were non-white.