On Feb. 21, 2022, anglers on the Huron River in downtown Flat Rock, Michigan, noticed an oily sheen on the surface of the water near Flat Rock Metal, a steel processing company. Following investigation by the emergency response branch of the Environmental Protection Agency (EPA), the source was determined to be a leaking 10,000-gallon underground storage tank located underneath Flat Rock Metal’s headquarters. The building was originally constructed by Henry Ford approximately 100 years prior and originally operated as the Ford Motor Company Lamp Factory. Flat Rock Metal purchased the building from Ford in the 1980s, and neither the owners nor the State of Michigan claim to have known about the tank until this incident occurred (Dickson, 2022; Ellison, 2022; House, 2022).
Underground storage tanks (USTs) are tanks with associated pipe systems that contain at least 10 percent of their volume underground. USTs that contain petroleum or other hazardous substances, such as those found at gas stations, industrial plants, and municipal facilities, are regulated at both the federal and state level; these are also referred to as non-residential USTs. Smaller USTs frequently found at older residential properties and farmsteads that would have been originally used to store heating oil are not covered by these same rules.
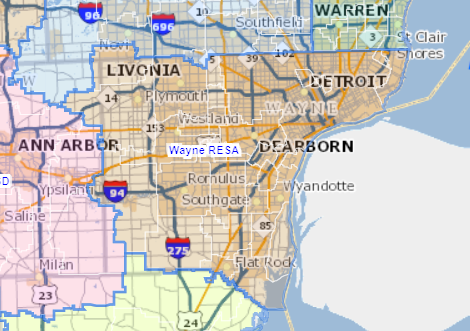
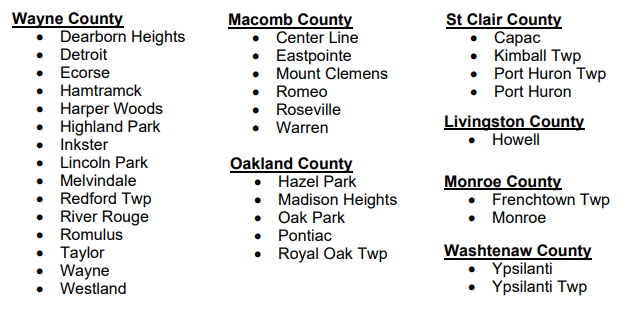
The primary source of regulation for non-residential USTs nationally is the Energy Policy Act of 2005, which requires owners to inspect USTs every three years and retain records of doing so (EPA, 2024a). In Michigan, Part 201 of the Natural Resources and Environmental Protection Act of 1994 (NREPA) revolves around remediation for any environmental contamination. Part 213 of this same act focuses specifically on leaking USTs, mandating that owners/operators perform corrective actions such as assessment, cleanup, removal, and monitoring, among others. The following maps show facilities in violation of Part 201 or Part 213 in the City of Detroit and in Macomb and Oakland counties.

The map above shows that there are 2,323 Detroit USTs in violation of the regulations mentioned above. The highest concentration of these UST sites is along Detroit’s riverfront, where many industrial sites are located. The map of Oakland and Macomb counties below shows that the concentration of USTs tends to be along major travel corridors (Gratiot Avenue, Van Dyke, I-275 and 8 Mile Road) and in the area surrounding the City of Pontiac).

As of 2024, Michigan remains one of only 10 U.S. states without an approved UST program, alongside the other Great Lakes states of Wisconsin, Illinois, Ohio, and New York. According to the EPA, to receive program approval, states must establish standards for program criteria that are not less restrictive than federal standards, provide for enforcement of regulations, and, at a minimum, regulate the same USTs are also regulated by the federal government (EPA, 2024b). In Michigan, USTs are regulated by two different State departments. The Department of Energy, Great Lakes, and the Environment (EGLE) transferred much of the oversight of USTs and aboveground storage tanks (ASTs) to the Department of Licensing and Regulatory Affairs (LARA) in 2012. The Remediation and Redevelopment Division of EGLE still reviews assessment and closure reports following the detection of a release from a UST (EGLE, n.d.).
The most common reasons for leaking USTs are corrosion and faulty installation of the tanks and/or associated piping. While more modern USTs are usually constructed using double-walled fiberglass, many of the decades-old USTs were constructed out of bare steel, which, over time, breaks down to soft ore. The rate at which this happens depends on soil characteristics, groundwater chemistry, and weather (Wang et al., 2009). According to the EPA’s UST mapping tool, the UST Finder, 405 USTs in the City of Detroit are currently in use with “active” status, and 899 are currently in use with “active – expired” status (meaning their permit is expired but they remain in use). Of the total active/active-expired facilities, nearly 11 percent are identified as having asphalt-coated or bare steel construction (EPA, 2024c).
Drinking water in the City of Detroit and the inner ring suburbs is drawn primarily from surface water in the Detroit River (Great Lakes Water Authority, n.d.). While the immediate threat of leaking USTs is to groundwater, contaminants will eventually discharge back into the nearest stream or water body as part of the hydrologic cycle (U.S. Geological Survey, 2019). However, a number of the USTs with recorded releases in the metropolitan area outside of Detroit are located within groundwater wellhead protection areas (EPA, 2024c; EGLE, 2024), further highlighting the need for regulation, and removal, of USTs.
The overall best solution to leaking USTs is the systematic removal of them and remediation of the surrounding areas where they were installed. Professionals from variety of disciplines will be needed to effectively implement this solution, including geologists, environmental engineers, public health officials, planners, and communication professionals. Currently, many removal and remediation projects are initiated only after a release from a leaking UST. Recently, EGLE’s Remediation and Redevelopment Division launched the Remediation Information Data Exchange (RIDE), which allows the public to view information about contaminated facilities. However, the State of Michigan and the EPA regional office must actively work together to develop an approved program that meets the federal agency’s requirements. At the same time, a more active program removal of leaking tanks should be undertaken by the State and local governments along with a steady pace of legal action to force owners or former owners to clean up their mess.
References
Department of Energy, Great Lakes, and Environment (EGLE). (n.d.). Leaking Underground Storage Tanks Program. https://www.michigan.gov/egle/about/organization/Remediation-and-Redevelopment/lust
Department of Energy, Great Lakes, and Environment (EGLE). (2024, April 16). Wellhead Protection Areas. https://gis-egle.hub.arcgis.com/datasets/wellhead-protection-areas-whpa/explore?location=42.623196%2C-83.298896%2C12.99
Dickson, J. D. (2022, March 4). Underground storage tank believed culprit in Flat Rock spill. The Detroit News. https://www.detroitnews.com/story/news/local/wayne-county/2022/03/04/flat-rock-chemical-spill-huron-river-likely-underground-storage-tank/9374643002/
Ellison, G. (2022, March 4). Century-old buried storage tank the culprit in Huron River oil leak. MLive. https://www.mlive.com/public-interest/2022/03/century-old-buried-storage-tank-the-culprit-in-huron-river-oil-leak.html
Environmental Protection Agency (EPA). (2024a, January 12). Inspecting underground storage tanks: 2005 Energy Policy Act. https://www.epa.gov/ust/inspecting-underground-storage-tanks-2005-energy-policy-act
Environmental Protection Agency (EPA). (2024b, July 15). State underground storage tank programs. https://www.epa.gov/ust/state-underground-storage-tank-ust-programs#how
Environmental Protection Agency (EPA). (2024c, February 23). UST Finder. https://www.epa.gov/ust/ust-finder
Great Lakes Water Authority. (n.d.). Our Water System. https://www.glwater.org/our-system/water-system/
House, K. (2022, March 2). Flat Rock’s second chemical spill points to hazards of underground tanks. Bridge Michigan. https://www.bridgemi.com/michigan-environment-watch/flat-rocks-second-chemical-spill-points-hazards-underground-tanks
U.S. Geological Survey. (2019, March 2). Groundwater/Surface Water Interaction. https://www.usgs.gov/mission-areas/water-resources/science/groundwatersurface-water-interaction#:~:text=Surface%20water%20seeps%20into%20the,and%20groundwater%20quality%20and%20quantity.
Wang, L. K., Shammas, N. K., Wang, P., & Clesceri, N. L. (Eds). (2009). Remediation of sites contaminated by underground storage tank releases. Handbook of advanced industrial and hazardous wastes treatment (pp. 687-758). Taylor & Francis Group.