Affordable Care Act Making an Impact in Southeastern Michigan

The Affordable Care Act was signed into legislation nearly 11 years ago (March, 2010) and while it has faced hurdles and scrutiny from the public and the public policy world, data shows it has expanded healthcare coverage to Americans. As we continue to battle the COVID-19 pandemic, access to healthcare arguably grows more and more important.

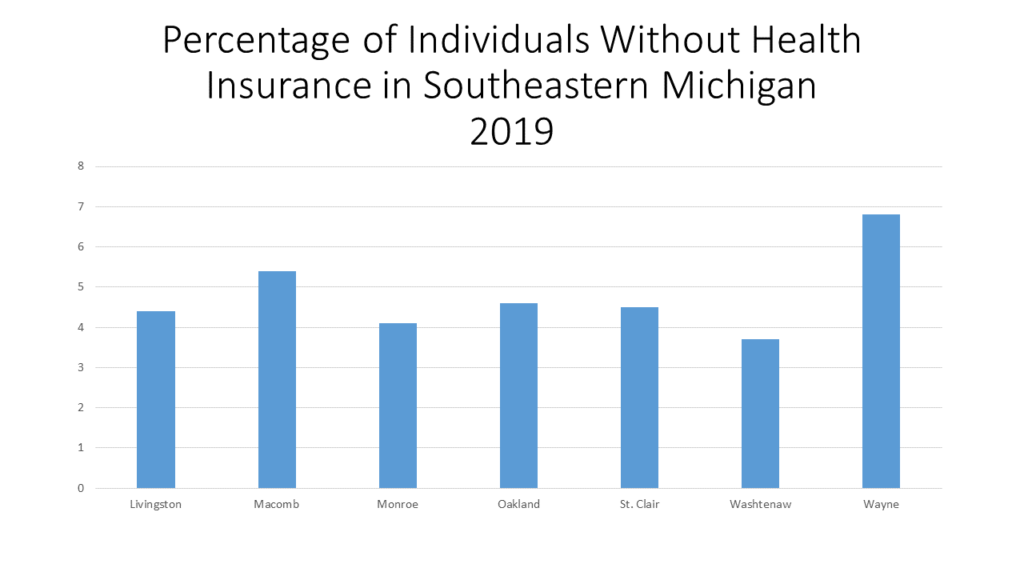
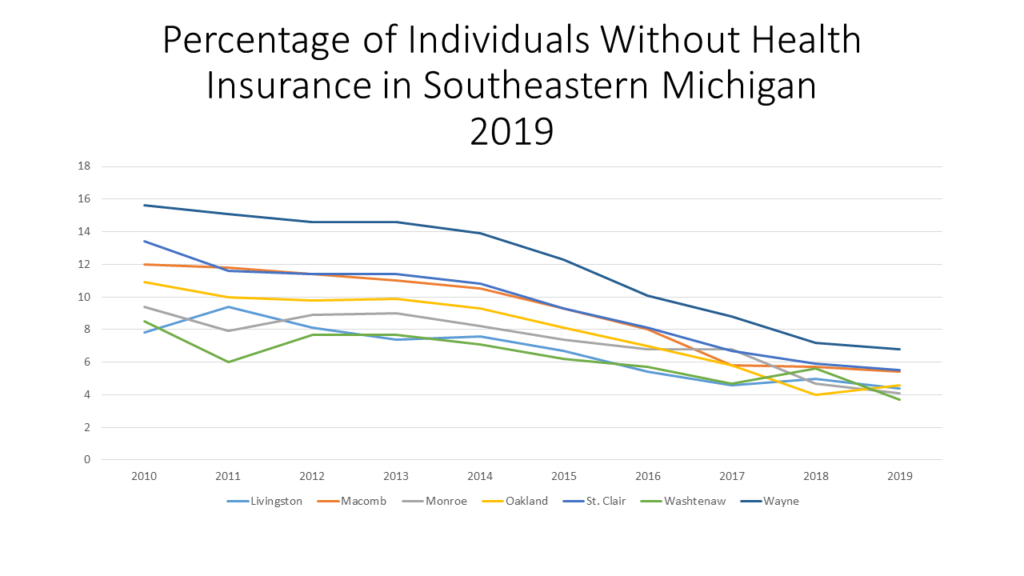
As shown in the first graph below, Wayne County had the highest percentage of individuals without health insurance in 2019 at 6.8, according to the U.S. Census Bureau. Washtenaw County had the lowest percentage at 3.7 percent. The second graph shows that Wayne County, despite continuously having the highest percentage of uninsured individuals, experienced the greatest decline in the percentage of those without insurance between 2010 and 2019 at 8.8 percentage points. In 2010 15.6 percent of the Wayne County population did not have health insurance, and by 2019 that decreased to 6.8 percent.

Overall, all seven counties in Southeastern Michigan experienced a decline in the percentage of individuals without insurance. It should be noted that it was 2014 when the marketplace for health insurance opened, and Medicaid eligibility was expanded. In this time frame Wayne County had the largest decrease in the percentage of individuals uninsured at 7.1 percent, followed by St. Clair County at 6.3. percent. While access to the marketplace has certainly helped in providing individuals with access to health insurance, the expansion of Medicaid has been key, particularly for lower income individuals.

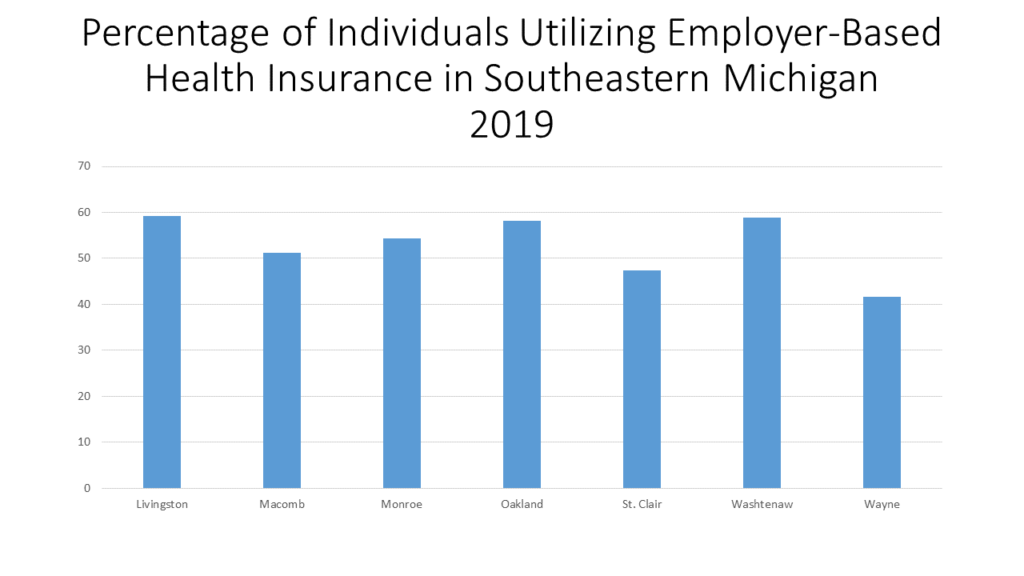
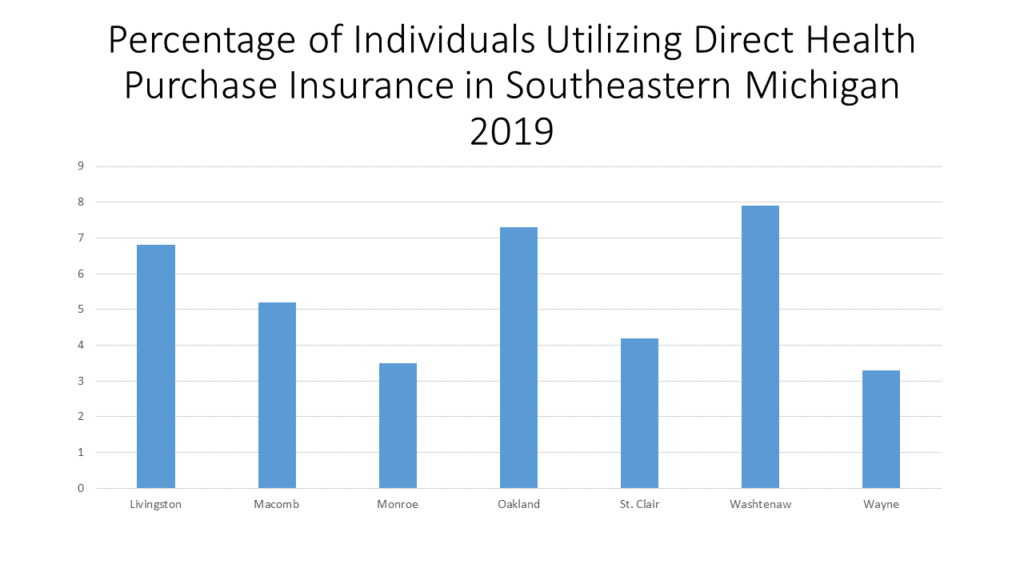
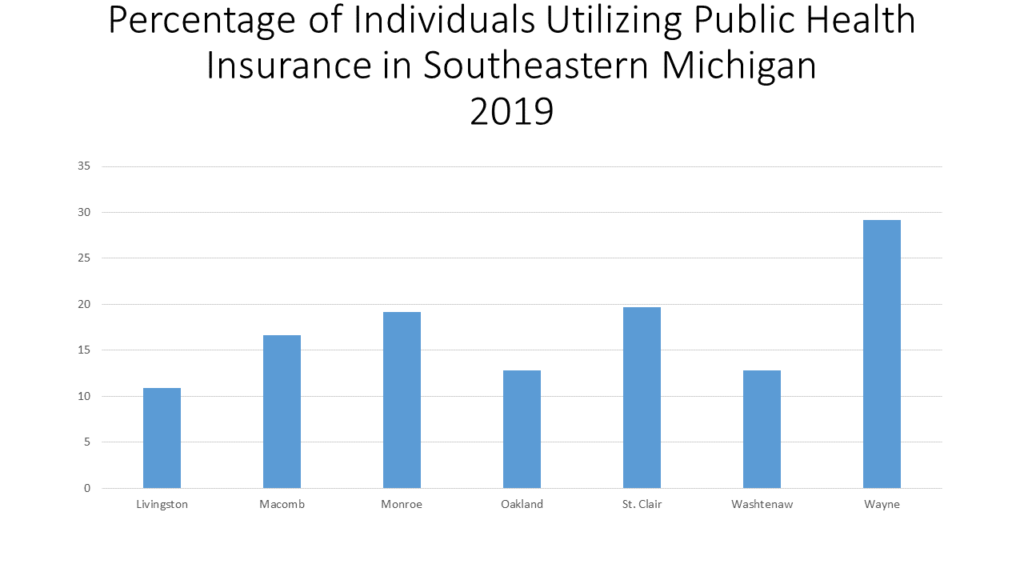
While the percentage of individuals without health insurance remains concerning, we must also be aware of how those with health insurance obtain it. In Southeastern Michigan, majority of the population obtained health insurance from their employers in 2019. In Livingston County, 59.3 percent of the population had employer-based health insurance, which was the highest percentage in the region.  Conversely, Livingston County had lowest percentage of individuals with public health insurance at 10.9 percent (Medicaid or Medicare). Additionally, 6.8 percent of the population in Livingston County purchased their insurance directly in 2019.

In Wayne County, 29.2 percent of the population utilized public health insurance, while 41.6 percent of the population received health insurance from an employer and 3.3 percent purchased it directly (6.8 percent of the Wayne County population was uninsured, bringing the total to 100 percent). Wayne County had the lowest percentage of individuals with employer provided health insurance and direct purchase health insurance but the highest percentage of individuals with public health insurance. Additionally, Wayne County had the highest percentage of individuals without health insurance. This sheds light on the fact that many individuals working in Wayne County have jobs where health insurance is not offered or affordable and may not have the means or access to obtain it through other outlets.

Overall, the data shows that the Affordable Care Act has had an impact on individuals in Southeastern Michigan, with fewer individuals going without health insurance. There is still room for improvement though in ensuring the uninsured gap is filled.

Back to the Basics: Reviewing Southeastern Michigan’s Core Data

Drawing Detroit provides weekly updates on socioeconomic data related to Southeastern Michigan and beyond. By taking publicly available data, presenting it in easy digestible formats such as maps and charts and analyzing that data we are providing a deep understanding of the structure of our region. Understanding how the population of our region changes on an annual basis is vital in shaping public policy, determining long-term infrastructure investment and how a person and community can be successful. For example, population migration data on where people are moving to and from sheds light on where jobs are and where taxpayer dollars will be going. Educational attainment data highlights where greater investment is needed to ensure student success and access to educational opportunities; educational attainment also plays a role in a family’s median income. As we as a society work to improve, knowing and understanding the data that shows what short and long-term paths we are on will only help us in reaching our goals. This is why Drawing Detroit will provide annual updates on select data sets, to show where we as a region sit  

Topics that we will provide updates and dates into annually include: 

Population

Population data is essential for planning purposes. Knowing how many people live in an area, whether the population is on an upward or downward trajectory and what age and sex ratios makeup the population help determine infrastructure, school, housing and other community needs. It also determines representation from the government. 

Race and Ethnicity 

Data on a population’s race and ethnicity guides equal and equitable public policy and access to everyday needs. We know we live in a society where racism exists, access to jobs, educational opportunities, housing and so much more is often made more difficult because of the color of a person’s skin. By knowing where those gaps of inequities are we can work to remedy them, but we must first acknowledge they exist. 

Income and Poverty

Income data is a reflection of an area’s economic well-being, which ties directly to job and job training availabilities, educational attainment and access to housing, food and healthcare. Income data is also directly related to determining poverty levels. 

Education and Educational Attainment

Education and educational attainment data helps create opportunities for students by providing greater insight into what subject matters may need more attention in the curriculum to allow for student success. It also highlights where the gaps and barriers may be for students to reach certain levels of education, which plays a role in the type of careers they may have, what their average income may be and the overall economic well-being of the area they live in. 

Other areas of importance that we will update annually are:

  • Percent of vacant housing stock
  • Gun violence/deaths 
  • Traffic deaths 
  • Deaths caused by major health factors (heart disease, cancer, etc.)
  • State revenue sharing amounts and communities’ tax bases 

All of this data, and much more, is invaluable in understanding where we as a society, a community, a region stand and how we can move forward. The graphs displayed above show where the seven counties in Southeastern Michigan are in relation to these key data points as of 2019, according to Census data. For example, the data shows that Wayne County has the highest percentage of black residents in the region but the lowest levels of educational attainment, the lowest median age and the lowest median income. Wayne County also has the highest percentage of individuals living in poverty. We know all of these factors play into one another, and by keeping track of this data we can work toward better standards of living through education on the subject matter, changes in public policy and programming.

Have other topics you feel should be updated and discussed at least annually? Let us know by emailing drawingdetroit@gmail.com