Reduction of childhood lead poisoning is one of the great successes in Detroit in recent years, a product of strong collaboration by non-profit agencies, funders and the City of Detroit. In this update on lead poisoning we show the progress that has been made, explain the risks and then demonstrate how the cutbacks in funding are putting Detroit’s and the region’s children at risk.
Lead is a heavy metal that accumulates in the body when ingested, and has toxic effects on the nervous system, cognitive development, and blood production. It can be ingested through dust or paint (pica, usually in small children) can also be ingested through drinking water that has been contaminated as a result of lead pipework or lead-based solder. Within dwellings, the main sources of lead come from paint and water pipes, though paint is almost exclusively the source of poisoning in the Detroit area. Outside the home it can also come from soil, especially around older buildings or near thoroughfares where lead is still residual in dust from the era in which lead was used as an anti-knock agent in gasoline. Other sources include flaking external paintwork or former smelters.
The most prevalent effect from lead exposure is reduction in cognitive capacity in children – even with relatively low lead levels in blood, it negatively affects children’s IQ. The most vulnerable age group is children under 3 years old because of potential effects on neurological development, and because young children’s bodies more readily take up lead. Other risk groups include pregnant women and fetuses.
As shown below lead poisoning cases have been declining.
The chart above shows the number of children under age 6 who had a blood lead level greater than or equal to 10 μg/dL from declined tremendously from 1998-2012 . The decline was from 4,846 to 428 children. This occurred as a result of direct intervention by the City of Detroit Department of Health and Wellness Promotion to work with families, by the City Department of Planning and Development to abate lead paint in existing housing, by the Wayne County Prosecutor’s office to charge rental owners who rent lead poisoned property to families with young children and because of the massive numbers of demolitions of lead poisoned properties over the last decade. In addition, many families have taken the opportunity of lower prices on properties to move into better housing, abandoning many of the worst properties in the city.
The second chart shows the number of children under six who had a blood lead level of 5-9 μg/dL, 10-19 μg/dL and greater than 20 μg/dL in 2012. The two higher categories sum to the total of 428 in the previous chart. Recently the Centers for Disease Control has begun counting children in the 5 to 9 ug/dl category as lead poisoned, based upon accumulating research that lead poisoning at these levels has substantial effects in reducing cognitive capacity.
The next several maps show the distribution of lead poisoned children in Detroit.
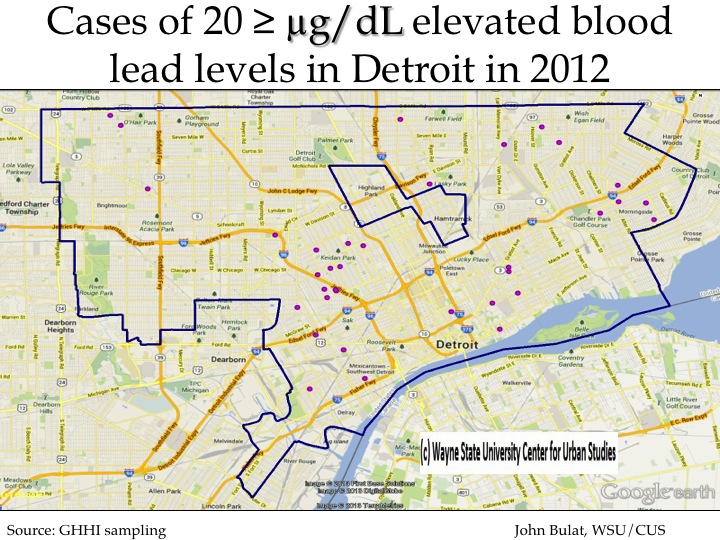
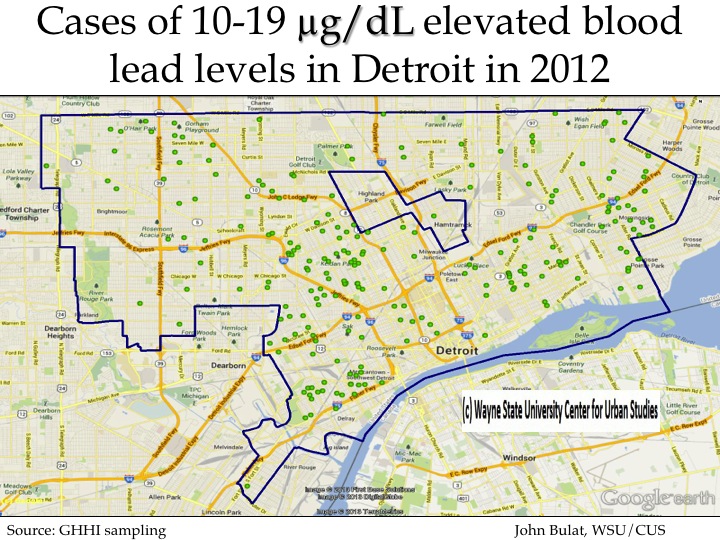
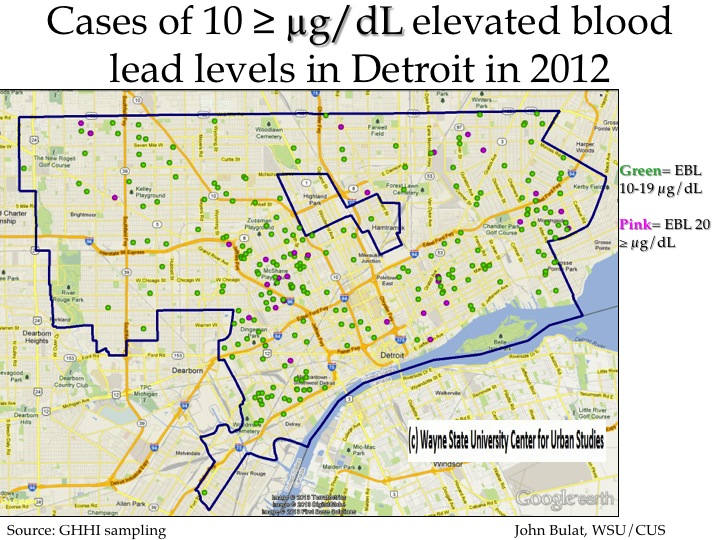
These first three maps show the locations of cases of the higher levels of lead poisonings—those greater than 20 ug/dl first, followed by those greater than 10-19 and 20 ug/dl and finally all those above 10 ug/dl. There is clear concentration of these cases in the areas where older housing still remains in the city, particularly in the closer in areas of the east side, southwest Detroit and the area between the Lodge and I-96.
These first of these two above maps show where the lower levels of lead poisoning exist among Detroit’s children. The ssecond map shows all the lead poisoning cases. While the highest concentrations are similar to the previous maps, the important point is that lead poisoning cases are occurring in every part of the city, consistent with the fact that older housing—homes built before 1978 when lead was banned from house paint—exist all over Detroit.
This is demonstrated by the next two maps.
As can be seen in the first of the two maps above, much younger housing is located in the inner core where housing demolition and replacement has been intense since the 1940s and 1950s. However, the majority of the city is covered in dark brown, which represents Census tracts where between 96 and 100 percent of the homes were built before 1980. In Detroit, 62.2 percent of housing was built before 1950, a substantially higher percentage than any other county in Michigan.
Importantly, the same risks exist in the inner suburbs of Wayne County as demonstrated by the second map above.
One crucial way of intervening early with lead poisoning is by testing of young children. The next three charts speak to this.
The two line charts above show lead testing in Detroit and Wayne County, respectively, over 2012 and 2013 (to date). The data for 2013 are substantially below those for 2012, reflecting drastic cuts in the public provision of testing since the closure of these service by the Detroit Department of Health and Wellness Promotion as part of cuts implement in 2012. We may expect some recovery in testing as children head back to school, but the bar chart above shows that testing in Detroit has consistently declined in volume over the last several years. (The 2013 numbers are just for the year to date.) Part of this decline may be because of a decline in Detroit’s population.
In addition to cuts in testing there have been cuts in case management, elevated blood level investigations, prosecution and abatement.
Given all these cuts in services and interventions, one might reasonably expect an increase in lead poisoning cases among young children. It is likely, however, that because fewer children are tested, fewer of those with lead poisoning will be identified. Social and health problems may appear to diminish if they are not measured properly.


