- Detroit’s unemployment rate experienced a decrease in the month of August, dropping to 17.7 percent; (monthly)
- The overall number of people who work within the Detroit Metropolitan borders (both residents and non-residents of the City of Detroit) continued to increase throughout August; (monthly)
- There was also an increase in employment for the auto and auto part manufacturing industries in the Detroit Metropolitan Statistical Area during the month of August; (monthly)
- The Purchasing Manager’s Index for Southeast Michigan increased from July 2013 to August 2013; (monthly)
- The Commodity Price Index experienced a slight increase from July 2013 to August 2013 for Southeast Michigan; (monthly)
- Standard and Poor’s Case-Shiller Index show that the prices of homes in the Detroit area continue to increase each month; (monthly)
- The number of building permits obtained in Wayne and Oakland Counties increased from July 2013 to August 2013; (monthly).

According to the most recent data provided by the Michigan Department of Technology, Management and Budget, there was a 0.7 percent decrease in the unemployment rate for the State of Michigan, falling from 9.7 percent in July 2013 to 9 percent in August 2013. For the City of Detroit, the unemployment rate also decreased, from 18.9 percent percent in July 2013 to 17.7 percent in August 2013.

In August 2013, there were 288,224 people (both residents and non-residents) employed in the City of Detroit. This was an increase of 3,085 people from the number of people (both residents and non-residents) employed in the City of Detroit in July 2013.

The above chart shows the number of people employed in the auto and auto part manufacturing industries in the Detroit Metropolitan Statistical Area (MSA) increased from August 2012 to August 2013. The number of auto manufacturing employees in the area increased by 5,400 from July 2013 to August 2013.

The Purchasing Manger’s Index (PMI) is a composite index derived from five indicators of economic activity: new orders, production, employment, supplier deliveries, and inventories. A PMI above 50 means the economy is expanding.
According to the most recent data released on Southeast Michigan’s Purchasing Manager’s Index, there was an increase of 7.1 points from July 2013 to August 2013. In August 2013, a PMI of 60.2 was recorded which is reflective of an increase in production activity and new orders.

The Commodity Price Index, which is a weighted average of selected commodity prices, was recorded at 55.6 in August 2013, which was 0.8 higher than the previous month.


The Consumer Price Index measures the change in prices in a fixed market. The index is based on prices of “food, clothing, shelter, fuels, transportation fares, charges for doctors’ and dentists’ services, drugs, and the other goods and services that people buy for day-to-day living,” according to the Bureau of Labor Statistics.
The above graphs show the percent change in the price index measurements. The first graph shows there was a 0.7 percent decrease in the overall Consumer Price Index from June to August 2013 in the Detroit-Ann Arbor-Flint area. According to the Bureau of Labor Statistics, this is mainly based on the fact that energy costs decreased by 8.4 percent over the two month time period.
For the Consumer Price Index Less Food and Energy, there was a 0.3 percent increase in the index from April to June 2013 because of higher prices for apparel, medical care, education and communication.
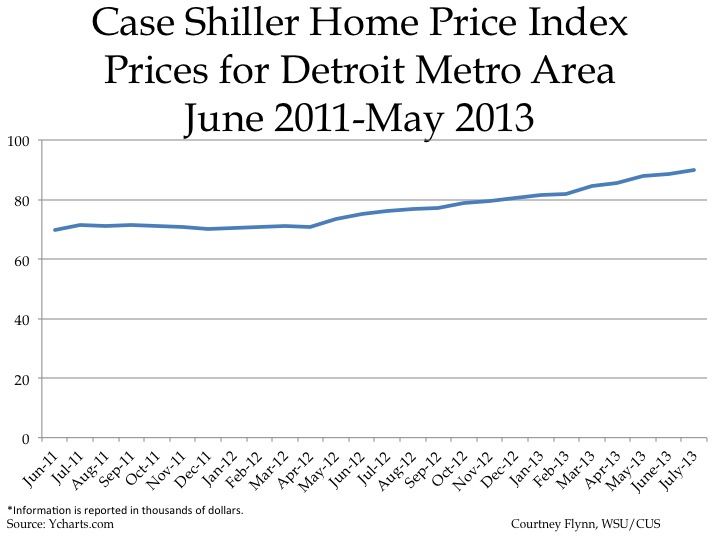

The above charts show the Standard and Poor’s Case Shiller Home Price Index for the Detroit Metropolitan Statistical Area. The index includes the price for homes that have sold but does not include the price of new home construction, condos, or homes that have been remodeled.
According to the index, the average price of single-family dwellings sold in Metro Detroit was $90,080 in August 2013. This was an increase of approximately $13,600 from the average price in August 2012.
Unlike the Home Price Index, the annual percent change in the Home Price Index showed a slight decrease since April. Between July 2012 and July 2013, there was a 16.9 percent increase in home prices for the Detroit MSA.


The above charts show the number of residential building permits obtained each month in Wayne, Oakland, and Macomb counties from January 2012 until August 2013. These numbers are reported by local municipalities to the Southeastern Michigan Council of Governments and include single family, two family, attached condo, and multi-family units.
Of the three counties examined, Macomb County was the only county that did not experience an increase in the number of permits obtained from July to August in 2013; rather, the number of permits decreased by 7. The number obtained in Wayne County increased by 36 from July to August 2013 and the number for Oakland County increased by 67 for the same time period.
When comparing the number of permits obtained in August 2012 versus August 2013 for these three counties, Macomb County was again the only one to show a decrease. The decrease was minimal though. In August 2012, 150 building permits were obtained and in August 2013, 147 were obtained. In Wayne County there was an increase from 81 to 109, respectively. For Oakland County, 158 building permits were obtained in August of 2012 and 254 were obtained a year later.