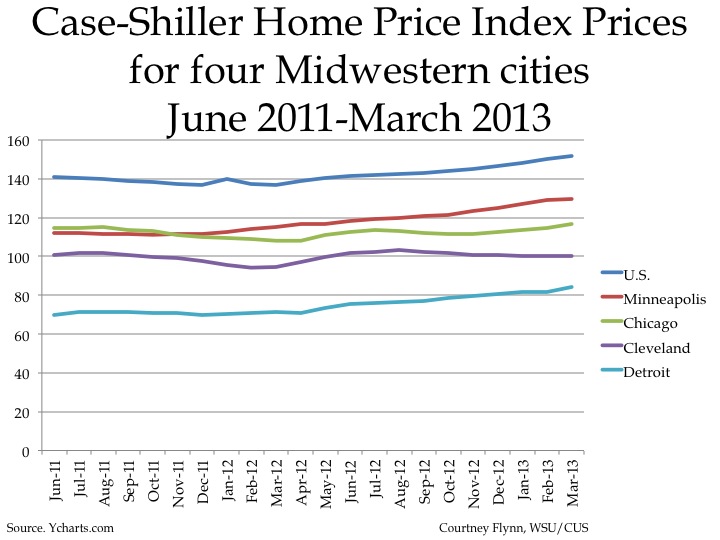
According to Standard and Poor’s Case-Shiller Home Index, the Detroit area has some of the lowest home values in the U.S. However, over the last two years, the Detroit area has also experienced relatively consistent growth in home values. This index is a monthly report that measures the change in prices in a group of homes in 20 of the country’s major metropolitan cities. The index includes homes that have sold but doesn’t include the prices of new construction, condos or homes that have been remodeled.
This post examines the Case-Shiller Home Price Index and the percent of annual change in that index for the following Metropolitan Statistical Areas (MSAs):
In the below charts the index is reported in thousands of dollars.
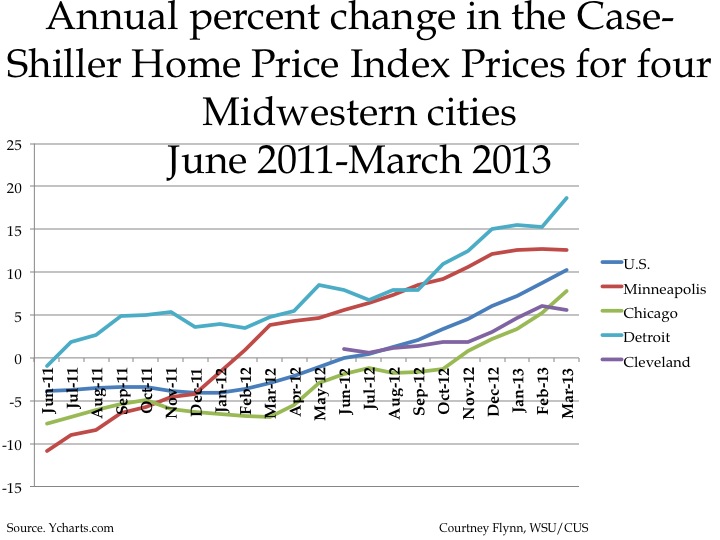
The above chart shows the annual percent change in the Standard and Poor Case- Shiller Index for the U.S. and four Midwestern MSAs. With the exception of September 2012, the Detroit area has consistently had the highest percent change in its home prices. In March 2013, for the Detroit MSA, the percent change in the Case-Shiller Index from the year before was reported at 18.59 points.
Information for Cleveland for percent change in home pricing was only available from June 2012 and forward.
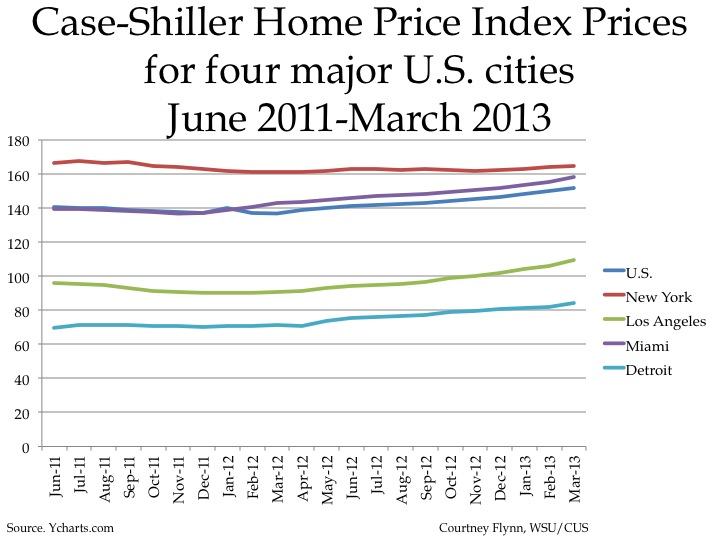
Of the four MSAs examined above, the Los Angeles MSA has the home index price closest to Detroit’s. While Detroit’s ranged from $69,690 to $84,510 over approximately the past two years, L.A.’s ranged from $95,980 to $109,290. The home index prices for the New York area are the highest of the MSAs examined, but they are also the only ones to have lost value compared to June 2011.
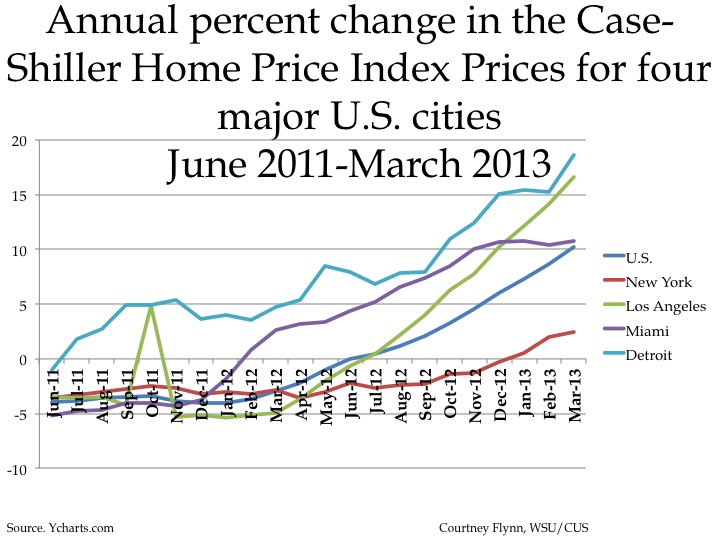
Similar to the Detroit area, the home prices for the Los Angeles MSA have experienced the highest percent of annual change in the time frame examined. In March 2013, L.A. experienced a 16.64 percent change compared to March 2012, while New York only experienced a 2.48 percent change during that same time period.
In coming economic indicator posts, the Case-Shiller Home Index Price for the Detroit area will be examined further.