PLEASE FOLLOW US AT WWW.DRAWINGDETROIT.COM
In the following post, we compare violent crime rates in the City of Detroit with violent crime rates for the State of Michigan as a whole. The categories considered include criminal homicide (used interchangeably with “murder and non-negligent manslaughter” in this post), forcible rape, robbery, and aggravated assault. Unless otherwise noted, all information in the charts was obtained from the Federal Bureau of Investigation’s Uniform Crime Report (detailed information can be found here and here) Each rate is per 100,000 residents.
Overall, with the exception of forcible rape, the City of Detroit’s violent crime rates were higher for each category in 2012 than Michigan’s rates. In addition, from 2011 to 2012, Detroit’s overall violent crime rate slightly decreased while Michigan’s rate increased. This also proved true for the number of homicides in the city from 2012 to 2013, according to the Detroit Police Department.
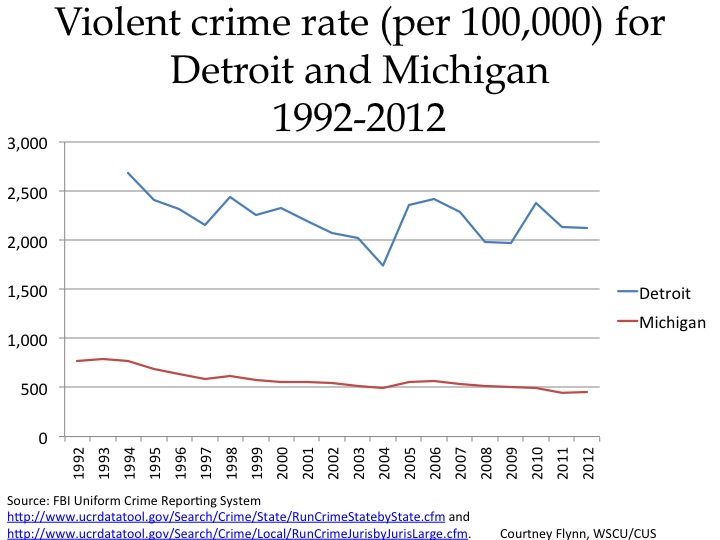
The data provided shows the violent crime rate in Michigan has consistently remained well below the City of Detroit’s rate. For the most part, Michigan’s violent crime rate has been declining since 1994, although there have been a few incidences of increase, most notably from 2011-2012. The state’s violent crime rate was 454.5 in 2012 compared to 445.3 in 2011. These rates are still below the 2010 rate of 490.3.
Detroit’s violent crime rate trend has had more fluctuations than the state’s since 1992. In 2012, the violent crime rate for Detroit was 2,122.9 compared to 2,137 in 2011.
Also, please note no information was provided for Detroit for 1993 because the forcible rape rate is used to calculate the violent crime rate, and in that year the data collection methodology for the offense of forcible rape used by the State Uniform Crime Reporting (UCR) Program did not comply with national UCR Program guidelines. While this rate wasn’t provided by the City of Detroit it was provided for the state by estimating national rates per 100,000 inhabitants within eight population groups and assigning the forcible rape volumes proportionally to the state.
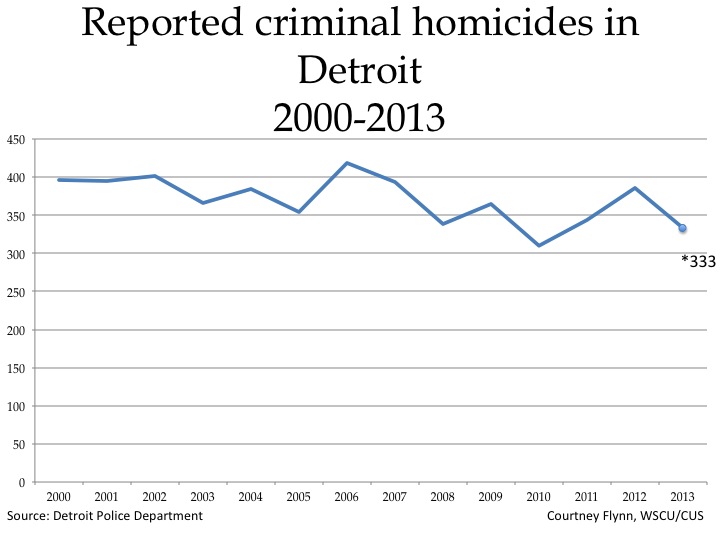
The City of Detroit has touted the decrease of criminal homicides within city limits in 2013. As the chart shows, there has been a decrease, both from 2012 and since 1990. The number of criminal homicide victims in 2013, according to Detroit officials, was 333; in 2102 that number was 386.

According to the FBI, murder and non-negligent manslaughter (a term used interchangeably with “criminal homicide” in this post) is defined as “the willful (non-negligent) killing of one human being by another. The classification of this offense is based solely on police investigation as opposed to the determination of a court, medical examiner, coroner, jury, or other judicial body.”
As with the other crimes examined in this post, the state’s rate remains lower than Detroit’s rate. According to the data, Detroit’s murder and non-negligent manslaughter rate increased from 35.7 in 2008 to 54.6 in 2012 and the state’s increased from 3.7in 2010 to 7.0 in 2012.
When taking the number of reported criminal homicides in Detroit (333) and dividing that number by the Southeast Michigan Council of Governments July 1, 2013 population estimate for the City of Detroit (681,090) and then multiplying it by 100,000, a criminal homicide rate of 48.9 is determine for 2013. This number was not provided by the FBI.

The chart above compares the murder and non-negligent manslaughter rates for Detroit and four of the closest cities to Detroit in the Detroit Metropolitan Statistical Area (this area is defined by the U.S. Census Bureau and is comprised of Lapeer, Livingston, Macomb, Oakland, St. Clair, and Wayne counties). As shown, Detroit’s murder and non-negligent manslaughter rate was 54.6, which was 18 times higher than the city with the next highest murder and non-negligent manslaughter rate (Livonia at 3.1).
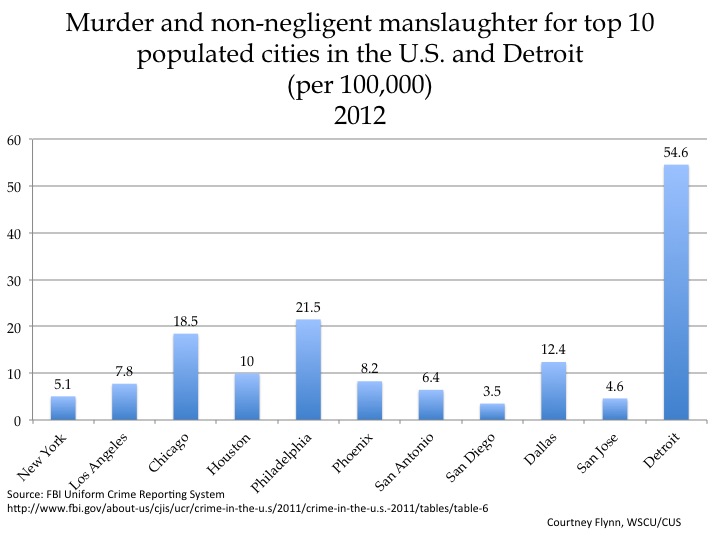
Displayed above are the murder and non-negligent homicide rates for the 10 most populated cities in the U.S. in 2012, along with the City of Detroit (Detroit was not in the top 10). The cities are arranged according to population numbers, highest to lowest from left to right. Among these cities, Detroit had the highest murder and non-negligent manslaughter rate in 2012 (54.6).
Of the U.S.’s top 10 most populated cities, Philadelphia had the highest rate (21.5) and Chicago the second highest (18.5). San Diego (3.5) had the lowest rate.

According to the FBI, forcible rape is defined as “the carnal knowledge of a female forcibly and against her will. Attempts or assaults to commit rape by force or threat of force are also included; however, statutory rape (without force) and other sex offenses are excluded.”
The above chart shows Detroit’s reported forcible rape rate in 2012 (36.2) dropped below the state’s rate (46.4). This was the fourth time Detroit’s rate had been lower than the state’s rate during the years shown (2007-2009 were the other occurrences).
**Data were unavailable for 1993 in Detroit because “data collection methodology for the offense of forcible rape used by the State Uniform Crime Reporting (UCR) Program did not comply with national UCR Program guidelines.”
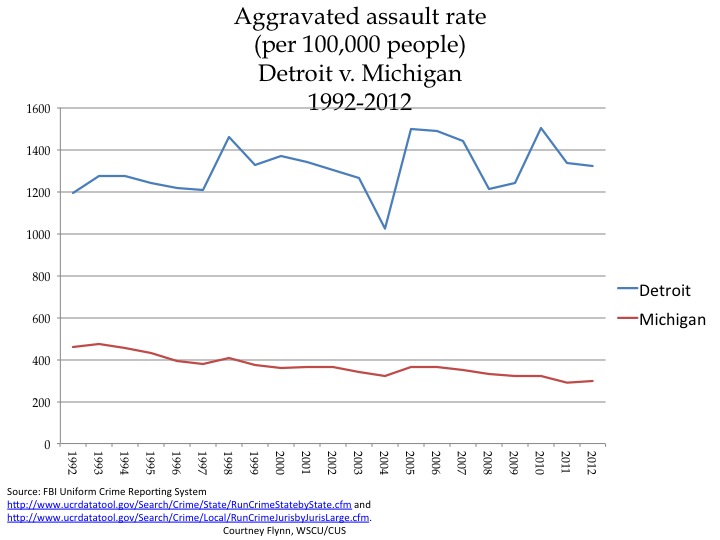
The FBI defines aggravated assault as “an unlawful attack by one person upon another for the purpose of inflicting severe or aggravated bodily injury.”
Overall, the reported aggravated assault rate in Detroit increased from 1,190.8 in 1992 to 1,321 per 100,000 people in 2012. During this time period, there were decreases in the rate, including from 2000 to 2004 and from 2005 to 2008. Michigan’s rate decreased during the time period examined from 458.6in 1992 to 295.5 in 2012.
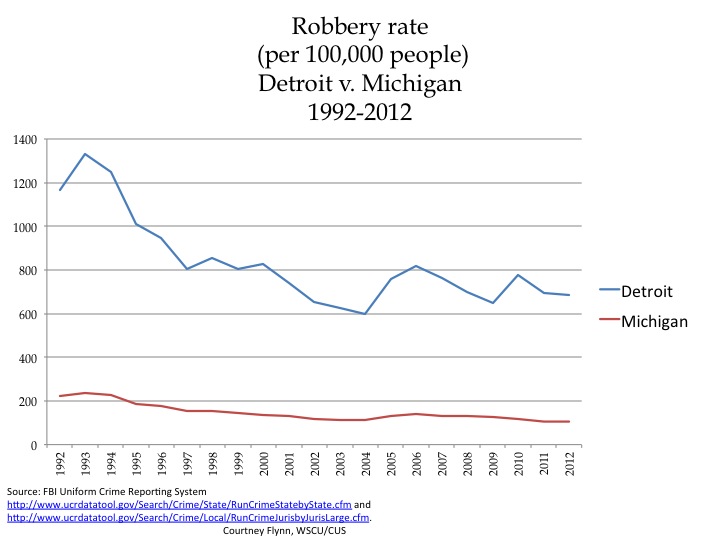
Robbery is defined by the FBI as “the taking or attempting to take anything of value from the care, custody, or control of a person or persons by force or threat of force or violence and/or by putting the victim in fear.”
The robbery rate for the City of Detroit has consistently been much higher than that of the State of Michigan. From 1992 to 2012, both rates have decreased. Detroit’s rate was 1,167.9in 1992 and 648.9 in 2012. Michigan’s rate was 221.5 in 1992 and 105.6 in 2012.
From 2011 to 2012, both Detroit and the State of Michigan did not experience much change in robbery rates. Detroit experienced a decrease of about 11 robberies per 100,000 residents from 2011 to 2012 while the state’s rate remained the same.