In recent weeks information regarding the increase in Michigan’s population and an estimated decrease of migration out of the state have been published in various news outlets. According to information from the Southeastern Michigan Council of Governments, Detroit’s population has also experienced an increase.
In addition:
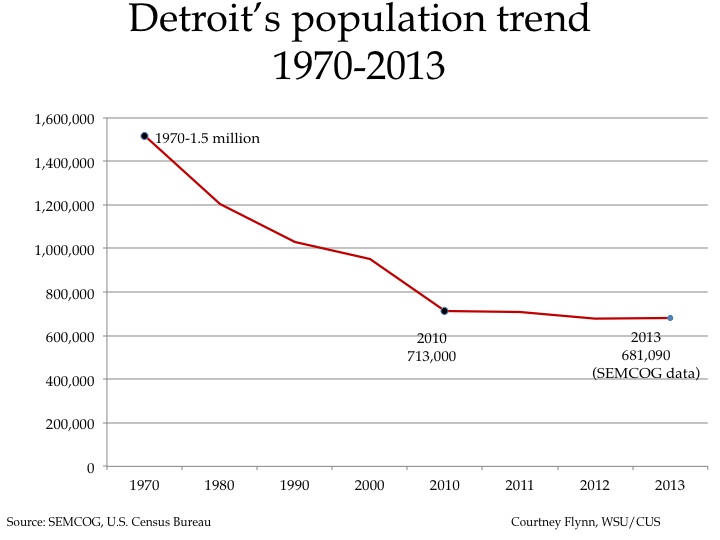
Overall, the City of Detroit’s population has experienced a decline, going from about 1.5 million residents in 1970 to 677,891 in 2012. However, from 2012 to July 1, 2013 the city has experienced a population increase, according to the Southeastern Michigan Council of Government. SEMCOG estimated in 2012 the city had 677,891 residents, and as of July 1, 2013 the SEMCOG estimate was 681,090 residents. The biannual population estimates from SEMCOG are based on trends from area demographics.

According to the most recent data provided by the Michigan Department of Technology, Management and Budget, from October to November of this year the unemployment rate for the State of Michigan has decreased from 9 to 8.8 percent. They estimate the City of Detroit also experienced an unemployment rate decrease. In September the rate was recorded at 16.9 percent and in October it was estimated at 16.2 percent.
Employment numbers for Detroit, and other localities in the State of Michigan, were not available for November because of the government shutdown in October.
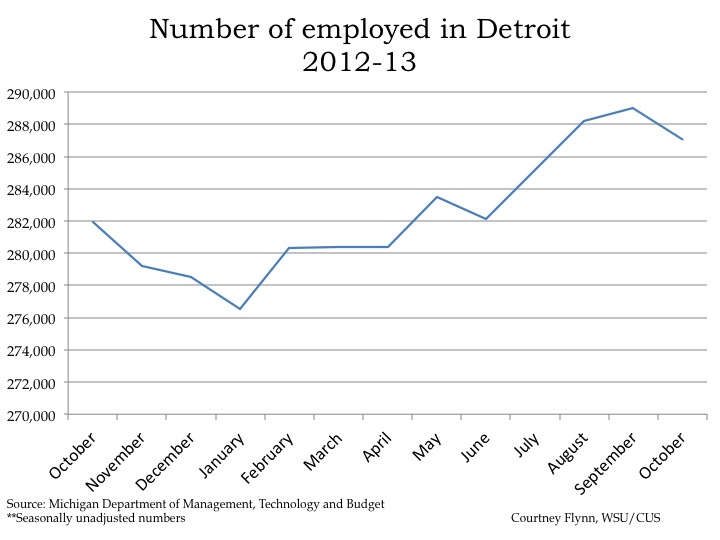
The number of employed in the City of Detroit decreased by 1,928 people from September to October of 2013. In October there were 287,067 people employed.

The above chart shows the number of people employed in auto manufacturing industry in the Detroit Metropolitan Statistical Area throughout 2012 and into 2013. Employment increased in the auto manufacturing and auto parts manufacturing industries from September to October. In September it was reported there were 90,700 people employed in these industries, and in October there were 91,500 employed; this is an increase of 800 employees.
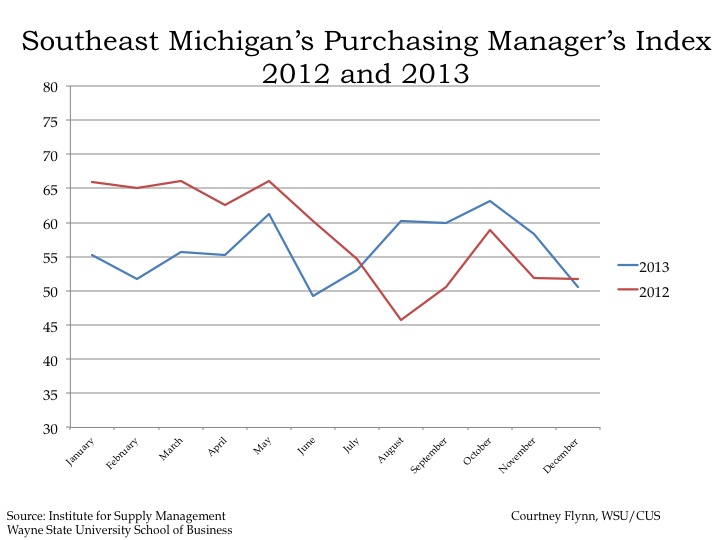
The Purchasing Manger’s Index (PMI) is a composite index derived from five indicators of economic activity: new orders, production, employment, supplier deliveries, and inventories. A PMI above 50 means the economy is expanding.
According to the most recent data released on Southeast Michigan’s Purchasing Manager’s Index, there was a decrease of 7.7 points from November 2013 to December 2013. In December 2013, a PMI of 50.6 was recorded, which is reflective a declining in economic expansion because of a reduction in new orders and production.

The Commodity Price Index, which is a weighted average of selected commodity prices, was recorded at 52.2 in December 2013, which was 2.2 lower than the previous month.


The above charts show the Standard and Poor’s Case Shiller Home Price Index for the Detroit Metropolitan Statistical Area. The index includes the price for homes that have sold but does not include the price of new home construction, condos, or homes that have been remodeled.
According to the index, the average price of single-family dwellings sold in Metro Detroit was $92,140 in October 2013. This was an increase of approximately $13,420 from the average price in October 2012.
The annual percent change in the Home Price Index showed a slight decrease from the increase the region experienced in July. Between August 2012 and August 2013, there was a 16.34 percent increase in home prices for the Detroit MSA.


The above charts show the number of residential building permits obtained each month in Wayne, Oakland, and Macomb counties from January 2012 until November 2013. These numbers are reported by local municipalities to the Southeastern Michigan Council of Governments and include single family, two family, attached condo, and multi-family units.
All three counties experienced a decrease in the number of building permits pulled from October to November, consistent with a seasonal decline in home construction. Oakland County experienced the most dramatic decrease in the number of building permits pulled. In October 324 permits were pulled and in November there were 113; this is a decrease of 211. Wayne County experienced a decrease of 61 permits pulled and Macomb County experienced a decrease of 51.
In addition to Oakland County experiencing the most dramatic decrease, it was the only county that had fewer permits pulled in November 2013 than November 2012.