- Within the last year Wayne County, which is still the largest county in the region, lost the largest number of residents in the nation (annual)
- From December 2014 to January 2015, the unemployment rate across the state and in the City of Detroit’s increased (monthly);
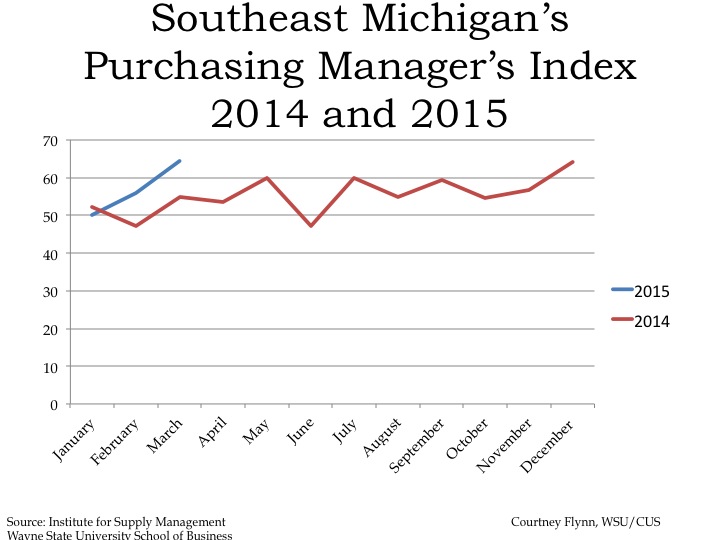
- The Purchasing Manager’s Index for Southeast Michigan increased from February 2015 to March 2015 (monthly);
- Commodity Price Index decreased from February 2015 to March 2015 for Southeast Michigan (monthly);
- Standard and Poor’s Case-Shiller Home Price Index for the Detroit Metropolitan Statistical Area shows home prices have been increasing since September.
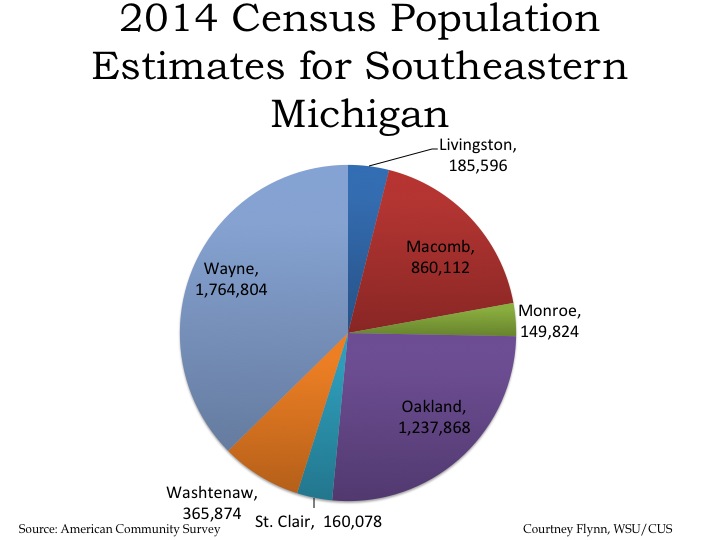
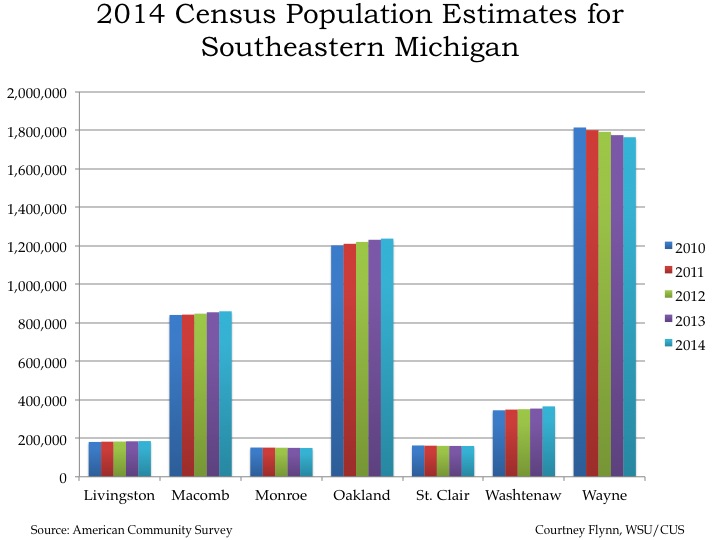
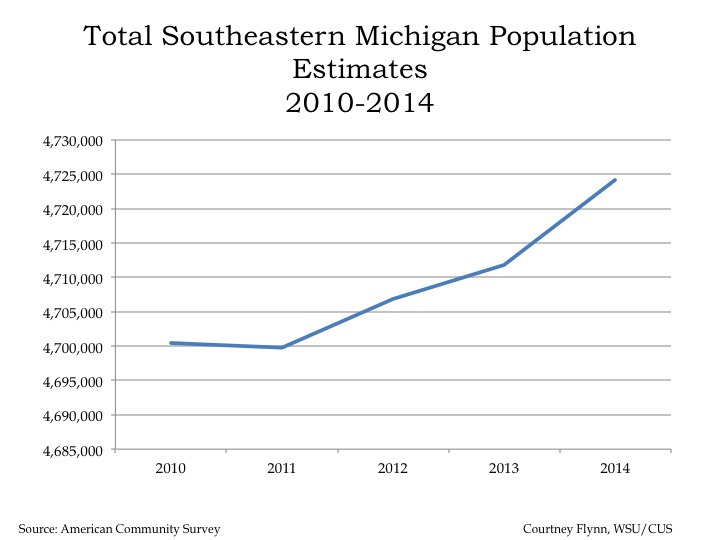
The above three charts show the population estimates for the seven counties that make up Southeastern Michigan. As shown, Wayne County lost about 50,000 residents from 2010 to 2014 while both Oakland and Macomb counties each gained about 20,000 residents. According to WDET, Wayne County had the largest population loss between 2013 and 2014 in the nation; a net deficit of 11,000 residents. On the other hand, Macomb County gained 5,000 residents between 2013 and 2014 and Oakland County gained about 6,000 residents. We do know historically that at least a portion of those leaving Wayne County are from Detroit and are moving elsewhere within the region, to areas such as southern Macomb County.
The overall region experienced a population increase of about 24,000 people between 2010 and 2014, according to Census data. From just 2013 to 2014 the region gained more than half of the four-year increase-about 12,500 residents.
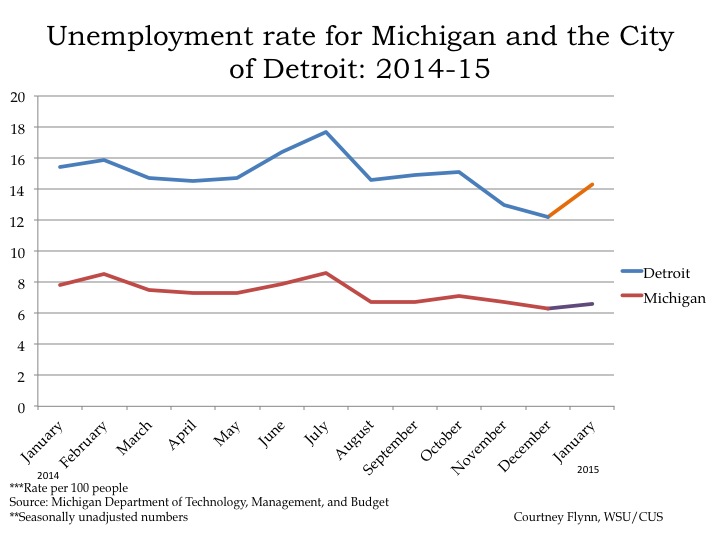
According to the most recent data provided by the Michigan Department of Technology, Management, and Budget, the unemployment rate for the state of Michigan increased from 6.3 percent in December to 6.6 percent in January. During this same period, unemployment in the city of Detroit also increased from 12.2 in December percent to 14.3 percent in January.
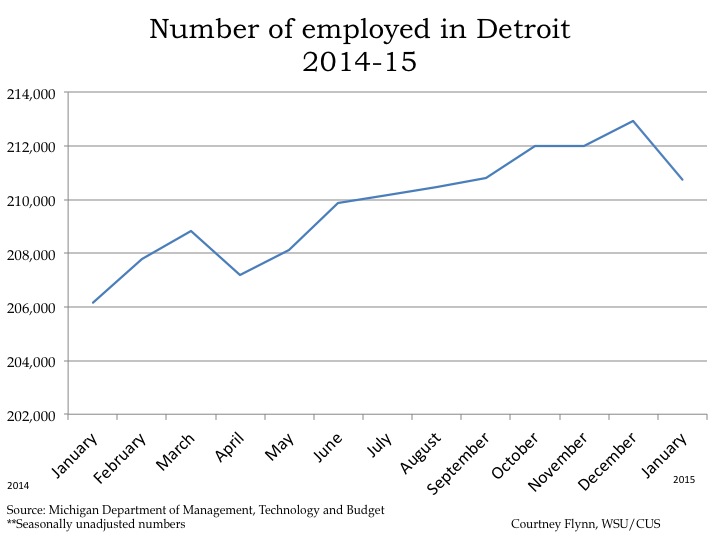
From December of 2014 to January of 2015, the number of people employed in the city of Detroit decreased by 2,178, leading to a total of 210,741 people employed in January.
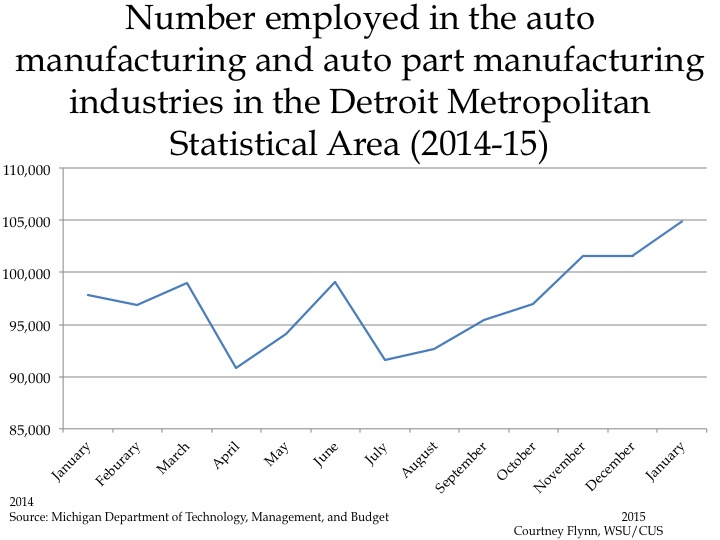
The above chart shows the number of people employed in the auto manufacturing industry in the Detroit Metropolitan Statistical Area (MSA) (Detroit-Warren-Livonia) from January 2014 to January 2015. From July 2014 to January 2015 employment in this industry has increased by 13,300 from 91,600 to 104,900. From just December to January the number of people employed in this industry grew by 3,300.
The Commodity Price Index, which is a weighted average of selected commodity prices, was recorded at 50 points in March 2015, which was 2.5 points lower than the previous month and 11.4 points lower than March 2014.
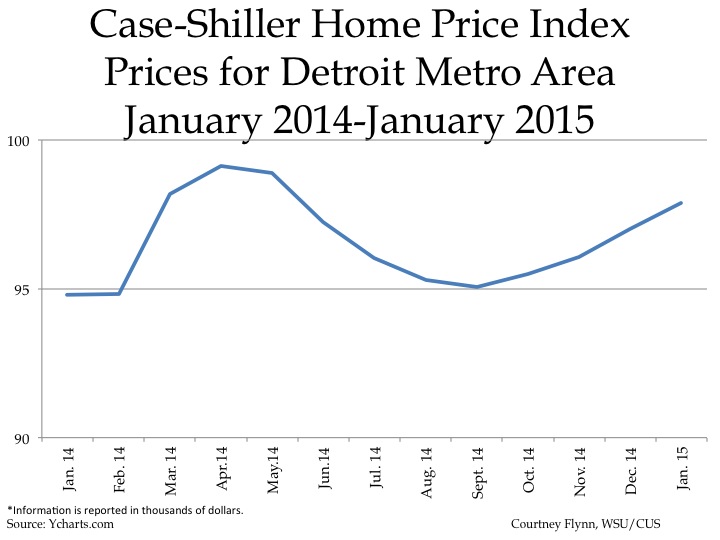
The above charts show the Standard and Poor’s Case-Shiller Home Price Index for the Detroit Metropolitan Statistical Area. The index includes the price for homes that have sold but does not include the price of new home construction, condos, or homes that have been remodeled.
According to the index, the average price of single-family dwellings sold in Metro Detroit was $97,900 in January 2015. This was an increase of approximately $3,100 from the average price in January 2014. Since September, prices have decreased by $2,830.