Food prices are one of the many goods and services increasing along with the rate of inflation. These food price increases are being driven up by the increased cost in oil and transportation, worker shortages and weather patterns that have been negatively impacting crops. These factors combined bring a direct impact on the wallets of all of us. Food and beverages are necessities to live, but as prices continue to rise while wages remain stagnant in many industries, access to these necessities may continue to grow more difficult for many families.
According to the U.S. Department of Agriculture (USDA), the average monthly food bill for a family of four on the department’s “thrifty food plan” was $848.40 in September of 2021. In September of 2020, the average monthly bill on the same plan was $676.70. The thrifty food plan is one of four food plans USDA develops that estimate the cost of a healthy diet across various price points – the thrifty, low-cost, moderate-cost and liberal food plans. The thrifty food plan is the lowest cost of the four. It represents the cost of a nutritious, practical, cost-effective diet prepared at home for a family of four, which is defined in law as an adult male and female, ages 20-50, and two children, ages 6-8 and 9-11.
The “liberal food plan” provides broader suggestions for a healthy diet with more leniency in price too. According to the USDA, an average monthly grocery bill for a family of four on the “liberal plan” was $1,339.80 in September of 2020 and was $1,353.90 in September of 2021. Both examples show how food and beverage prices have certainly gone up over the last year, but comparing the thrifty and liberal average grocery bill also shows that there was a greater increase in price for those adhering to a more thrifty plan, as opposed to a liberal plan.
Examples of how grocery money should be spent, according to the USDA, for each child on each food plan are as follows:
Thrifty food plan:
•1.70 lbs of whole grain breads, rice, pasta, or pastries
•0.07 lbs of whole grain cereals
•No popcorn and other grain snacks
•0.76 lbs of non-whole grain breads, rice, pasta, pastries, cereals, or flours
Liberal food plan
•1.37 lbs of whole grain breads, rice, pasta, or pastries
•0.07 lbs of whole grain cereals
•0.46 lbs of popcorn and other grain snacks
•1.46 lbs of non-whole grain breads, rice, pasta, pastries, cereals, or flours
Those on the thrifty food plan are being encouraged to eat more breads, rice and pasta, likely because of their traditionally lower costs for these sometimes nutrient dense food sources.
These difference in cost increases between the two plans and the type of foods families are encourages to eat further highlights how if a certain food group experiences a large increase from one month to the next meal times for families could drastically change.
The thrifty food plan is used to determine Supplemental Nutritional Assistance Program (SNAP) benefit amounts, which vary by household size. By law, the cost of the thrifty food plan in June sets the maximum SNAP benefit amount for a household of four people for the following fiscal year (October 1 through September 30). While the June thrifty food plan suggestions determine the maximum SNAP benefits for a fiscal year, food prices vary on a month-to-month basis, as do the cost of other goods and services.
The Consumer Price Index (CPI) is a measure which helps show how the costs of goods and services change on a month-to-month and a year-to-year basis. The CPI has been increasing nationally and in the Midwest region for the past year, with goods and services such as housing, transportation and fuel all increasing. As already noted, food and beverage prices have also been increasing in recent months, a noticeable change many of us see at the grocery store and in our wallets.
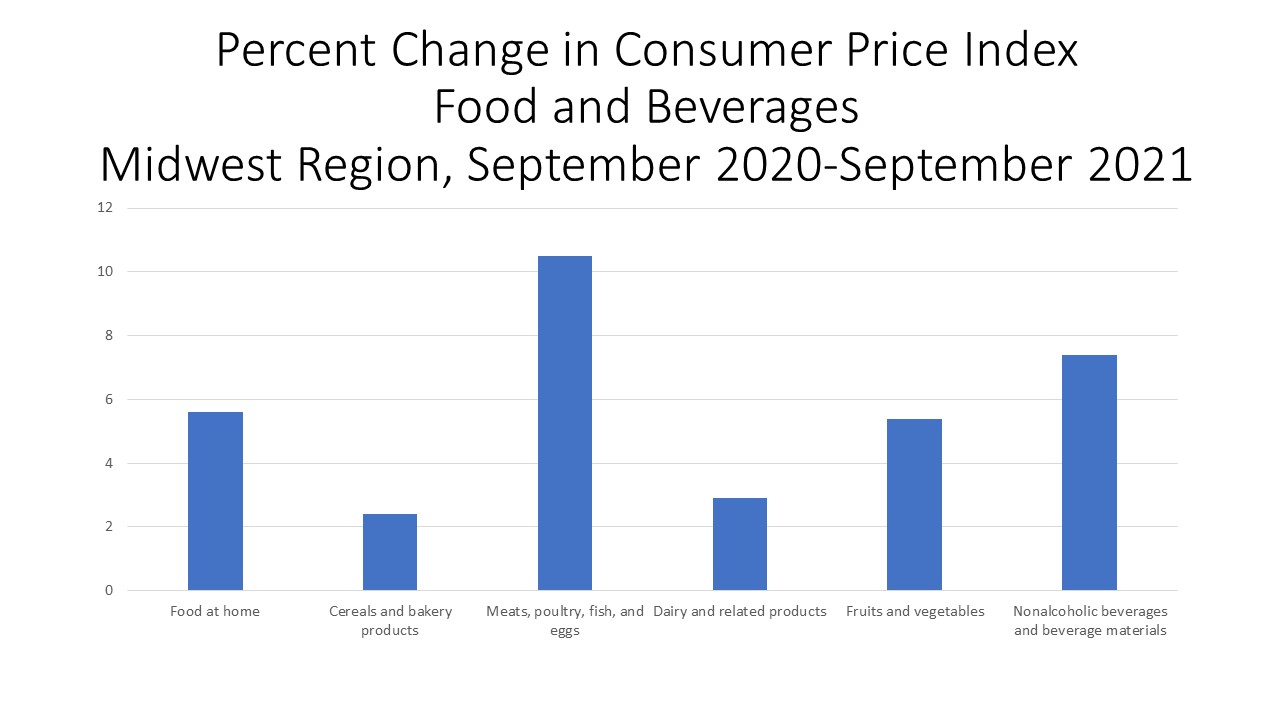
The first chart below shows how food and beverage prices by certain categories changed between September of 2020 and September of 2021, according to the Bureau of Labor Statistics. The highest CPI change in the food and beverage category has been for meat, poultry, fish and eggs. In the last year prices have increased by 10.5 percent. The non-alcoholic beverage category saw the second highest annual increase of the categories shown at 7.4 percent. Cereal and bakery products increased the least at 2.4 percent.
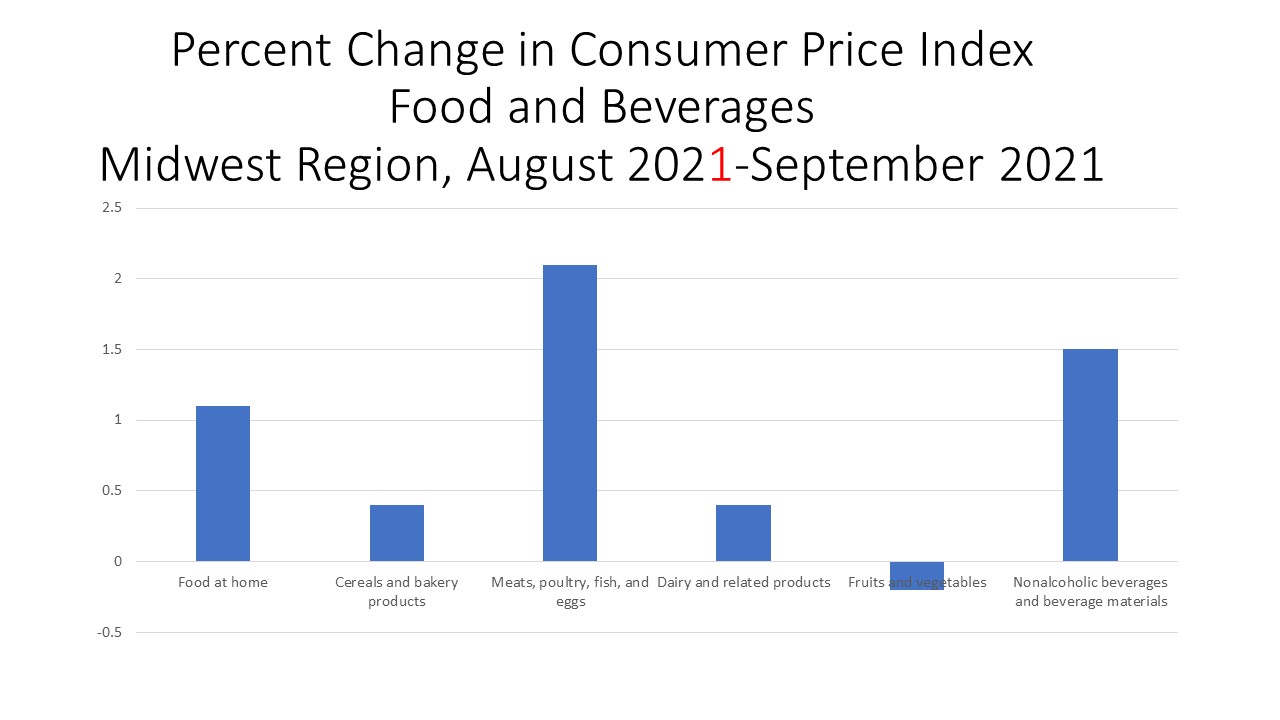
The second chart below shows how food and beverage prices changed between August and September of 2021. Meat, poultry, fish and eggs again had the largest increase at 2.4 percent, followed by non-alcoholic beverages with a 1.4 percent increase. Fruits and vegetable prices, on average, decreased 0.2 percent.
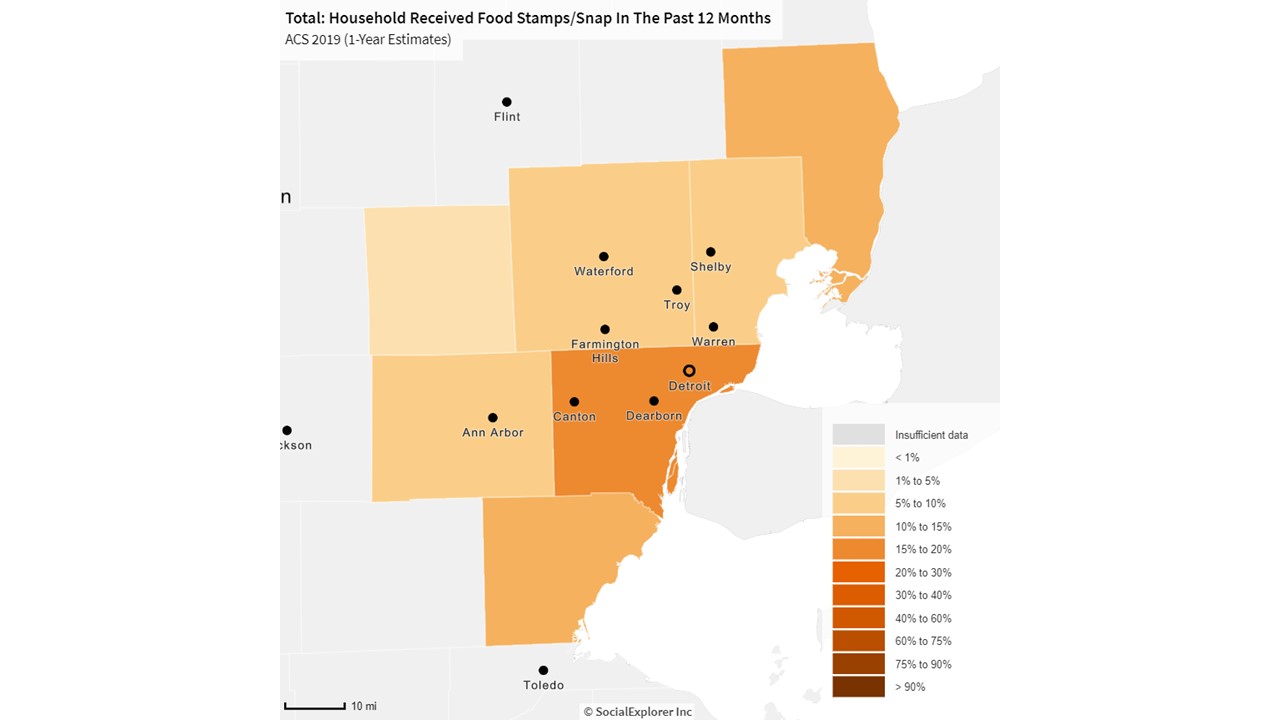
According to the US Census Bureau, in Southeastern Michigan, Wayne County had the highest percentage of households utilizing SNAP benefits at about 14 percent, followed by 12 percent of St. Clair County households utilizing the benefits and 11 percent of Monroe County households.
Increasing food and beverage prices is just one of many factors that could drive up the percentage of people in poverty, and drive those in poverty even deeper into it. As noted, increasing food prices are related to increasing costs of transportation (gas), worker shortages and supply and demand. Increasing prices for gas will impact more than just food and beverages too, meaning this is just another area in which the dollar won’t stretch for many Americans. With wages not keeping up with the price of inflation (Michigan’s minimum wage has remained at $9.65 for 2021) or not growing closer to being a “living wage”, many may have to chose between meals, gas and heat and electricity in the coming months.