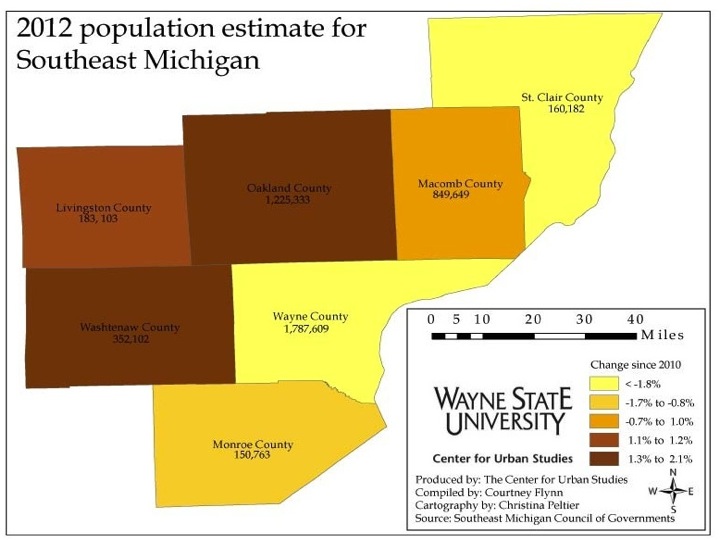
Over the next two posts, we will examine the percent change in population from 2010 to 2012 for Southeastern Michigan. This week we present the municipalities that make up Wayne, Oakland and Macomb counties. Next week we will consider the same information for Washtenaw, Livingston, St. Clair and Monroe counties.
The data used for these maps comes from two sources, the U.S. Census for the 2010 figures and the Southeast Michigan Council of Governments for the 2012 estimates. We use the SEMCOG estimates for 2012 because they are the most recent available. Census estimates based on the American Community Survey (ACS) are only available for 2011. We will be revisiting this post once the ACS numbers are available for 2012. Also we will present a comparison of the SEMCOG and ACS numbers, accessing patterns of variation between the two.
The individual county maps are presented from largest to smallest overall population.
During this period, Oakland and Washtenaw counties experienced the highest percentage increase in population while Wayne County had the largest population decline.
Of all the municipalities in the tri-county region, Highland Park experienced the largest percentage loss in population (-8.6%) from 2010 to 2012, which was about 1,000 people. However, Detroit, which has a much higher population than its neighbor, lost about 32,000 people, but had a lower percent of population loss. Such population losses contributed to Wayne County have the largest percent of population loss of the tri-county and seven-county regions.
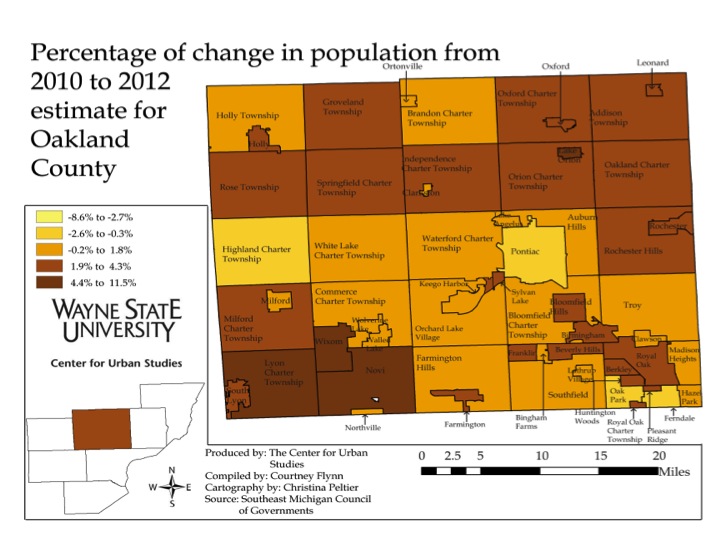
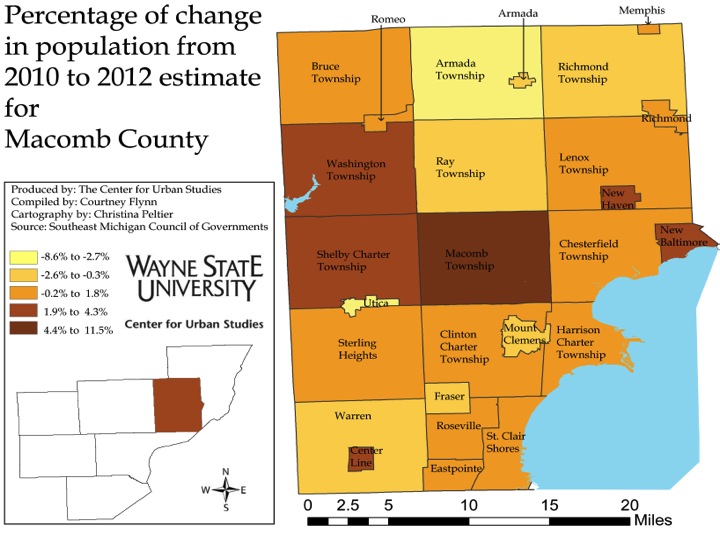
The ranges of percent change vary in each map but the color-coding remains the same. The lightest shade of yellow represents the communities with highest percent of population loss while the darkest shade of brown represents the largest percent increase.
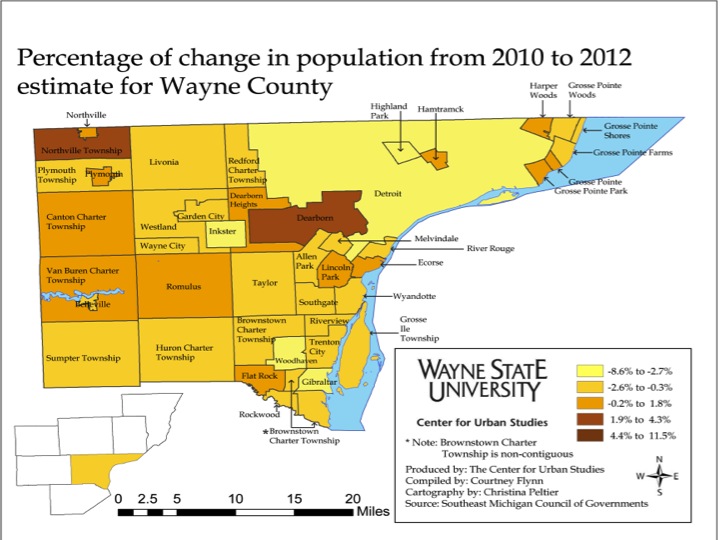
According to the information provided by SEMCOG, Highland Park in Wayne County experienced the largest percent in population decline from 2010 to December of 2012 at 8.6 percent. Its population dropped from 11,776 in 2010 to 10,762 in 2012. Detroit, which has long been in the public eye for its loss of population, experienced a 4.1 percent population decline: in 2010 the population was recorded at 713,862 , and in 2012 it was estimated at 684,799.
In Wayne County, Northville Township had the highest percentage population increase at 3.2 percent, based on a 926 resident increase.
In the tri-county area, Macomb County had the most municipalities with a population increase over 3 percent. In Macomb County, Macomb Township experienced the highest percent of population growth at 5.2 percent; this represents a 4,114 person increase from 79,580.
It was Lyon Township in Oakland County that had the highest overall percent increase in population change out of the three counties at 11.4 percent. The township’s population increased from 14,545 to 16,212, or 1,667 residents. Below the municipalities represented in the highest and lowest percent change categories in the maps are shown.
•Municipality with highest overall growth in numbers: Macomb Township
**The number of municipalities listed in each category vary because they come from the highest percent of increase and decrease category in each map.