Statewide, across genders and across racial groups, the rate of alcohol-induced deaths is increasing, according to the Michigan Department of Health and Human Services. This trend is also true for majority of the counties in Southeast Michigan, with the exception of two. Why alcohol-induced deaths are increasing remains unknown, but the data does show that Michigan men had higher rates of alcohol-induced death than women, and White Michiganders have had higher alcohol-induced death rates over the last decade, as compared to their Black counterparts.
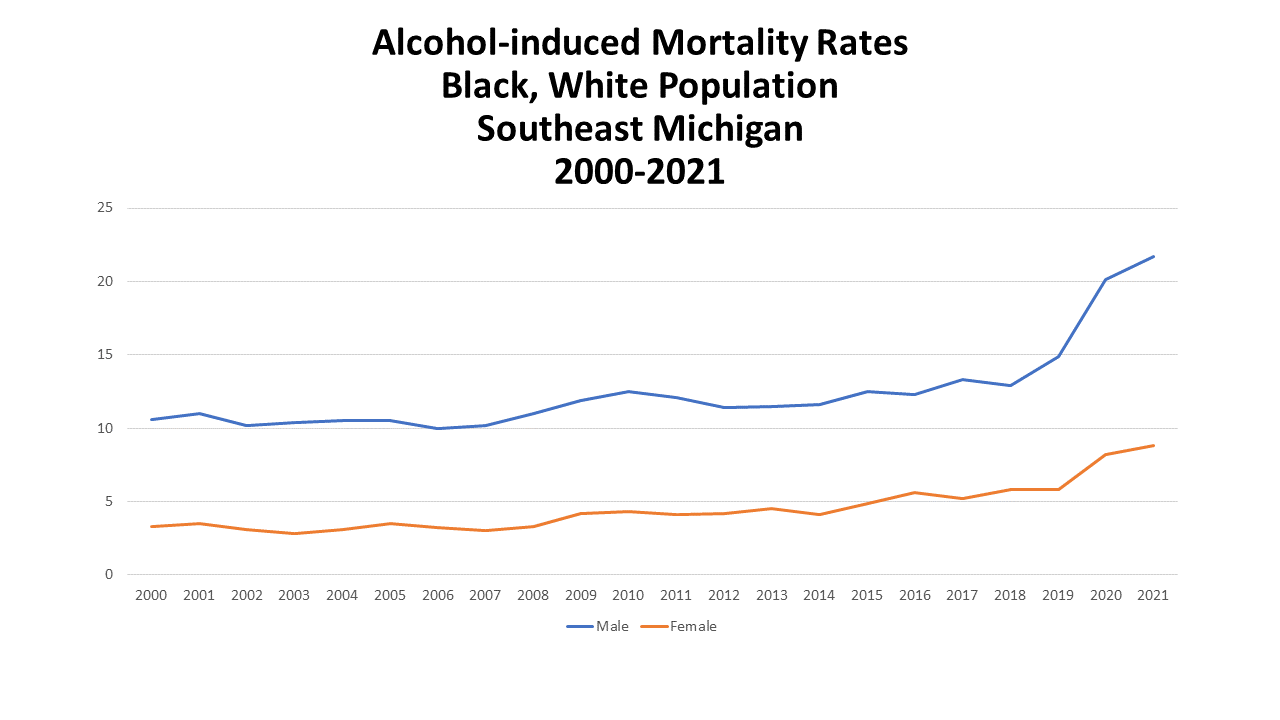
Digging further into the data, we know that the rate of alcohol-induced deaths for men in Michigan in 2000 was 10.6 deaths per 100,000 people; by 2021 that increased to 21.7 deaths per 100,000 people. The largest increase for male alcohol-induced deaths took place between 2018 and 2021. Nationally, the New York Times sites a sharp increase in alcohol-related deaths for women. However, as data from the Michigan Department of Health and Human Service shows, while the trend has been steadily increasing since 2000 (rates increased from 3.3 per 100,000 people to 8.8 per 100,000 people), the males in Michigan have experienced the sharpest increase.
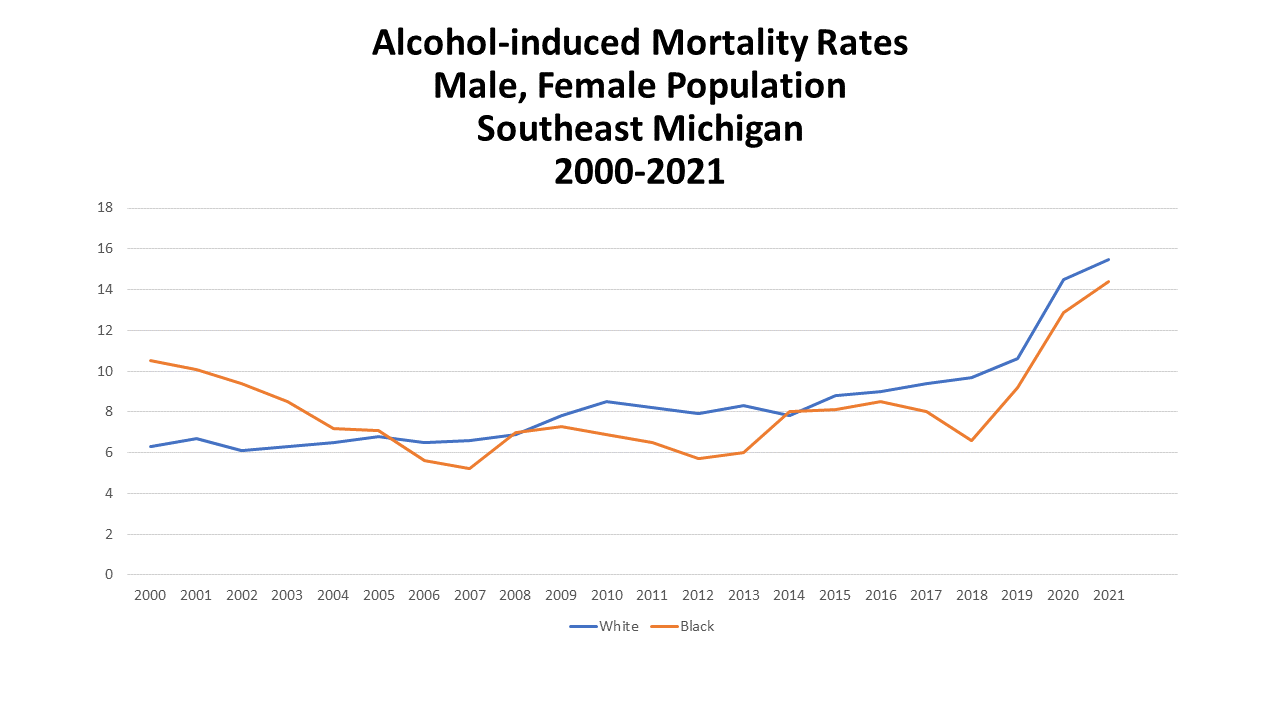
The trends amongst the White and Black populations in Michigan is not as straightforward. As noted, the White population in Michigan had the highest alcohol-induced death rate in 2021 at 15.5 deaths per 100,000 people. Since 2000 the alcohol-induced death rate amongst the White population in Michigan steadily increased from 6.3 alcohol-induced deaths per 100,000 people to 15.5. The alcohol-induced death for the Black population has not been as linear. Between 2000 and 2007 the alcohol-induced death rate decreased from 10.5 alcohol-induced deaths per 100,000 to 5.2. Then, between 2007 and 2018, there were both increases and decreases in the alcohol-induced death rates for the Black population, with the 2018 rate being reported at 6.6. Since 2018, the alcohol-induced death rate for the Black population increased from 6.6 to 14.4 in 2021.
Up until 2010, according to the data, Black males had the highest alcohol-induced death rate among Black males and females and White males and females. But, beginning in 2010 and through 2021, White men had the highest rate at 22.2 per 100,000 people in 2021. When examining the female population, it was often a trade-off from year-to-year whether it was the Black or White female population with the highest alcohol-induced death rate. In 2021, Black women had the highest rate at 9.4 deaths per 100,000 people.
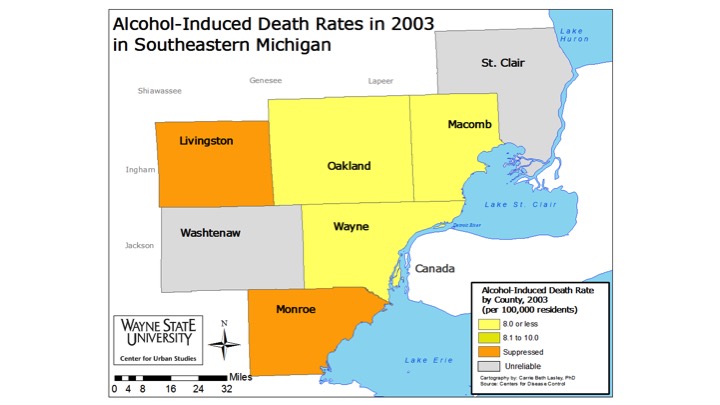
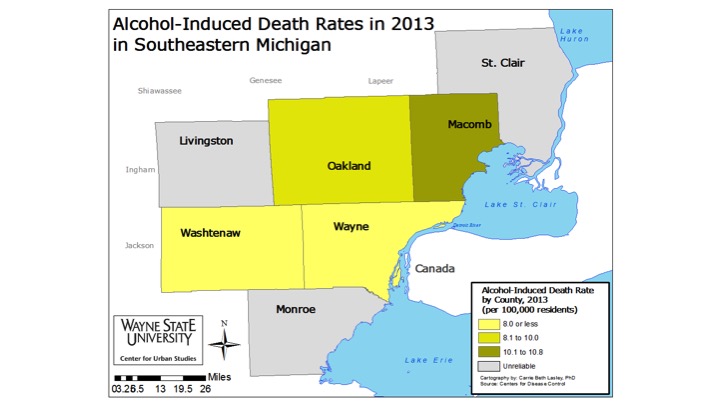
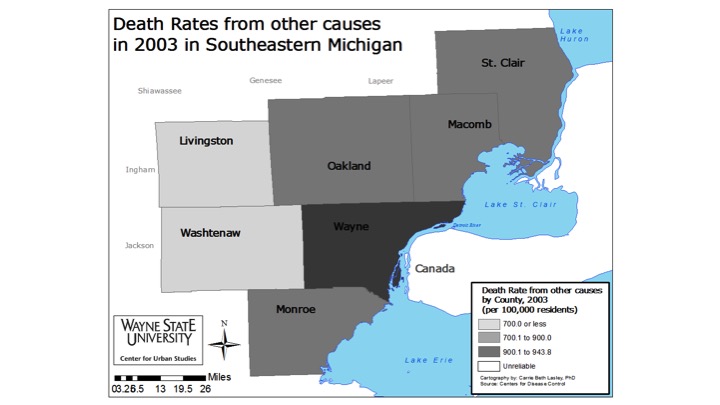
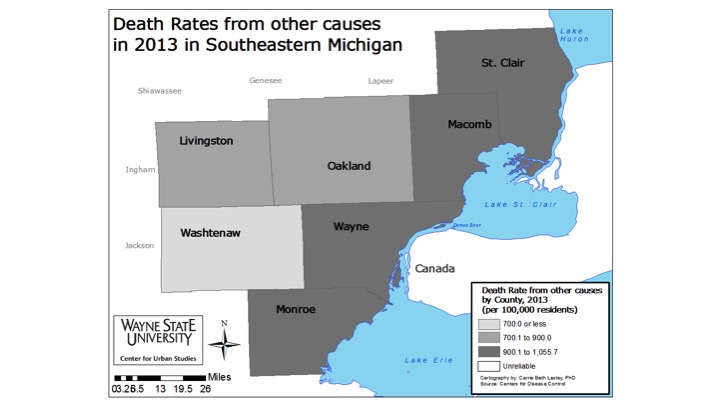
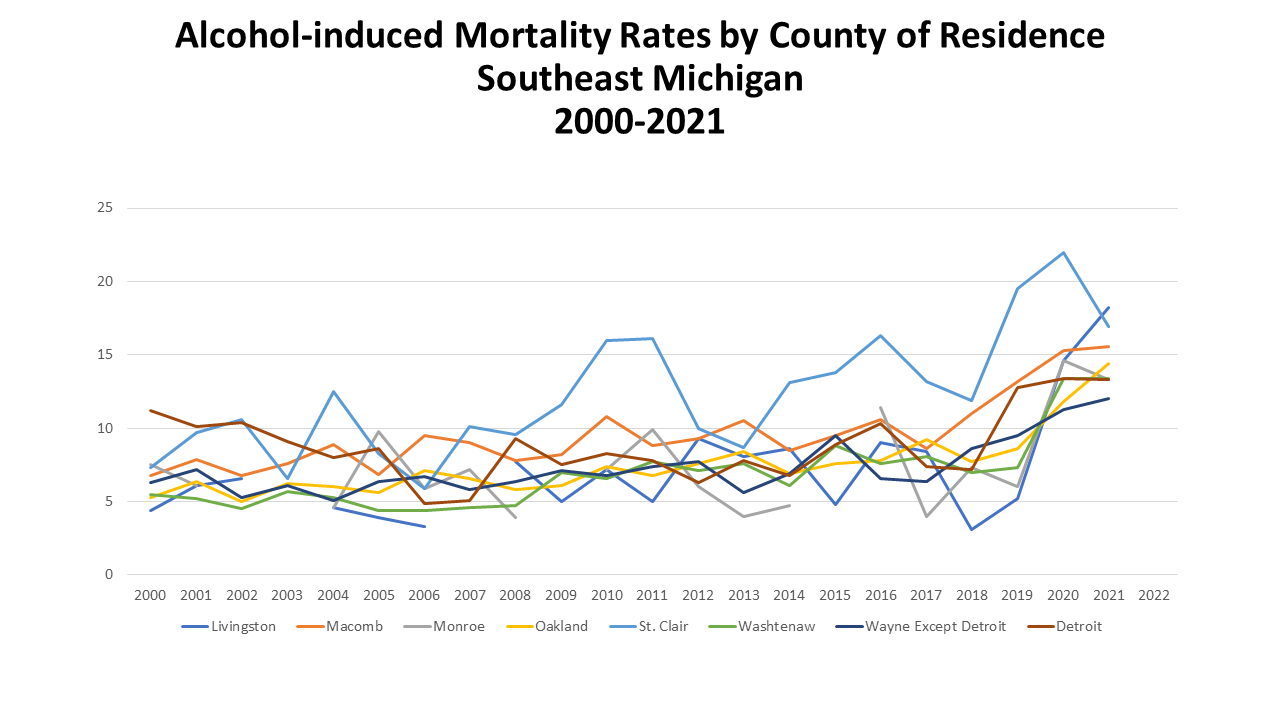
When digging into the more local data, it is St. Clair County that regularly had the highest alcohol-induced death rate since at least 2007, despite Livingston County having the highest local rate in 2021. In 2021, the alcohol-induced death rate for Livingston County was 18.2 alcohol-induced deaths per 100,000 people. In 2018, Livingston County had an alcohol-induced death rate of 3.3 and by 2021 it had spiked to 18.2.
St. Clair County had the second-highest rate at 16.9. Wayne County, with Detroit data removed, had the lowest alcohol-induced death rate at 12; Detroit’s alcohol-induced death rate in 2021 was 13.3.
Despite St. Clair County regularly having the highest alcohol-induced death rate over the last decade, there was a decrease between 2020 and 2021. Monroe County also experienced a decrease in the alcohol-induced death rate between 2020 and 2021.
Overall, the trend of alcohol induced death rates increasing is evident. Exact reasons for it remain unknown, but publications touch on mental health, the pandemic and genetics as reasons. While trying to better understand the “why,” policies can also be put in place to help curb increasing rates. Some policy recommendations from the American Public Health Association include increasing alcohol taxes at the federal, state and local levels, limiting the number of stores that can sell alcohol in a community (and limiting clustering of such stores), lowering the Blood Alcohol Content level for drunk driving, increasing public awareness campaigns (similar to what has been done in the tobacco industry). Strategies need to simultaneously occur at the individual-community-population level to ensure a holistic approach that is long-term and impactful.