- The unemployment rate across the state has remained stagnant while the rate in the city of Detroit has inched upward(monthly);
- The number of employed Detroit residents increased, as did the City’s labor force (monthly);
- The business vacancy rate in Detroit has experienced an overall increase since 2012;
- The Purchasing Manager’s Index for Southeastern Michigan increased from May to June 2016 (monthly);
- Commodity Price Index decreased for Southeastern Michigan (monthly);
- Standard and Poor’s Case-Shiller Home Price Index for the Detroit Metropolitan Statistical Area shows home prices continue to gradually increase on a month-to-month basis and experience larger growth when compared on an annual basis.
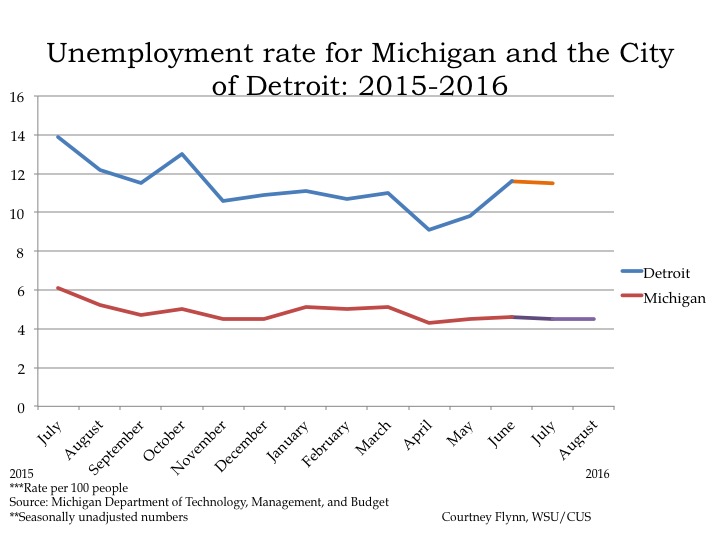
According to the most recent data provided by the Michigan Department of Technology, Management and Budget, the unemployment rate for the State of Michigan remained steady at 4.5 percent through August 2016. During this same period, unemployment in the City of Detroit increased to 11.5 after hitting an annual low of 9.1 in April.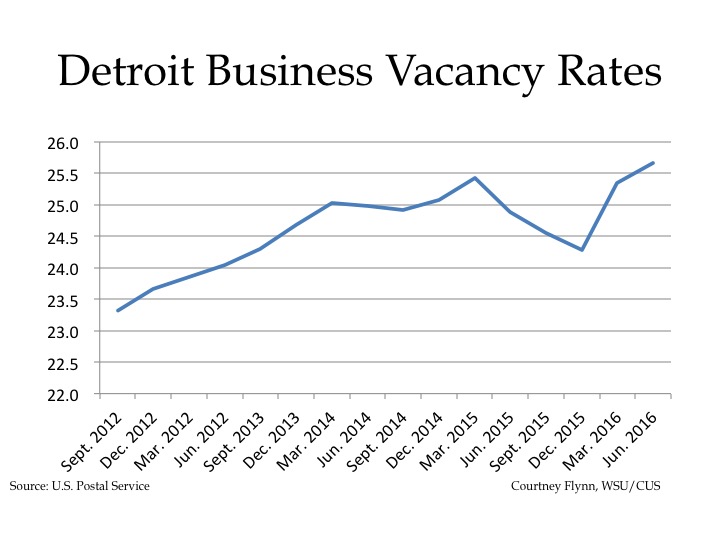
According to quarterly data provided the U.S. Postal Service, the June 2016 business vacancy rate in the City of Detroit was 25.7 percent, which was equivalent to 7,608 vacant businesses out of 29,648 total businesses. Of the data provided, the lowest business vacancy rate in the City of Detroit was in September of 2012. That rate was 23.3; there were 6,925 vacant addresses of the 29,696 addresses.
The business vacancy rate in the City has steadily grown over the last four years, except between March-December 2015 when it declined. In December of 2015 the rate dropped to a low of 24.3.
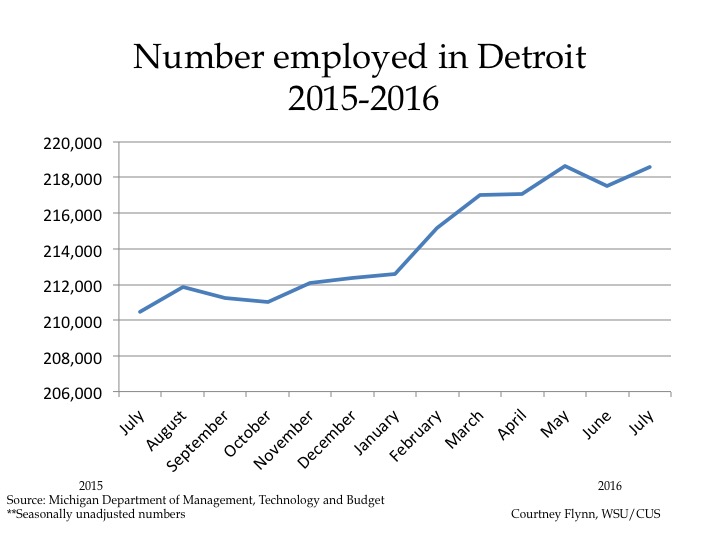
In July of 2016 the number of employed Detroit residents rose to 218,587, an increase of 1,054 from June. Between July of 2016 and July of 2015 there was a total increase of 8,117 employed Detroit residents, according to the Michigan Department of Technology, Management and Budget.
Along with the the number of employed Detroit residents increasing over the last year, so has the labor force. Between July of 2016 and July and 2015 the labor force increased by 37,556 to a total of 249,815.
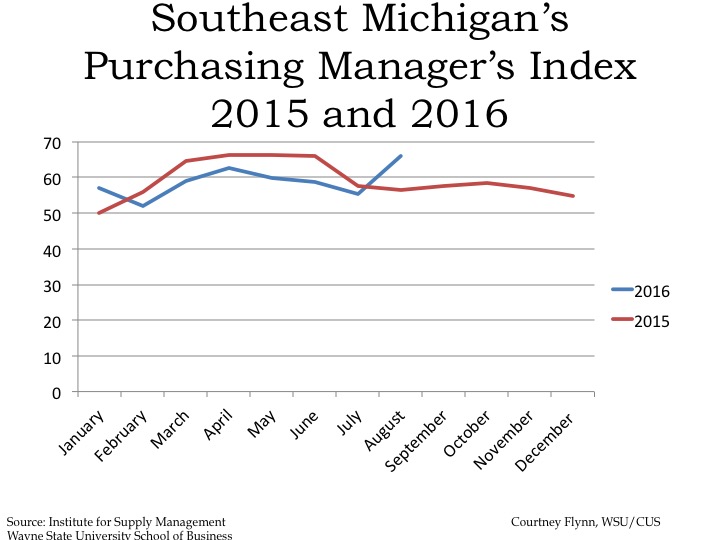
The Purchasing Manger’s Index (PMI) is a composite index derived from five indicators of economic activity: new orders, production, employment, supplier deliveries, and inventories. A PMI above 50 indicates the economy is expanding.
According to the most recent data released on Southeast Michigan’s Manager’s Index, the PMI for August 2016 was 66, an increase of 8.5 points from the prior month. The August 2016 PMI was an increase of 9.4 from the previous year. With this increase, the PMI for August is considered strong, especially due to the increase in new orders.
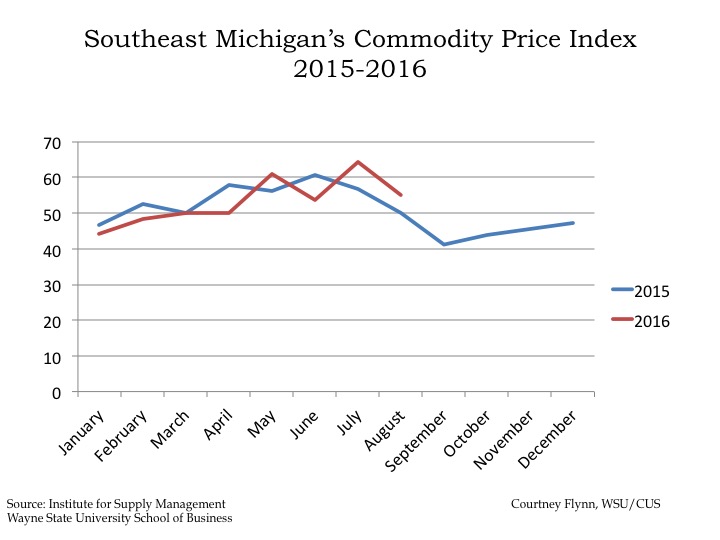
The August 2016 Commodity Price Index decreased 9.3 points from July but increased 5 points from the prior year. The July 2016 Commodity Price Index reached an annual high due to pricing pressures and stronger demands at that time. The August decrease represents decreased pressure and demand.
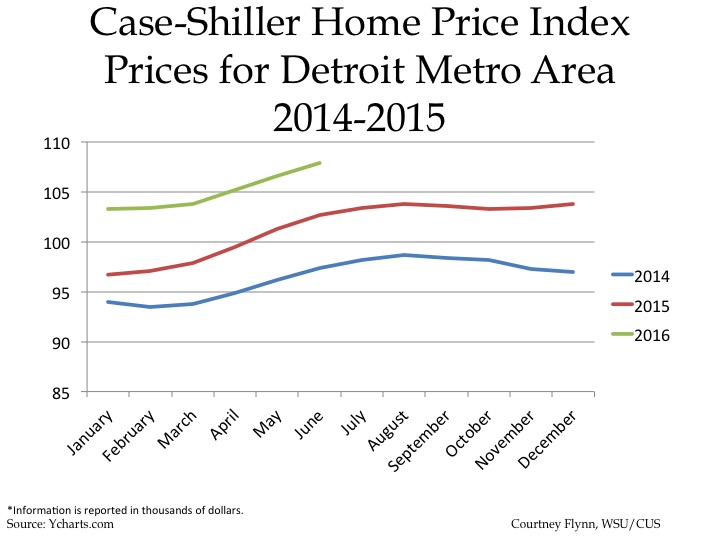
The above charts show the Standard and Poor’s Case-Shiller Home Price Index for the Detroit Metropolitan Statistical Area. The index includes the price for homes that have sold but does not include the price of new home construction, condos, or homes that have been remodeled.
According to the index, the average price of single-family dwellings sold in Metro Detroit was $107,900 in June 2016. This was an increase from $102,710 from June of 2015 and an increase from $97,340 from June of 2014.