Michigan and Detroit post weak performance on the National Assessment of Education Progress (NAEP)

The National Assessment of Education Progress (NAEP) is a test fourth and eighth grade students take on a frequent basis to represent the knowledge of this nation’s students. Assessments are conducted in various subjects, including math and reading. Students have consistently tested in these two subjects since 1990. The results from these assessments are to serve as a common metric for all states and urban trial districts. There are few changes in the assessments on a year-to-year basis, and if there are changes they are documented.

The Commissioner of Education Statistics, who heads the National Center for Education Statistics in the U.S. Department of Education, is responsible by law for carrying out the NAEP project.

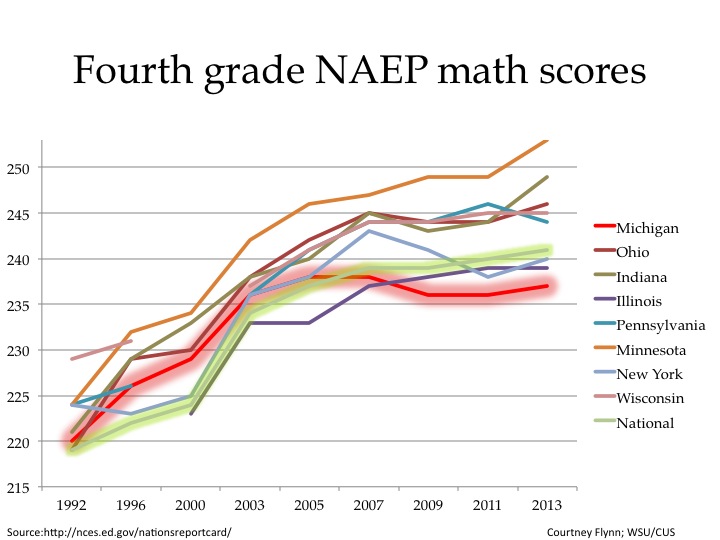
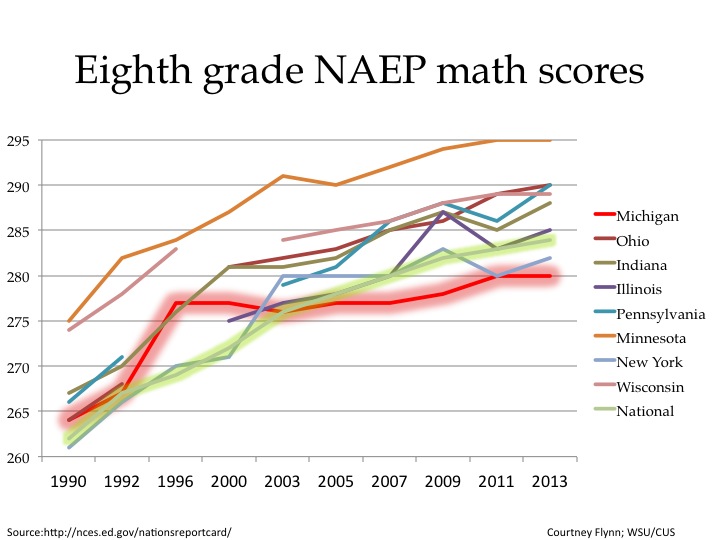
According to the NAEP, the State of Minnesota has remained above the national average and the scores of the Great Lakes states since the math portion of this benchmark test was introduced in 1992. From 1992 to 2013 Minnesota students in fourth and eighth grade have shown improvements in their NAEP math scores. For the State of Michigan though, there has not been such vast improvements. Yes, from 1992 to 2013 there has been an overall increase in fourth and eighth grade math test scores. However,  since 2007 fourth-graders have performed below the national level on the NAEP math test; eighth-graders have performed below that level since 2005. From 2011 to 2013 there was a slight upswing in the fourth-graders’ test scores (236 to 237) but Michigan had the lowest score in the Great Lakes region. This was true for the eighth grade NAEP math test scores as well in 2013. However, from 2011 to 2013 there was not an increase; both years the scores remained at 280.

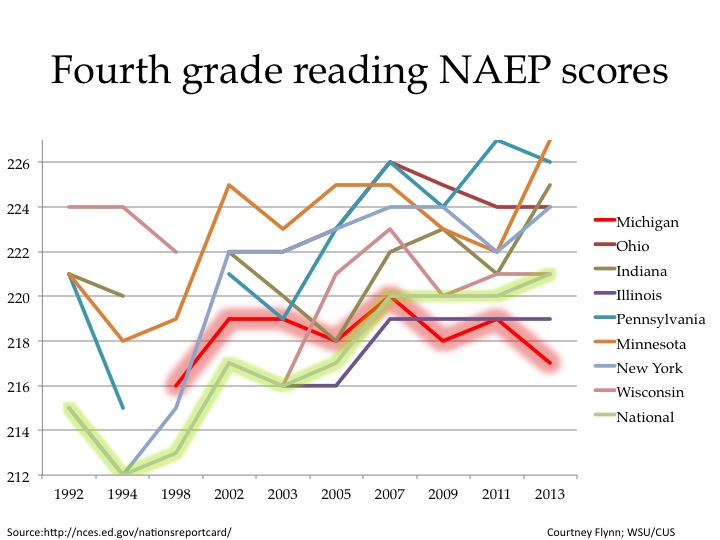
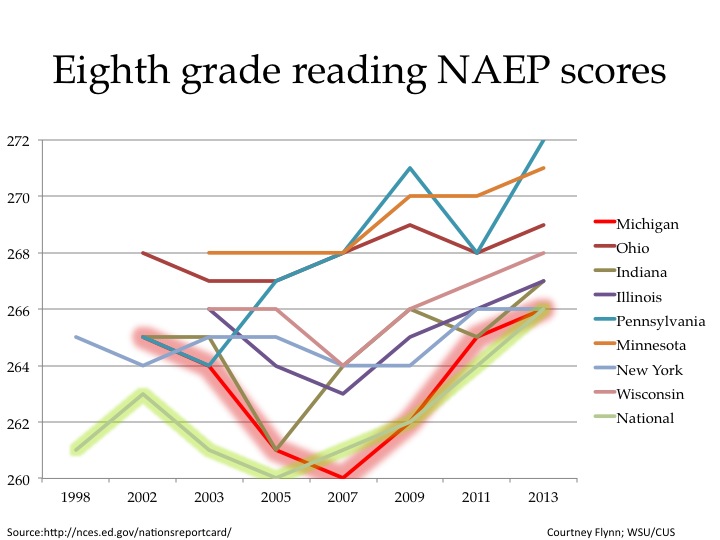
For the NAEP reading scores, Michigan has performed below the national level since 2007 at the fourth grade level. At the eighth grade level though the state has only performed at or below the national level in 2007 and 2013. In 2013, the eighth grade reading scores increased from 265 in 2011 to 266; the national score was 266.

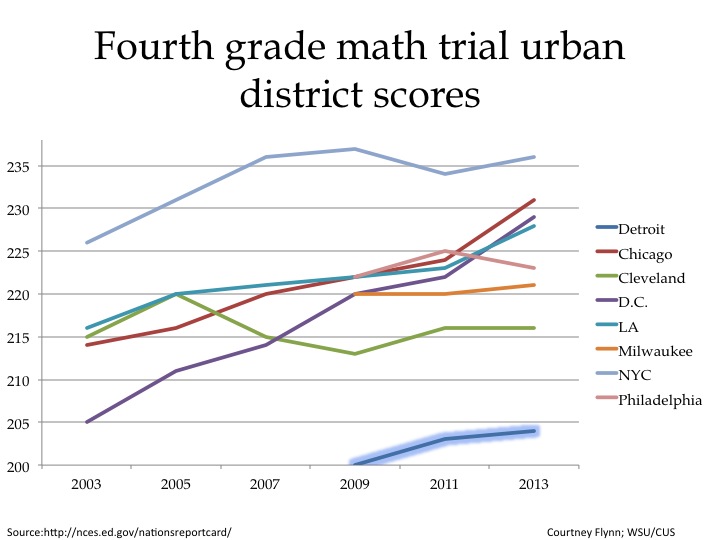
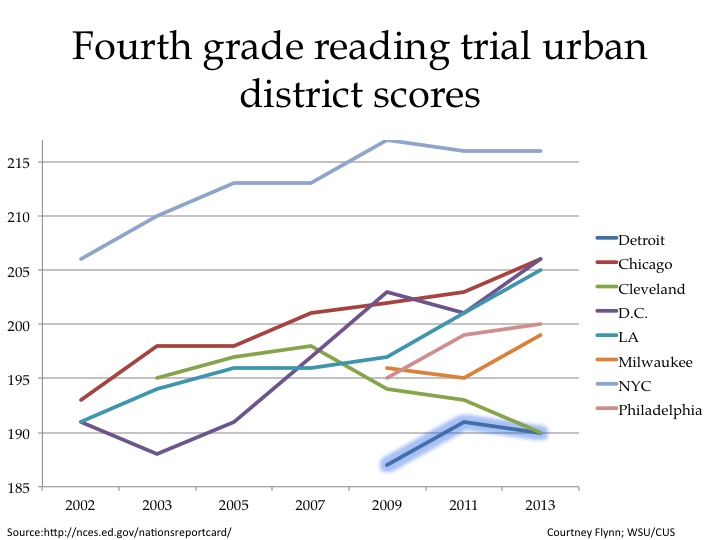
In addition to the NAEP test that is conducted across the country, the trial urban district scores are also produced by the NAEP. These scores are representative of all students in participating urban districts supported by federal appropriations authorized under the No Child Left Behind Act. However, the scores are based off a random sample of students in the districts; these results are also included in the overall NAEP scores for their specific state.

The Detroit Public School (DPS) system became a trial urban district in 2009. According to the data presented below, DPS has performed below all the other urban trial districts in the Great Lakes State region, along with the Los Angeles and Washington, D.C. public school districts. The fourth grade math trial scores is the only area where Detroit students showed an increase from 2011 to 2013. Even that score though (204) was 12 points below the next lowest score; this was Cleveland Public Schools (216).


Michigan ranks 20th in per pupil education funding

According to a New York Times article there are large disparities between states and the amount of resources they can put toward education. This is because most school districts are funded through local property taxes. For example, the state of New York had the largest per pupil funding in 2011 at about $18,000 while Utah’s spending was at about $7,000 per pupil; Utah had the lowest funding. The State of Michigan ranked 20th; about $11,000 was brought in per pupil in 2011. To learn where your state sits in the ranking read “In Public Education, Edge Still Goes to Rich.”

Educational attainment: The drop out rate is declining while the graduation rate is increasing

There is good news for Detroit’s children in this post. Both the graduation rate and the drop out rate are improving. This post shows, among other indicators of educational attainment, that the drop out rate in Detroit’s schools is declining, while the graduation rate is increasing.

In this post we also present educational attainment information by Census tract for the City of Detroit and a comparison of educational attainment for the City of Detroit and the State of Michigan.

edu1


From 2007 to 2009, the graduation rate for Detroit Public Schools slowly increased. After a drop to 59.7 percent in 2011, the Detroit graduation rate rose to 64.7 percent in 2012. In the same time frame, the State of Michigan’s graduation rate has not dipped below 74.3 percent. In 2012, it was recorded at 76.2 percent. Thus, there is some closing of the gap between Detroit and the state.

The same is true for drop out rates. The drop out rates for both Detroit and Michigan decreased from 2007 to 2009 and then remained relatively flat from 2009 to 2012. Nevertheless, the gap between the state and Detroit declined.

The graduation rates examined are based on the percentage of each four year cohort that graduates.

Edu2


According to information from the 2007-2011 American Community Survey, 28.3 percent of the Detroit’s population aged 18 to 24 years old had less than a high school diploma. The percentage for all Michigan residents was 17.4 percent. Those with a high school degree, or equivalent, comprised 33.4 percent and those with some college made up 34.6 percent of this same population. In the 2007-2011 time frame there were 3.7 percent of Detroit residents with a bachelor’s degree or higher. For Michigan, this was 6.7 percent.

edu3


In both Detroit and Michigan, the highest level of education attained by most residents aged 25 and older was a high school degree, or the equivalent: 33.4 percent in Detroit and 31.1 percent in Michigan.  Those with some college education, but no degree, made up 25.3 percent of the 25 and older population in Detroit and 23.8 percent in Michigan. While the city and state had similar rates in those two categories, Detroit had higher percentages of residents with less than a high school diploma and Michigan had higher percentages of residents with college degrees.


(Please click maps to make larger)

The above map shows the number of Detroit residents who received a high school diploma, or the equivalent, according to the American Community Survey 2007-2011 5-year estimate. The lowest levels of those who only earned a diploma are in the city’s inner core. Some of these locations in the lightest shade of purple are primarily industrial centers or commercial properties. There were nine Census tracts, shown in the darkest shade of purple, where at least 500 residents had a minimum of a high school diploma.


College graduates in Detroit are concentrated in three areas. These include, first, the far east side, areas adjacent to the Pointes.  Second there is a corridor along the Jefferson Boulevard into downtown and then up through Midtown. Third, a large area of the Northwest has a high number of college graduates.

To see our previous post educational attainment click here.

A comparison of MEAP data for Detroit and the Metro-Detroit area: Part II

This week’s post is a continuation on Drawing Detroit’s examination of the MEAP scores. Last week we took a look at the proficiency levels of students in third through sixth grade for the Detroit City School District, Wayne RESA, Macomb ISD, Oakland Schools and the State of Michigan. This week we will again look at those districts, but for grades seven through nine.

MEAP1

For the Detroit City School District, the percent of proficient seventh-graders on the math portion of the MEAP increased from 9.5 percent in 2011 to 13.2 percent in 2012. In the six years of data presented for this section of the test, 13.2 percent was the highest percent of students deemed proficient for the Detroit district.

While 13.2 was the highest percent of proficient students for the Detroit City School District, the highest percent of proficient students for Oakland Schools came in 2009 with 53.8 percent. In 2012, 53 percent of Oakland Schools’ seventh graders were proficient.

MEAP2

In all four geographical areas, along with the state average, there was only a slight increase in the percent of seventh graders deemed proficient on the reading portion of the MEAP test for 2012, compared to the previous year. As demonstrated throughout this post, the Detroit City School District had the lowest percent of students recognized as being proficient (33 percent in 2012) while the Oakland Schools had the highest (70 percent in 2012).

MEAP3

There were only data available from 2010-2012 for the writing portion of the test because it was modified prior to the 2010-2011 school year, making scores from previous years incomparable.

From 2011 to 2012, the percent of seventh-graders who were proficient on the writing portion of the MEAP increased at the city, tri-county, and state levels. However, all experienced a slight decrease in the percent of proficient students from 2010 to 2011.

In 2012, 28 percent of the seventh graders from the Detroit City School District were proficient on the reading portion of the MEAP. For the same year, 46 percent of the seventh-graders were proficient from the Wayne RESA, 53 percent of the Macomb ISD were proficient and 61 percent of Oakland School students were proficient. The state average of proficient seventh-graders on the writing portion of the MEAP was  51.7 percent.  Detroit students showed the greatest increases.

Slide08

The percent of eighth grade Detroit students deemed proficient on the math portion of the MEAP test increased from 7.2 in 2011 to 10.8 percent in 2012. There was also about a 3 percent increase from 2011 to 2012 for the State of Michigan, the Oakland Schools and the Wayne County RESA. The Macomb ISD saw a 1 percent increase.

Once again, Detroit was lowest while Oakland schools was at the top. For 2012, 10.8 percent of the Detroit eighth grade students were proficient, and 46 percent of the Oakland Schools eighth-graders were proficient.

MEAP5

When comparing Detroit City School District students to the tri-county and state averages, the largest gap in the percent of proficient students occurs on the eighth grade reading portion of the MEAP. In 2012, 9 percent of the Detroit eighth-graders were deemed proficient in reading whereas the state average was 66 percent. For the Wayne County RESA, 59 percent of the students were proficient.

MEAP6

The Detroit City School District saw about a 1.4 percent increase in the number of eighth-graders who were proficient in science from 2011 to 2012. The Wayne County RESA also saw an increase in the percent of eight grade students proficient in science from 2011 to 2012; it was 4 percent increase. The Oakland Schools, the Macomb ISD, and the state as whole all saw a decrease though.

MEAP7

The percent of proficient ninth-graders on the social studies portion of the MEAP increased for the Detroit City School District and the Wayne County RESA from 2011 to 2012. However, the 2012 numbers are lower than the 2008 numbers for these two districts as well as the Macomb ISD, the Oakland Schools, and the state.