Population, loss of state income play role in distribution of revenue sharing funding

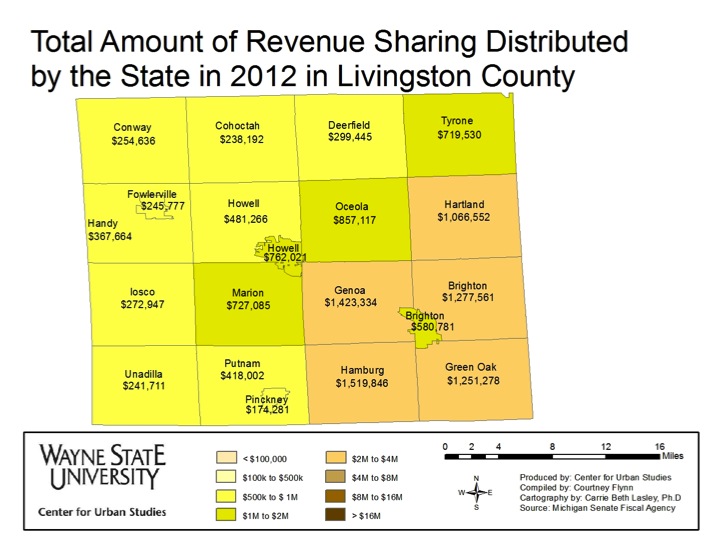
In the last post we examined how revenue sharing in Southeast Michigan has declined since 2003. In this post, the maps of each county show how much total revenue sharing each community in the seven-county region of Southeast Michigan received in 2012. Note that communities with higher populations (link to past population post), such as Detroit, received more funding.


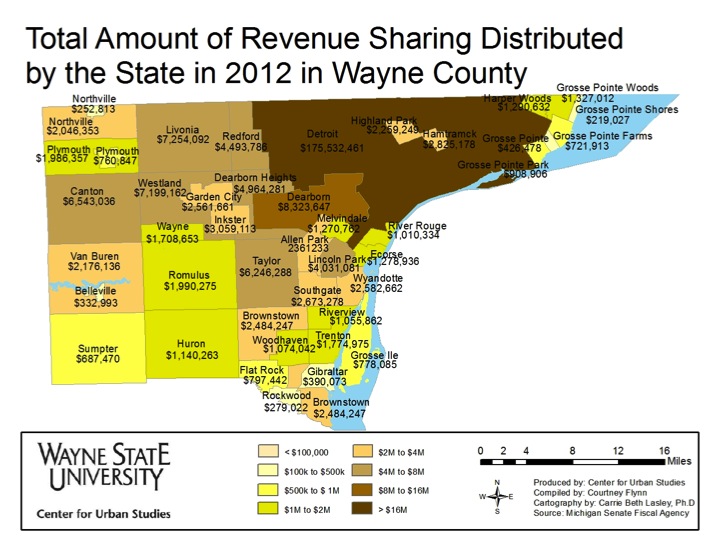
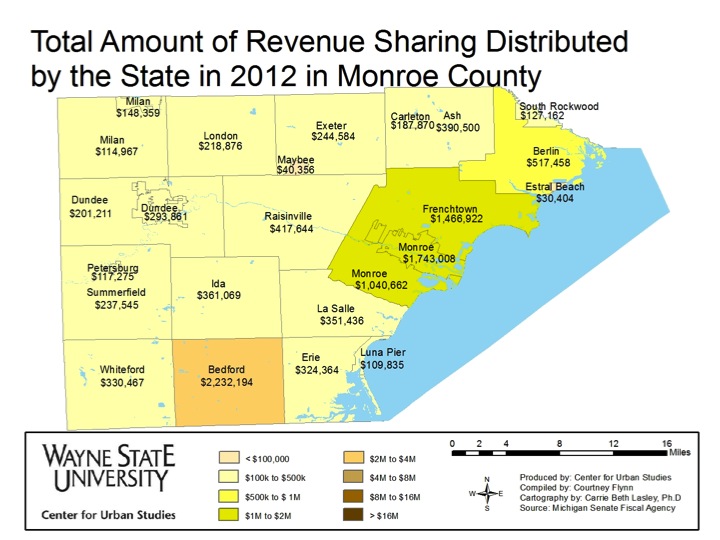
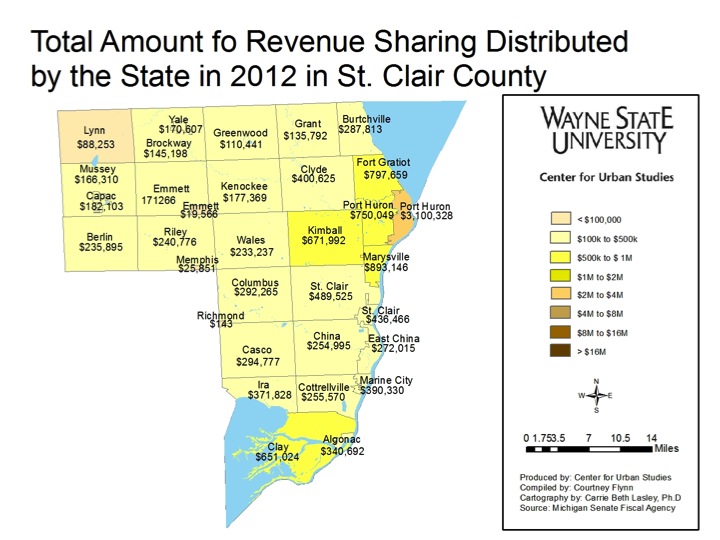
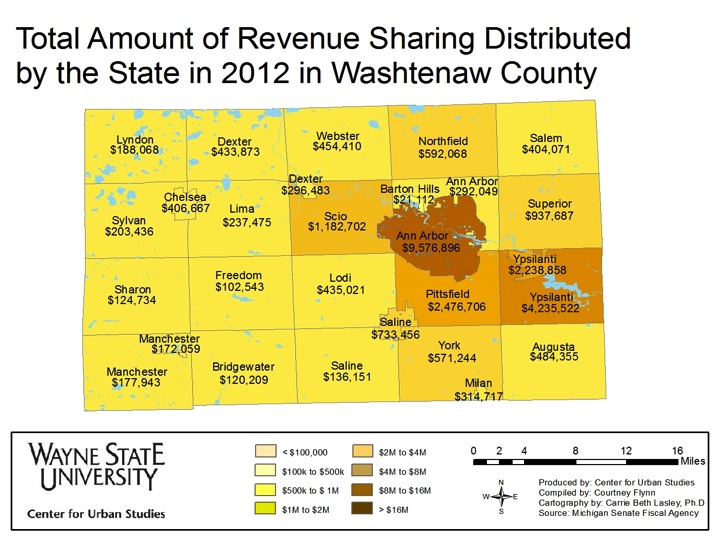
The above maps show the total revenue sharing funds that municipalities in the seven-county region received in 2012. Detroit received the highest amount of funds at $175,532,461, according the Senate Fiscal Agency. Of all the municipalities in the region, Detroit also had the largest population; in 2013, it was estimated by the Southeast Council of Governments (SEMCOG) to have 681,090 residents.

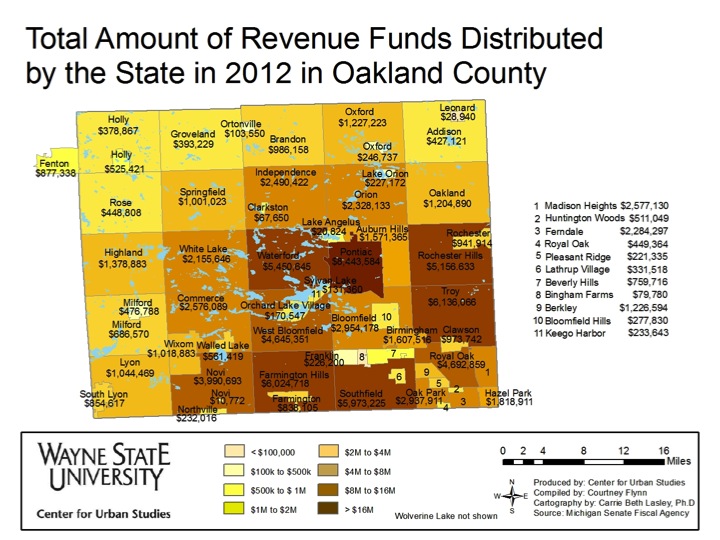
There are 12 municipalities in the region that received less than a $100,000 in revenue sharing for 2012. Southfield Township in Oakland County received the lowest level of funding; it also had a population of 14,547, according to 2012 data from Munetrix; SEMCOG does not list Southfield Township. Estral Beach, a village in Monroe County, had the lowest population of all the municipalities in the region in 2012; according to SEMCOG it was 388.

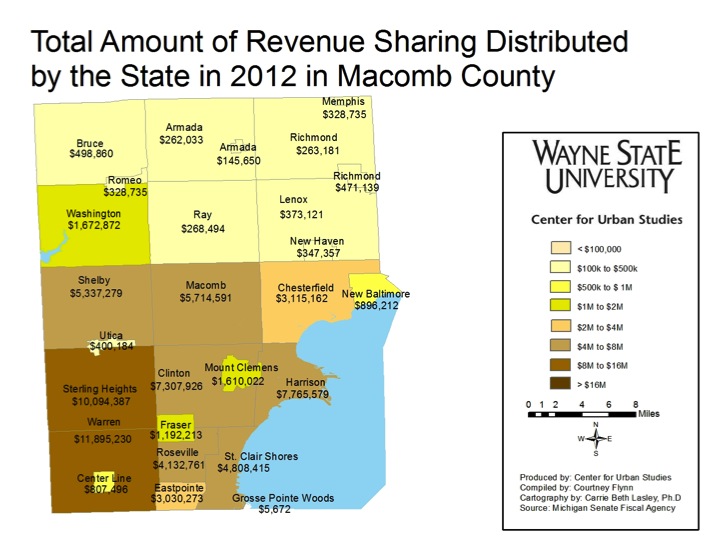
As can be seen in the maps above, the counties with higher populations (Wayne, Oakland, and Macomb) received higher revenue sharing funding. This is because funding formulas are, in part, related to population.

According to the Michigan Department of Treasury, statutory /EVIP funds are  distributed based on a formula. An upcoming post with provide examples of how these formulas have worked at different points in time. For now, it will  help to know that the formula considers the following:

•Population Unit Type
•Taxable Value Per Capita
•Yield Equalization
•Percent Share of Fiscal Year ’98


Population Unit Type – According to the Citizen’s Research Council (CRC), with the population unit type formula, cities are weighted the most and villages are weighted the least; to see how population and municipality type affect funding click here.

Taxable Value per Capita – The taxable value per capita formula takes the state’s average per capita taxable value and multiplies it by a given municipality’s population, according the Michigan Department of Treasury.

Yield Equalization – The yield equalization formula is used to “create a minimum guarantee on combined state and local revenue per mill of tax levy,” according to the CRC. This number is calculated by multiplying the number of mills in a local effort by the difference between the guaranteed and actual tax levy per capita; that number is then multiplied by the population in each municipality, according to the CRC.

Percent Share of Fiscal Year ’98 – According to the Michigan Department of Treasury, the percent share of fiscal year (FY) ’98 formula takes “each City, Village and Township’s FY ’98 statutory payments (Relative Tax Effort, Per Capita, and Inventory Reimbursement) and divides it by the FY ’98 Statewide Total Distributed to determine their Percent Share Factor.”

Beginning in 2002, 60 percent of the FY ’98 were paid using this formula; the percent paid then increased by 10 percent each year, according to the Michigan Department of Treasury.

Slide11 Slide12

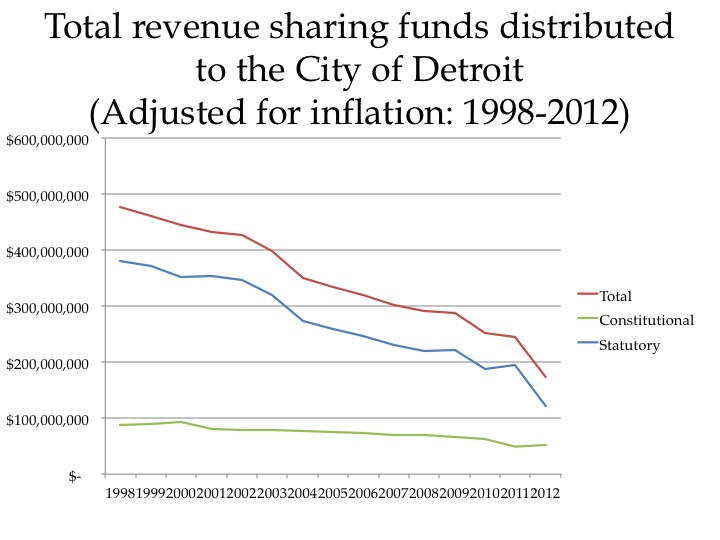
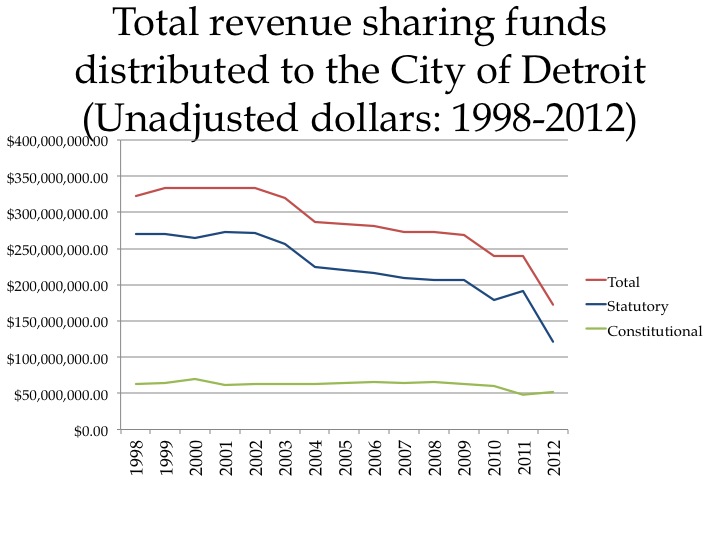
As we have seen in the last two posts, the amount of total revenue sharing funds distributed to municipalities across the Southeastern Michigan region has been decreasing, and Detroit is no exception. When looking at real dollars, the City of Detroit lost about $149.5 million in revenue sharing funding from 1998-2012; statutory funding represented about $148 million of that. Adjusting the number to account for inflation, using 1998 dollars as a base, Detroit lost about $304 million in total revenue sharing funding from 1998-2012, of which statutory funding represented approximately $255 million.


Up until 1998, the Relative Tax Effort (RTE), which was enacted in 1971, was intended to help monies follow communities’ needs, according to the CRC. However, there were complaints that cities fared better from the RTE than did townships and villages. This is why in 1998 an amendment was made to change how statutory funds were distributed. This amendment, which the formulas above reflect, shifted from distributing statutory funds based on intangibles, income, and small business taxes to providing 21.3% of sales tax revenues at the 4% tax rate, according to the CRC. Also, in 1998 then Gov. John Engler and Detroit Mayor Dennis Archer made a deal that the city would receive $333.9 million in annual revenue sharing funds if the city would decrease its city income tax rate, according to a Detroit Free Press Article and a Bridge Magazine report. Only a few years after the deal was made the state began to cut revenue sharing fund distributions, across the board. Since then Detroit has decreased its city income tax but has also not received the $333.9 million a year it was guaranteed.

In next week’s post we will provide examples of  how the statutory revenue sharing formula has changed from 2002-2012 and how it has been beneficial to one community and detrimental to another.


Changes in Detroit and tri-county State Representative characteristics after the 2012 Election

One of our recent posts examined several characteristics of the State Representatives who represented Detroit and the tri-county region (Oakland, Macomb, and Wayne) during the 2011-12 term.  In this week’s post, we compare the characteristics for legislators in the 2011-12 term to those who are currently serving.  This will illustrate some effects of the November election and the new apportionment plan for the state House. The other unique aspect of Michigan’s 2012 election was the transition to the state’s new apportionment plan.  As a result of this election, many new representatives now sit in the state House, 42 of whom represent districts in Detroit and the tri-county area. Here we will examine some characteristics of these 42 officials.

The tri-county area lost three districts as a result of the new apportionment plan (a district is considered to be in Detroit or the tri county area if the majority of the district is geographically within Detroit or one of the tri-county’s boundaries, respectively).  Detroit did not gain or lose any districts, although under the new apportionment plan, several Detroit districts no longer represent Detroit exclusively, and now contain portions of surrounding areas. According to the new plan there are now five districts that represent Detroit exclusively; last term there were nine.

Rep1

The chart above compares all 42 of the current representatives in the tri-county area to their 45 predecessors on the basis of four criteria: party affiliation, gender, membership in the legislative Black Caucus, and committee leadership (a legislator is considered a committee leader if he or she is the chair, vice chair, and minority vice chair on one or more state House committees.  This definition allows members of the minority party to be included).  Overall, the percentage of Democratic tri-county representatives has remained roughly the same, declining only somewhat after the 2012 election.  This slight decline occurred despite President Barack Obama’s electoral strength in the tri-counties.   A smaller percentage of women now represent the region compared to the previous term.  Furthermore, a smaller percentage of tri-county representatives are members of the legislative Black Caucus.  In contrast to these declines, however, a greater percentage of this region’s representatives serve as committee leaders during the 2013-14 term. Oakland, Macomb and Wayne counties, along with Detroit, all saw an increase in the number of representatives who entered their third term after the 2012 election; in turn there were fewer freshman entering. This means we can expect substantial turnover in the next term.

•A considerable majority (64%) of representatives are Democrats;
•Women constitute 24% of tri-county representatives;
•Only 21% are members of the legislative Black Caucus (membership in the legislative Black Caucus does not necessarily reflect racial identification;)
•The majority (57%) of tri-county representatives hold committee leadership posts during the 2013-14 term;
•Just over one third of Detroit’s representatives are now serving their third terms and exactly half are in their second terms.  The proportions are very similar for representatives in outlying tri-county districts, except that a greater percentage of freshman representatives (21%) are serving the region outside of Detroit.

In this chart, and the remainder of the charts in this post, the percentage of representatives that represent the specific criteria being examined correspond with the height of the bar. When looking at the number above each bar, that represents that number of representatives that make up each percentage.

Reps2

The increase in committee leadership is driven by the higher percentage of state representatives from Detroit who are now committee leaders. The chart above reveals the magnitude of this increase.  The chart also reveals that, as with the tri-county region as a whole, a smaller percentage of Detroit’s state representatives are women and members of the legislative Black Caucus.  As with the previous term, all state representatives of Detroit are Democrats.

Last term, Detroit had 12 representatives, three of whom served districts that were only partially in Detroit.  Of those three districts, one was not “majority-Detroit,” so there were 11 “Detroit districts” last term. This term, Detroit has 10 representatives, five of whom serve districts that are only partially in Detroit.  Of those five districts, two are not “majority Detroit,” so there are eight “Detroit districts” this term.

reps3

reps4

reps5

When we examine each of the counties individually, we observe additional changes.  The charts above show some exceptions to the broader shifts noted above.  They illustrate, for example, that Wayne County districts outside of Detroit lost committee leaders after the 2012 election.  They also show Oakland County is the only county to have lost Democratic representatives, and Macomb County remains the only area in the tri-county region not represented by a member of the legislative Black Caucus.

reps6

reps7

Another characteristic of state representatives is their length of service.  Michigan state representatives are constitutionally limited to three terms; therefore all representatives are in one of three stages of their state House careers.  After the 2012 elections, the percentage of first-term representatives from Detroit districts dropped substantially from 55 percent to 13 percent, while the percentage serving their third terms increased from 9 percent to 38 percent.  Half of the city’s state representatives are now in the second terms.

This situation is parallel to the one depicted for those tri-county representatives whose districts are outside of Detroit.  Here again, the percentage of freshmen dropped 20 percentage points, while the proportion of third-termers increased by 23 percentage points.

reps8

reps9

reps10

The charts above demonstrate that term of service proportions have moved in the same direction for Detroit and each of the counties in Metro-Detroit.   The percentages move in the same direction even when broken down by county.  The main exception is Macomb County, which saw an increase in second-term representatives after the 2012 election.  Taken together, the tri-county region will see a higher rate of retirement in 2014 than it saw in 2012 due to the higher proportion of third-term representatives.

Most serpentine district poll winner announced

According to Drawing Detroit viewers, the most serpentine district is Michigan’s 76th District for the House of Representatives. This district received 18 of the 34 votes, or 53% of the vote. Michigan’s 14th Congressional District came in second place with 10 votes, or 29% of the vote. There is a tie for the third most serpentine district. According to the voters, Michigan’s 11th Congressional District and Michigan’s First State Senate District each received two votes, or 10% of the vote.

Serpentine poll update

As of 7:30 a.m. on Monday, Jan. 7, these are the results of the most “serpentine” poll posted last week:

Michigan’s 76th District for the House of Representatives: 17 votes ( 52%)

Michigan’s 14th Congressional District: 10 votes (30%)

Michigan’s 11th Congressional District: 2 votes (6%)

Michigan’s First State Senate District: 2 votes (6%)

Michigan’s 13th Congressional District: 1 vote (3%)

Michigan’s 13th District for the House of Representatives: 1 vote (3%)

With only 33 votes thus far, we will be leaving poll open for another week. Voting will now end on Tuesday, Jan. 15. Votes can be cast here.

POLL: Which district is the most serpentine?

Happy New Year. This year Michigan’s elected officials begin representing some of the wackiest districts in recent years. This is because the re-districting process that Michigan goes through every ten years apparently abandoned any attempt to maintain compact districts. And, as a result, we have some truly serpentine districts for State House and Senate as well as members of the U.S. House of Representatives. The districts are as narrow as 600 feet in places, the reported length of one of Babe Ruth’s home runs.

We have decided to have a contest and let our readers decide which district they consider most serpentine. “Serpentine” means “winding or turning one way and another” according to one definition in Webster’s that captures the connotation we seek to convey here.

Below, you will find 11 different Michigan districts (four from the U. S. House of Representatives, four from the Michigan Senate, and three from the Michigan House) that can viewed as serpentine. These were nominated by political scientists and graduate students.  We are asking our readers to choose which district, by popular vote, is the most serpentine. After a week of voting we will post the results.

[polldaddy poll=6799525]

CONGRESS

The Ninth Congressional District in the state covers communities in both Macomb and St. Clair counties. These communities are: Bloomfield Township, Southfield Township, City of Royal Oak, Berkley, Huntington Woods, Pleasant Ridge, Ferndale, Hazel Park, Madison Heights, Center Line, Warren, Sterling Heights, Mt. Clemens, Fraser, Clinton Township, Roseville, Eastpointe, and St. Clair Shores. On Nov. 6 Sander Levin-D was elected to represent this district; he previously represented the 12th Congressional District before redistricting.

Cong9

The 11th Congressional District is made up of the following Oakland County communities: Clawson, Birmingham, Bloomfield Hills, Troy, Auburn Hills, Lake Angelus City, Keego Harbor, Sylvan Lake, Waterford Township, White Lake Township, Commerce Township, Milford Township, Walled Lake, Wixom, City of Novi, Novi Township, City of Northville, Northville Township, City of Plymouth, Plymouth Township, Livonia, City of Farmington, Canton, Lyon Township, and the City of South Lyon. Thad McCotter resigned as the representative on July 6, 2012. Kerry Bentivolio-R will be begin representing this district in January.

Cong11

The 13th Congressional District covers the Wayne County communities of: Redford Township, Highland Park, portions of Detroit, Ecorse, Melvindale, River Rouge, Dearborn Heights, Inkster, Wayne, Westland, and Romulus. This district is represented by John Conyers Jr.-D.Cong13

The 14th Congressional District in the state is made up of: Pontiac, Orchard Lake, West Bloomfield Township, Farmington Hills, City of Southfield, City of Lathrup, Grosse Pointe Shores, Oak Park, Royal Oak, Hamtramck, a portion of Detroit, Harper Woods, Grosse Point Farms, Grosse Pointe Shores, Grosse Pointe, and Grosse Pointe Park.  This district, which was formerly the Ninth District, is represented by Gary Peters-D, who was re-elected on Nov. 6.

Cong14

Senate

The First State Senate District in Michigan is made up of: Grosse Ile, Gibraltar, Brownstown, Trenton, Woodhaven, Riverview, Wyandotte, Ecorse, River Rouge and a portion of Detroit.  This district is represented by Coleman Young II-D.

Senate1

The Second Senatorial District in the state is made up of: portions of Detroit, Highland Park, Hamtramck, Harper Woods, Grosse Pointe Woods, Grosse Pointe Shores, Grosse Pointe Farms, Grosse Pointe, and Grosse Pointe Park. This district is represented by Bert Johnson-D.

Senate2

The Fourth Senatorial District in the state is made up of: Southgate, Allen Park, Lincoln Park, and portions of Detroit. This district is represented by Virgil Smith Jr.-D.

Senate4

The Fifth Michigan Senatorial District in the state is made up of: portions of Detroit, Redford Township, Dearborn Heights, Garden City, and Inkster. It is represented by Tupac Hunter-D; he is currently serving his second term.

Senate5

House:

The 13th District for the Michigan House of State Representatives is made up of: portions of Dearborn Heights, Allen Park, and Southgate.  Andrew Kandrevas-D is currently the representative for the district and was elected again on Nov. 6.

House13

The 29th District for the State House of Representatives is made up of: Auburn Hills, Pontiac, and Orchard Lake. The current representative is Tim Greimel-D; he was elected to serve again on Nov. 6.House29

The 76th House of Representatives District covers the City of Grand Rapids. On Nov. 6, incumbent Republican Roy Schmidt (who was formerly a Democrat) was defeated by Democrat Winnie Brinks.

House76

The images above were provided by the Michigan Secretary of State of Office.

Michigan ballot proposals

On November 6, Michigan voters will be asked to cast their vote on six general election proposals. This post provides for each proposal:

1) the exact language that will appear on the ballot;

2) who filed the petition to add the proposal to the ballot;

3) the direct campaign financing information (through July 20, 2012); and

4) the results of a September 2012 statewide poll of active and likely voters.

The Michigan Secretary of State makes the ballot proposal language available online: http://michigan.gov/documents/sos/2012_Statewide_Proposal_Language_all_with_links_398756_7.pdf

The Michigan Secretary of State also makes the petition information available online: http://michigan.gov/documents/sos/Bal_Prop_Status_2011_2_346859_7.pdf

Proposal 1:A REFERENDUM ON PUBLIC ACT 4 OF 2011 – THE EMERGENCY MANAGER LAW

Public Act 4 of 2011 would:

•Establish criteria to assess the financial condition of local government units, including school districts.
• Authorize Governor to appoint an emergency manager (EM) upon state finding of a financial emergency, and allow the EM to act in place of local government officials.
•Require EM to develop financial and operating plans, which may include modification or termination of contracts, reorganization of government, and determination of expenditures, services, and use of assets until the emergency is resolved.
•Alternatively, authorize state-appointed review team to enter into a local government approved consent decree.

Should this law be approved? o YES   o NO

PETITION FILED BY:Stand up for Democracy

  • 100% of the the direct campaign finance contributions for Proposal 1 is provided by Michigan AFSCME Local 25

Proposal 2: A PROPOSAL TO AMEND THE STATE CONSTITUTION REGARDING COLLECTIVE BARGAINING

This proposal would:

·  Grant public and private employees the constitutional right to organize and bargain collectively   through labor unions.

·  Invalidate existing or future state or local laws that limit the ability to join unions and bargain   collectively, and to negotiate and enforce collective bargaining agreements, including employees’   financial support of their labor unions. Laws may be enacted to prohibit public employees from striking.

·  Override state laws that regulate hours and conditions of employment to the extent that those laws conflict with collective bargaining agreements.

·  Define “employer” as a person or entity employing one or more employees.

Should this proposal be approved? o YES   o NO

PETITION FILED BY: Protect our Jobs

NO CAMPAIGN CONTRIBUTIONS LISTED

Proposal 3: A PROPOSAL TO AMEND THE STATE CONSTITUTION TO ESTABLISH A STANDARD FOR RENEWABLE ENERGY

This proposal would:

·  Require electric utilities to provide at least 25% of their annual retail sales of electricity from renewable energy sources, which are wind, solar, biomass, and hydropower, by 2025.

·  Limit to not more than 1% per year electric utility rate increases charged to consumers only to achieve compliance with the renewable energy standard.

·  Allow annual extensions of the deadline to meet the 25% standard in order to prevent rate increases over the 1% limit.

·  Require the legislature to enact additional laws to encourage the use of Michigan made equipment and employment of Michigan residents.

Should this proposal be approved? o YES   o NO

PETITION FILED BY: Michigan Energy, Michigan Jobs

Proposal 4:A PROPOSAL TO AMEND THE STATE CONSTITUTION
TO ESTABLISH THE MICHIGAN QUALITY HOME CARE COUNCIL AND PROVIDE COLLECTIVE BARGAINING
FOR IN-HOME CARE WORKERS

This proposal would:

·  Allow in-home care workers to bargain collectively with the Michigan Quality Home Care Council (MQHCC). Continue the current exclusive representative of in-home care workers until modified in accordance with labor laws.

·  Require MQHCC to provide training for in-home care workers, create a registry of workers who pass background checks, and provide financial services to patients to manage the cost of in-home care.

·  Preserve patients’ rights to hire in-home care workers who are not referred from the MQHCC registry who are bargaining unit members.

·  Authorize the MQHCC to set minimum compensation standards and terms and conditions of employment.

Should this proposal be approved? o YES   o NO

PETITION FILED BY: Citizens for Affordable Quality Home Care

  • 100% of the the direct campaign finance contributions for Proposal 4 is provided by Home Care First Inc.

Proposal 5:A PROPOSAL TO AMEND THE STATE CONSTITUTION
TO LIMIT THE ENACTMENT OF NEW TAXES BY STATE GOVERNMENT

This proposal would:

·  Require a 2/3 majority vote of the State House and the State Senate, or a statewide vote of the people at a November election, in order for the State of Michigan to impose new or additional taxes on taxpayers or expand the base of taxation or increasing the rate of taxation.

·  This section shall in no way be construed to limit or modify tax limitations otherwise created in this Constitution.

Should this proposal be approved? o YES   o NO

PETITION FILED BY: Michigan Alliance for Prosperity

Proposal 6:A PROPOSAL TO AMEND THE STATE CONSTITUTION REGARDING CONSTRUCTION OF INTERNATIONAL BRIDGES AND TUNNELS

This proposal would:

·  Require the approval of a majority of voters at a statewide election and in each municipality where “new international bridges or tunnels for motor vehicles” are to be located before the State of Michigan may expend state funds or resources for acquiring land, designing, soliciting bids for, constructing, financing, or promoting new international bridges or tunnels.

·  Create a definition of “new international bridges or tunnels for motor vehicles” that means, “any bridge or tunnel which is not open to the public and serving traffic as of January 1, 2012.”

Should this proposal be approved? o YES   o NO

PETITION FILED BY: The People Should Decide

  • 100% ($465,700,500) of the the direct campaign finance contributions for Proposal 6 is provided by DBIC Inc., which is Michigan billionaire and Ambassador Bridge Owner Matty Moroun’s company.

The  chart below reflects the total amount of direct campaign contributions for each proposal as of July 20, 2012.

Economic Incentive: American Recovery and Reinvestment Act of 2009

The American Recovery and Reinvestment Act of 2009 was passed by Congress and signed into law by President Obama in February of 2009. The Recovery Act provided various economic incentives in order to address the national economic crisis. The incentives included tax cuts and benefits, funding for entitlement programs, and funding for contracts, grants, and loans. Its intention was to create new jobs, keep existing jobs, and encourage economic activity. Recipients of the Recovery Act funds are required to submit reports every January, April, July, and October; the data from these reports are publicly available at Recovery.gov.  On July 30, 2012, Drawing Detroit retrieved the most recent data on the distribution of Recovery Act funds from Recovery.gov to examine how the act impacted Michigan.

The first chart shows the 10 states in the nation with the highest amount of awarded Recovery Act funds cumulative from February 2009. California has been awarded the most funds at over $34.7 billion. Michigan has been awarded the eighth highest amount at over $8.6 billion, approximately a quarter of the amount awarded to California.

The second chart shows the 10 states with the highest number of recipient reported jobs in Quarter 2, 2012 (April 1 – June 30, 2012) based on the Recovery Act funds. Many of the same states appear in both charts, but some do not. Michigan is not in the top 10 for the number of jobs; it is 14th in the nation with 3,293 jobs created through the Recovery Act. California has the highest value with 19,024 recipient reported jobs.

The first chart shows the total Recovery Act funds awarded to the states that border at least one of the five Great Lakes; the amounts are cumulative from February 2009. The total amount of funds awarded to Michigan is approximately half the amount awarded to New York, which received over $17 billion. Michigan has been awarded funding similar to amounts awarded to Ohio and Pennsylvania.

The second chart shows the number of Recovery Act recipient reported jobs for the  eight Great Lakes states; the numbers are for Quarter 2, 2012 (April 1 – June 30, 2012).

Eleven agencies have each awarded over $100 million Recovery Act funds to recipients in the State of Michigan. The first chart shows the total amount of funds awarded cumulative from February, 2009 from each of those agencies. The Department of Education has awarded the highest amount of funds in Michigan (i.e., over $2.6 billion). The Department of Energy has awarded over $1.6 billion, and the Department of Transportation has awarded over $1.3 billion. The remaining eight agencies have each awarded less than $600 million to recipients in Michigan.

The second chart shows the number of jobs in Quarter 2, 2012 (April 1 – June 30, 2012) that Michigan recipients reported for the funds awarded by the 11 agencies. Recipients reported about 766 jobs using funds from Department of Energy awards, which is the highest number of jobs among the 11 agencies. The fewest number of jobs reported by Michigan recipients is 70.42 jobs using Environmental Protection Agency awards.

The first chart shows the total Recovery Act awarded funds cumulative from February, 2009 for the seven-county Southeast Michigan region. Three counties (i.e., Livingston, Monroe, and St. Clair) have each been awarded less than $10 million, with the lowest amount awarded to Livingston with just under $2.9 million. Wayne County has received the highest cumulative amount at over $1.1 billion. The same data pattern appears for the number of jobs recipients in the seven-county region reported in Quarter 2, 2012 (April 1 – June 30, 2012). Wayne County recipients reported the highest number of jobs (i.e., 761) while Livingston recipients did not report any jobs and only two were reported in Monroe and St. Clair counties.

The first chart shows the 10 cities in the State of Michigan with the highest amount of awarded Recovery Act funds cumulative from February 2009. The amounts range from over $1.7 billion in Lansing to just under $150 million in Wayne. Besides Lansing, only two other Michigan cities have been awarded over $500 million in Recovery Act funds; these are Detroit and Ann Arbor. The second chart shows the 10 Michigan cities with the highest number of recipient reported jobs in Quarter 2, 2012 (April 1 – June 30, 2012), based on the Recovery Act funds. Most of the cities in the second chart also appear in the first chart. Lansing, Detroit, and Ann Arbor again appear as the top three, in that respective order (i.e., 1067.6 jobs in Lansing, 662.5 in Detroit, and 373.6 in Ann Arbor).