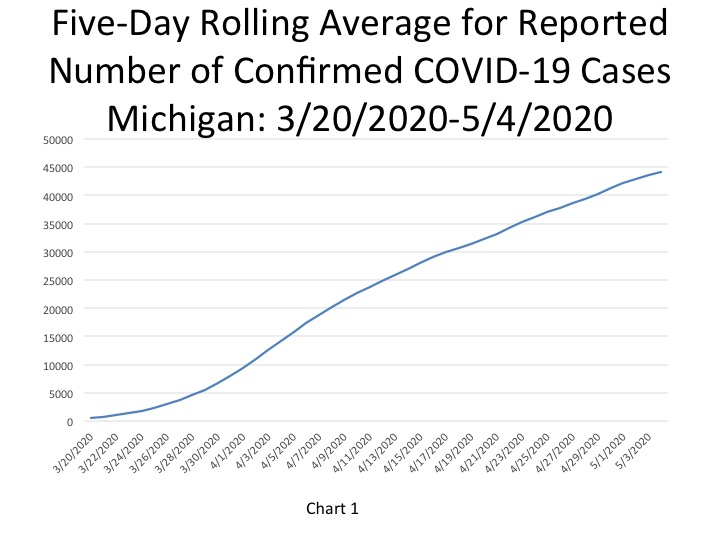
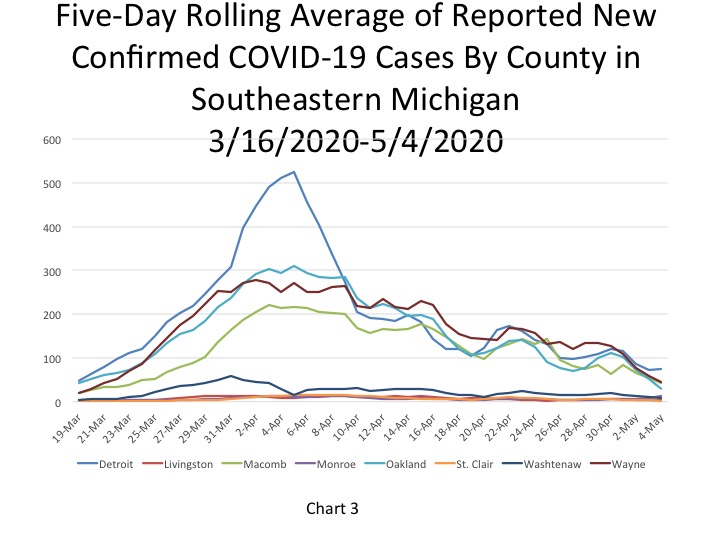
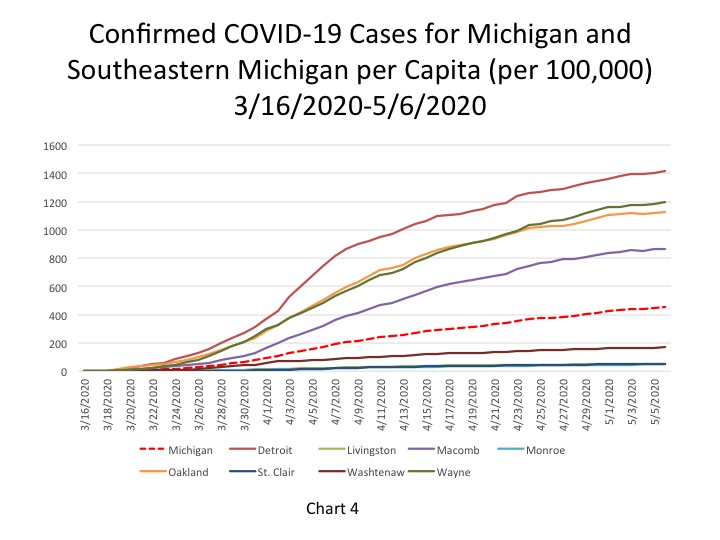
According to the State of Michigan, the total number of COVID cases in Michigan rose to 45,054, an increase of 657 cases from the previous day. This total was equivalent to 451 cases per 100,000 people (Chart 4) on May 6. The five-day rolling average for the total number of COVID cases (Chart 1) reflects a smoother curve and adjusts for fluctuations in testing and/or the quality of reporting or failure to report. That curve continues to trend upward, but the number of new COVID cases identified each day in Southeastern Michigan has been slowly decreasing since the middle of April. All entities in the region reported less than 100 new daily cases. Detroit reported the highest number of new cases at 78 (Chart 3). Officials are noting recent COVID case increases in West Michigan, which are also contributing to the State’s increase. Kent County reported 102 new cases on May 6. Note that this five day rolling average causes these daily case and the daily death charts to lag two days behind.
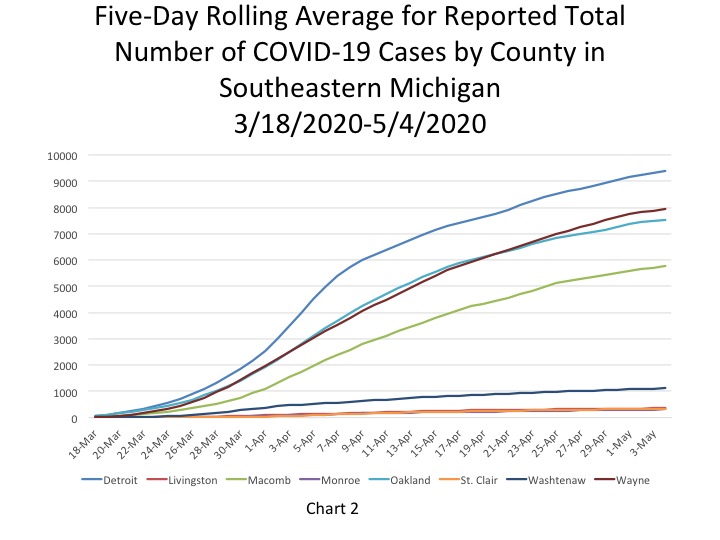
Chart 2 reflects the five-day rolling averages at the County level and for the City of Detroit. Although the overall number of COVID cases across the region continues to increase, the rates of increase have been declining. Detroit still has the highest number of reported COVID cases at 9,404 on May 4, with Wayne County following at a reported 7,932 cases. On May 4, the five-day rolling average for the number of COVID cases in Oakland County was 7,521, and Macomb County reported 5,760.
The daily data highlighted in these posts is from Michigan.gov/coronavirus, where data is updated daily at 3 p.m. Historical data were supplied from covidtracking.com, which republishes COVID data from the State.
The City of Detroit had 1,418 COVID cases per 100,000 people on May 6, an increase from 1,401 the day before (Chart 4). This is based upon a reported increase of 112 new cases, bringing the total number of COVID cases in Detroit to 9,536. Wayne County reported 1,195 cases per 100,000 people, and Oakland County had 1,126 cases per 100,000 people. These per capita rates were based upon 8,035 total cases for Wayne and 7,537 for Oakland. Macomb County reported 867 cases per 100,000 people, which is based upon 5,832 cases.
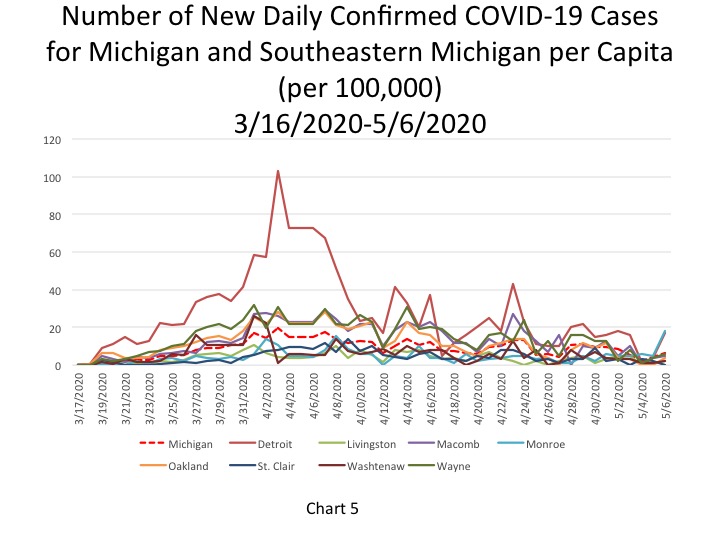
Chart 5 shows that despite a recent dramatic decrease in the number of daily COVID cases per capita, though some government entities experienced a noticeable increase on May 6. On May 6 Detroit reported a rate of 17 new daily COVID cases per 100,000 people, which was equivalent to 112 new cases. Monroe County reported the highest rate at 18 new COVID cases per 100,000 people, which was equal to 27 new cases ( 354 total cases in Monroe County). Wayne County’s per capita rate was reported to be 6 new cases per 100,000 people, Oakland County’s rate was 4 and Macomb’s was 2. These rates were equivalent to 68, 51 and 43 new daily COVID cases, respectively. Detroit was the only one with a rate that quadrupled from the previous day. This could be due to a continued increase in testing; it could also be related to how the data was reported by the State on May 4 and May 5 due to software issues and backlogs.
The State’s per capita rate was 6.6 new cases per 100,000 people, equivalent to 657 new cases. The number of new COVID cases in Southeastern Michigan accounted for 311 of those 657 new cases.
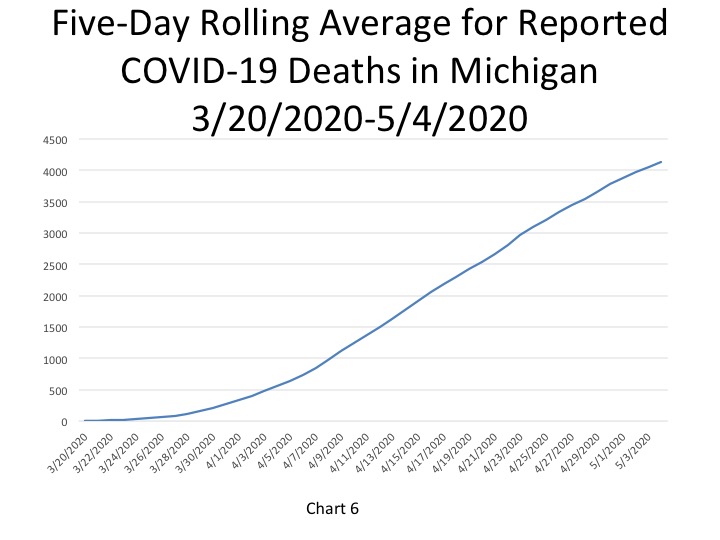
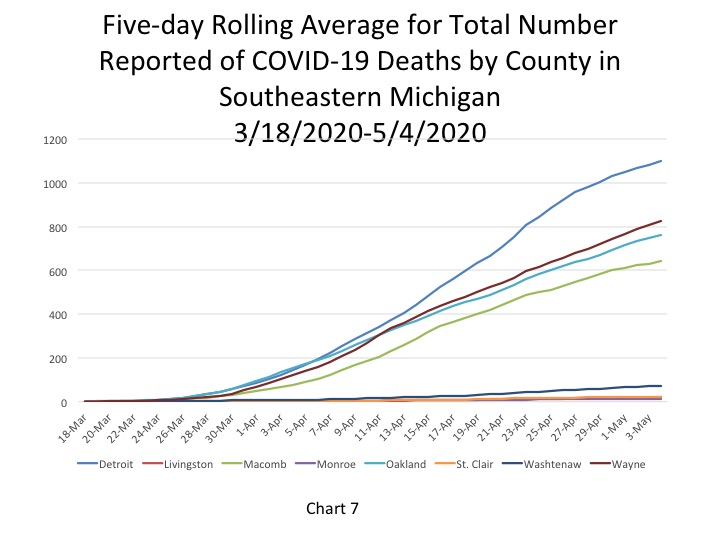
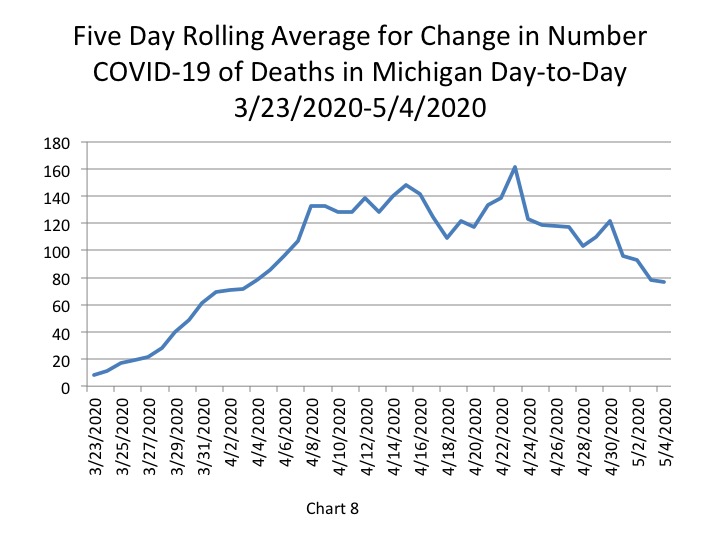
In Chart 6 the five-day rolling average for the number of deaths shows a continuing steady increase (a lagged number of 4,127 deaths, an increase of 77 deaths). The actual reported COVID-19 deaths reached 4,250 on May 6, an increase of 71 deaths from the day prior. Of the additional daily deaths, 49 occurred in Southeastern Michigan, 18 of which were in Detroit. Chart 8, a five-day rolling average chart, shows that the number of daily additional deaths in Michigan has been declining overall since April 23. With Southeastern Michigan making up 84 percent of the State’s total number of COVID deaths, we see how the increases or decreases directly impact the curve at the State level. Chart 7 portrays how the total number of COVID deaths in Southeastern Michigan continues to increase, but that rate has been gradually declining overall.
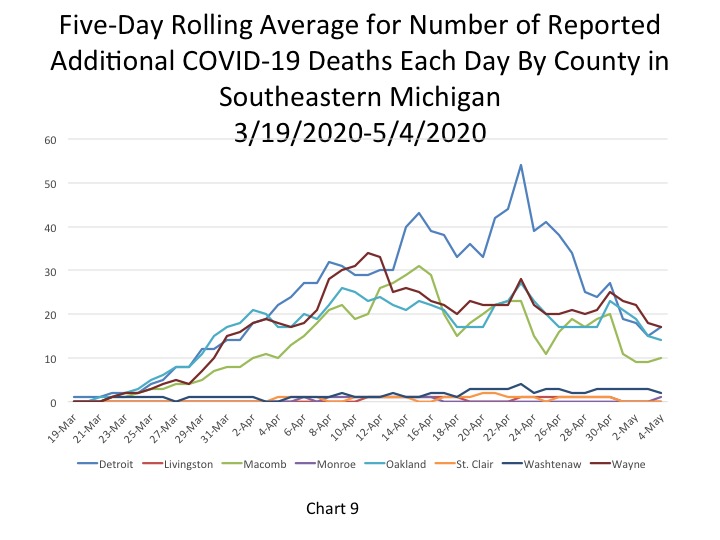
Chart 8 shows that the number of daily deaths in Michigan has also been declining, in part, due to the overall decline in the number of daily deaths in Southeastern Michigan. As Chart 9 portrays, no entity in Southeastern Michigan has reported 20 additional COVID deaths or more since May 2. Both Charts 8 and 9 represent five-day rolling average for the number of COVID deaths. Detroit and Macomb County experienced small increases in the number of daily deaths. Additionally, Detroit and Wayne County reported the same number of daily deaths on May 4 (17). Livingston and St. Clair counties haven’t experienced any increases in the total number of COVID deaths in May.
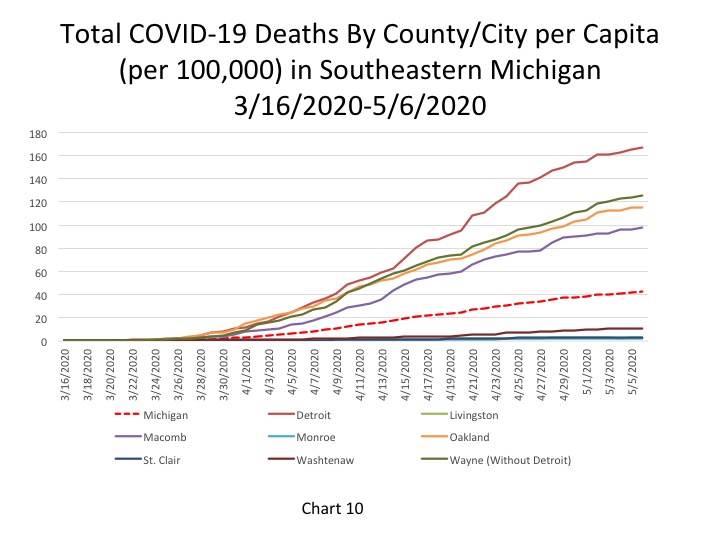
Chart 10 portrays the total number of COVID deaths per 100,000 people. As of May 6, the cumulative total of COVID deaths per 100,000 people in Detroit was 167 (representing 1,126 deaths). In Wayne County there were 126 COVID deaths per 100,000 people (847 total deaths), in Oakland County there were 115 deaths per 100,000 people (774 total deaths), and in Macomb County there were 98 COVID deaths per 1000,000 people (662 total). The State of Michigan had 43 COVID deaths per 100,000 people, a rate that continues to remain lower than the four entities discussed above.
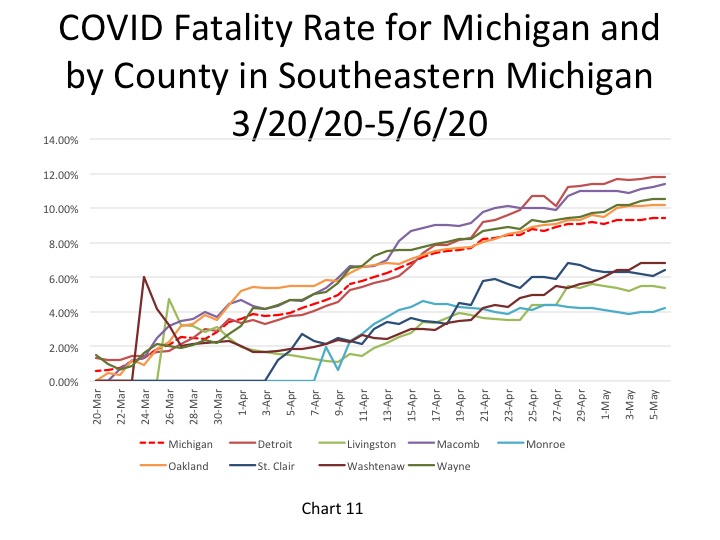
The fatality rate in Detroit remained at 11.8 percent on May 6 while Macomb County’s increased to 11.4 percent. The State’s fatality rate remained steady at 9.4 percent. Detroit, Wayne, Oakland and Macomb counties all have fatality rates higher than Michigan’s and above 10 percent.
One reason we may be seeing such high fatality rates in Michigan is due to the low testing rates. When only having-presumably-a lower of number confirmed COVID cases than is actually likely due to the scarce availability of tests, the fatality rate appears higher because the base comparison is smaller than it might be.
It has been 8 weeks since the first COVID cases were reported in Michigan and the data is showing, at least for Southeastern Michigan, that the spread is starting to slow. The number of daily cases and deaths in Southeastern Michigan continues to either remain stagnant or decline. The west side of the State is experiencing a recent uptick in the number of confirmed cases and deaths, which certainly affects the overall trend lines for the State. However, with social distancing proven to work numbers throughout the State should continue to decline. That is the case, assuming the Governor’s orders stay in place.