In this post long-term employment data for Southeast Michigan is presented, including information for the City of Detroit and the region’s seven counties. As can be seen in the following charts, while Wayne County and the City of Detroit have experienced a loss of labor force and jobs, the less populous counties have fared better in recent times, particularly Livingston County.
The four charts below examine annual, unadjusted, employment data from 1970-2012. Please note that there was a change in methodology from 1989 to 1990, according to the Michigan Department of Technology, Management and Budget (MDTMB). Because of the change, Bruce Weaver of the Michigan Department Management, Technology and Budget warned that numbers may not be fully comparable.
According to the Bureau Labor Statistics, the various categories to describe unemployment “use data from several sources, including the Current Population Survey, the Current Employment Statistics program, State UI systems, and the decennial census, to create estimates that are adjusted to the statewide measures of employment and unemployment. Below the labor market area level, estimates are prepared using disaggregation techniques based on inputs from the decennial census, annual population estimates, and current UI data. This is the current methodology being used.”
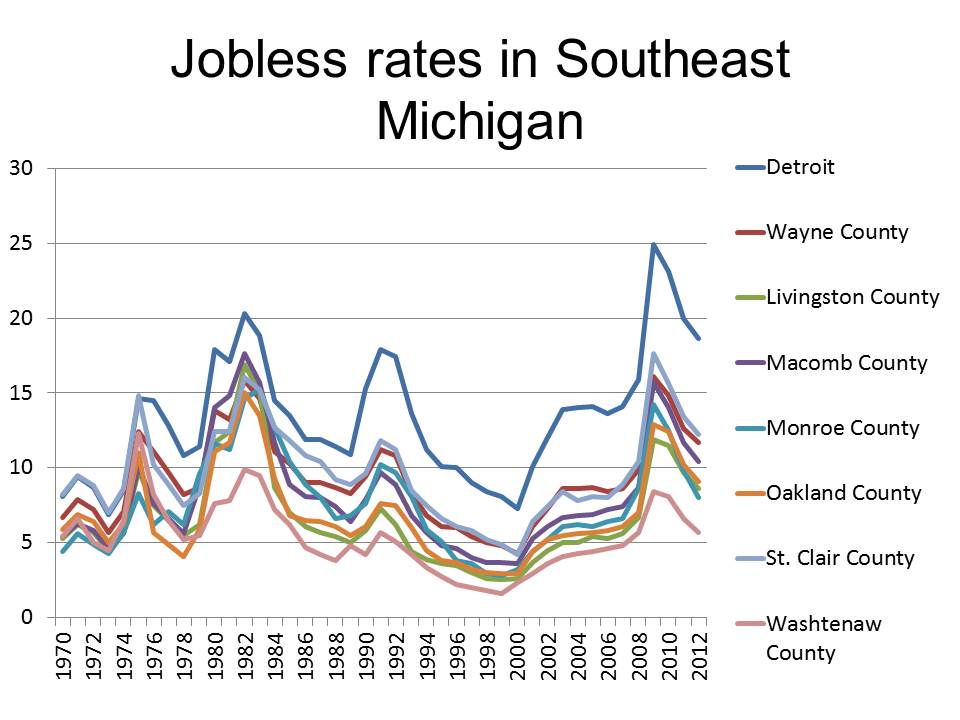
The jobless rate is the percent of the labor force that is unemployed at a given time. Since 1975 the City of Detroit’s jobless rate has remained higher than the rates of the surrounding counties. For example, in 2009, Detroit’s jobless rate reached an all-time high of 24.9 percent, while at that same time the jobless rate in Washtenaw County was 8.4. Although the jobless rate has been declining since 2010, Detroit’s was still recorded at 18.4 percent in 2012. For Washtenaw County, which has consistently had the lowest jobless rate in the region since 1979, it was recorded at 5.7 percent for 2012.
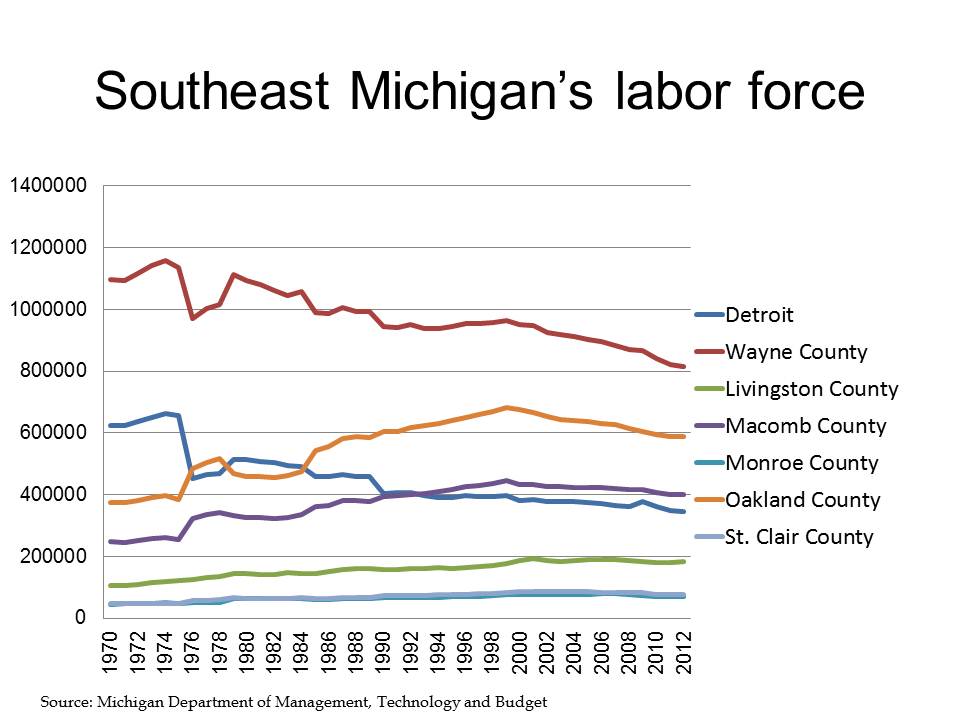
According to Bureau of Labor Statistics, the labor force is, “all persons classified as employed or unemployed.” For the following three charts, please keep in mind that population numbers are closely related to the labor pool. For more information on population, please view this previous post. While Wayne County’s labor force has been primarily declining since 1979, the labor force for both Macomb and Oakland counties increased from 1984 to 2000. Both decreased after 2000. Livingston County has experienced a gradual increase its labor force since at least 1984. The labor force in Monroe and St. Clair counties has also inched up, but these two counties have experienced the least amount of change. In 2012, Detroit’s labor force was recorded at 343,856 and Wayne County’s was recorded at 816,059. This represents a 45 percent decline in Detroit’s labor force since 1970, when it was 624,475, and Wayne County’s was 1,090,505.
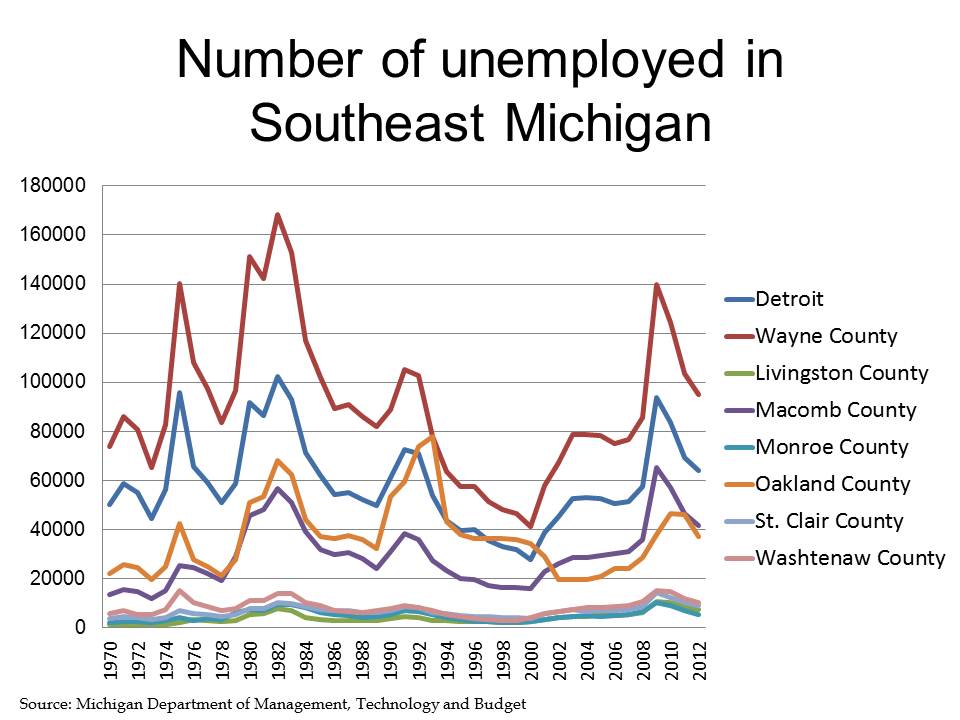
Unlike the labor force and employment numbers, the number of unemployed in the seven-county region has been much more erratic, linked to the ups and downs in the economy. All counties, along with the City of Detroit, experienced a peak in their unemployment numbers in 1982 and then again in 2009, with smaller peaks in 1974 and 1993. The counties with the smaller populations –Livingston, Monroe, St. Clair, and Washtenaw –have experienced the least amount of change.
Although the City of Detroit has a smaller population than Oakland and Macomb counties, its unemployment numbers have typically been higher. For example, in 2012 there were 63,836 unemployed people living in the City of Detroit, there were 41,530 in Macomb County and 37,570 in Oakland County.
For the record, the Bureau of Labor Statistics, an unemployed person is described as someone“16 years and older who had no employment during the reference time, were available for work, except for temporary illness, and had made specific efforts to find employment sometime during the 4-week period ending with the reference week. Persons who were waiting to be recalled to a job from which they had been laid off need not have been looking for work to be classified as unemployed.”
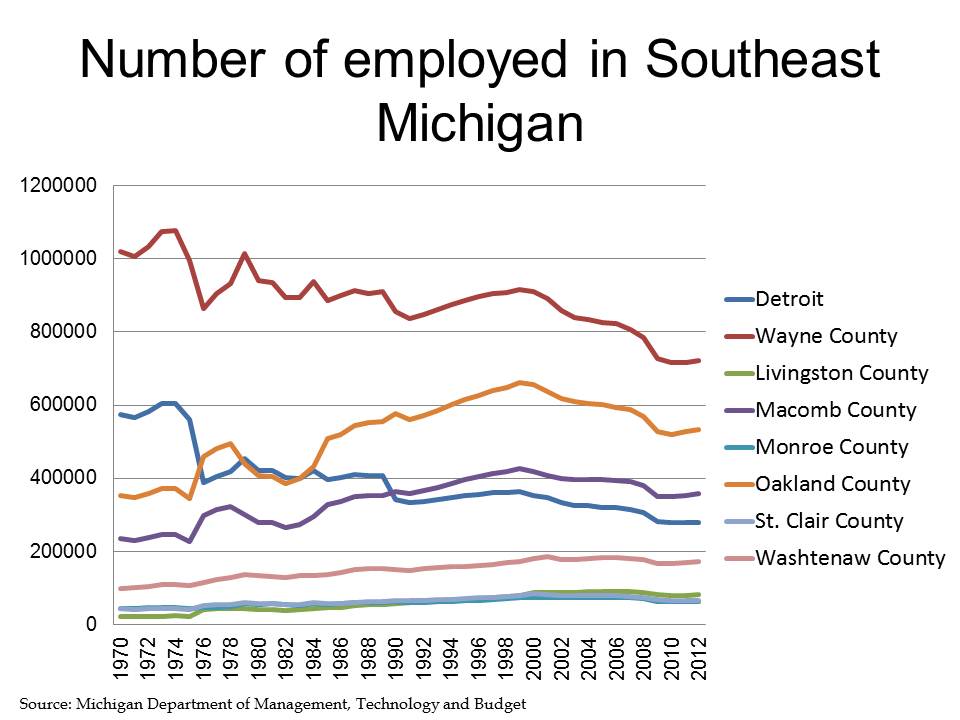
The graphs showing decline in the labor force in the area are similar to those for the number of employed persons. Wayne County and Detroit experienced the largest declines, while Oakland and Macomb counties have experienced the greatest increases . Declines for most counties and cities in Southeast Michigan began in 2000. Beginning in 2007, all areas experienced a steep decline the number of employed, as reflective of the beginning of the recession. In 2009, employment numbers did begin to increase again