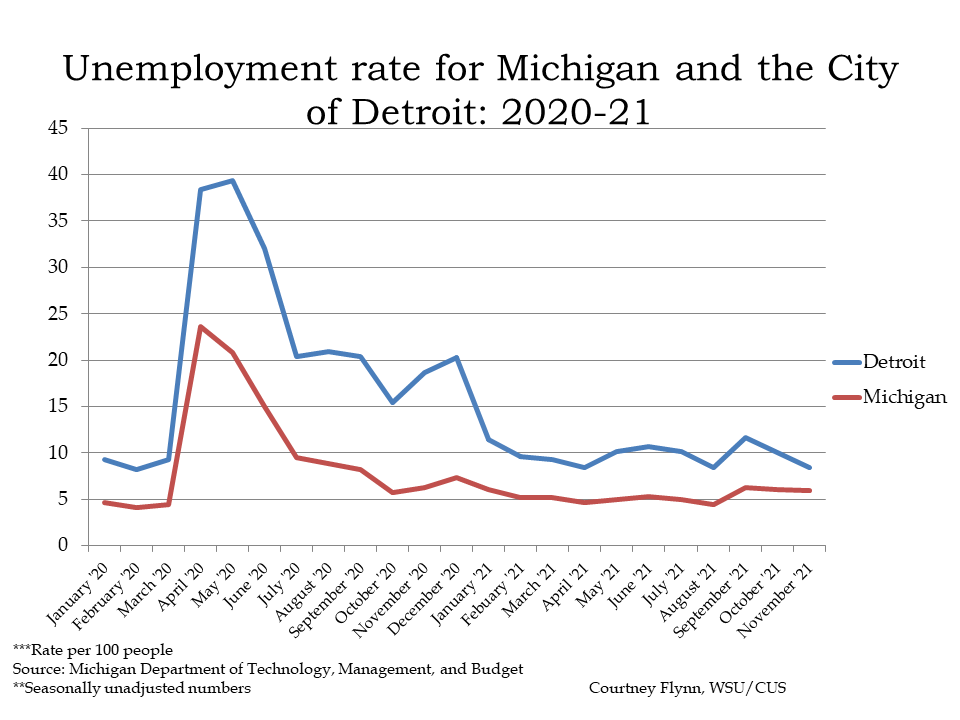
In November of 2021 the unemployment rate for the State of Michigan remained steady while the City of Detroit’s unemployment rate declined from the previous two months. The State of Michigan reported an unemployment rate of 5.9 in November, which was just slightly below the 6.2 percent unemployment rate reported in October. This is the first time the State’s unemployment rate has gone above 6.1 percent since January of 2021. In November of 2020 the unemployment rate was 6.3, which is on par with the November 2021 rate.
For the City of Detroit, the unemployment rate for November of 2021 was 8.4 percent, which is below the October rate of 10 and the September rate of 11.7. In November of 2020 the Detroit unemployment rate was 18.7, meaning there has been a significant decrease in the local unemployment rate in the last year.
While the data sets explored here show that unemployment rates are returning to pre-pandemic rates, the leisure, hospitality and tourism industries remain among the hardest hit, with many jobs not expected to return. But, hope remains, especially has new business formations increased by 56 percent in 2021, according to Michigan State University.
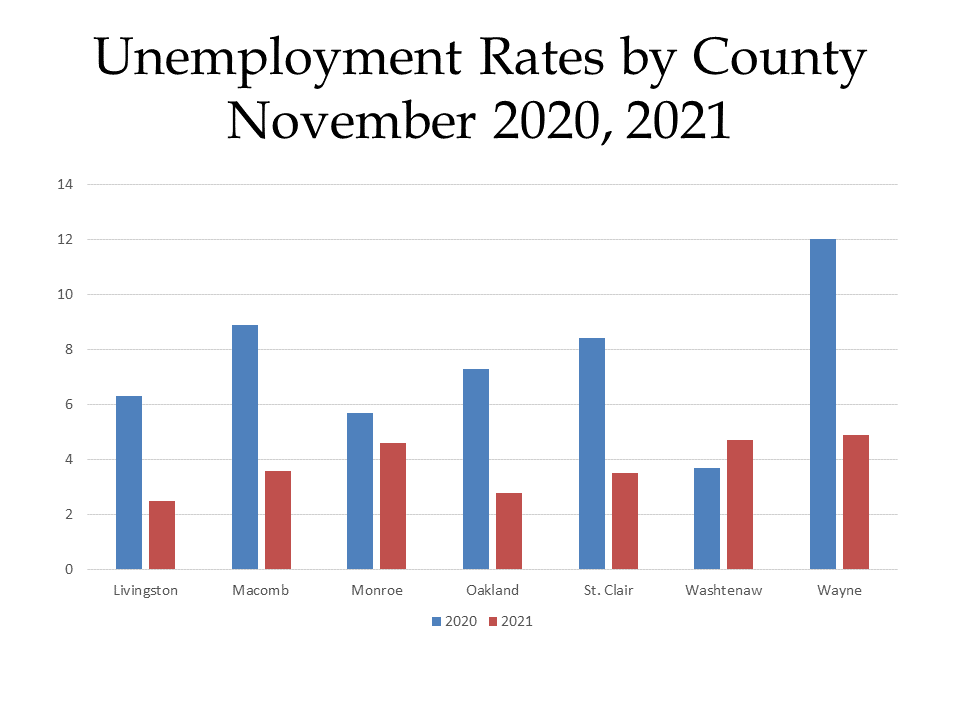
As should be expected, each county in Southeastern Michigan, with the exception of Washtenaw County, had a higher unemployment rate in November of 2020 as compared to November of 2021. Wayne County had the largest decrease between 2020 and 2021 at 7.1 points; the November 2021 unemployment rate was 4.9 percent. Wayne County also had the highest unemployment rate of the seven counties in November of 2021. Washtenaw County had the second highest unemployment rate during this time period at 4.7 percent, which was higher than the 2020 November unemployment rate of 3.7 percent. Livingston County had the lowest unemployment rate in November of 2021 at 2.5 percent; the unemployment rate was 6.3 percent in November of 2020.
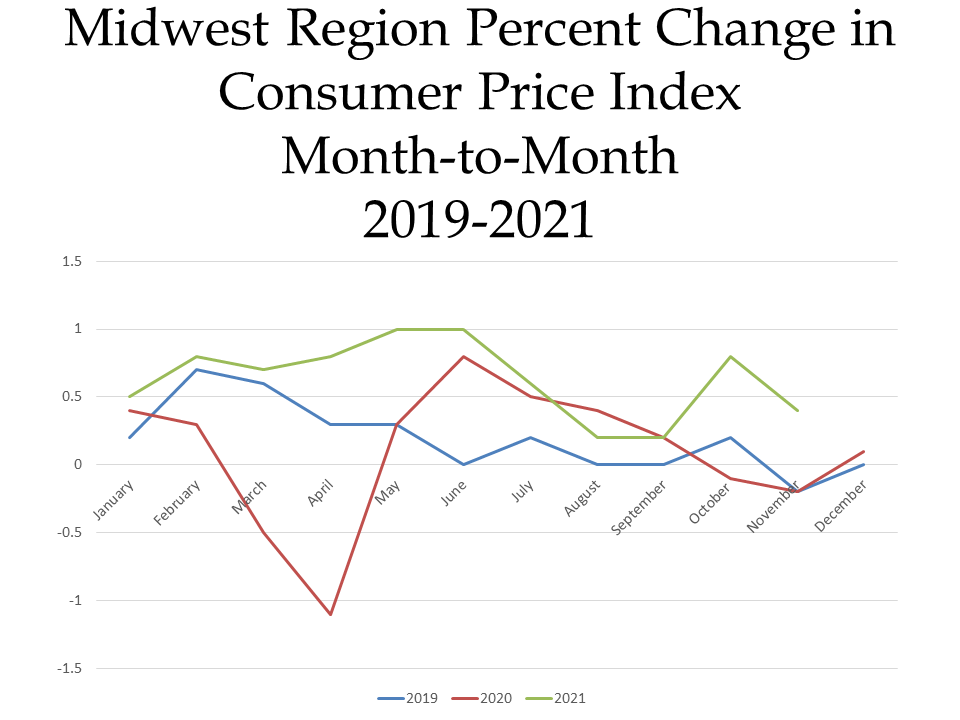
The first chart below highlights how the CPI changed on a month-to-month basis between 2019 and 2021. Currently in 2021, area prices are up 0.4 percent between October and November. According to the Bureau of Labor Statistics, contributing factors to the increase include a 2 percent increase for new and used motor vehicles and a 0.4 percent increase for shelter; the cost of apparel, education and communication decreased. Other factors included the increased cost of “food away from home” prices, which increased 1.2 percent, and energy prices which increased 0.8 percent.
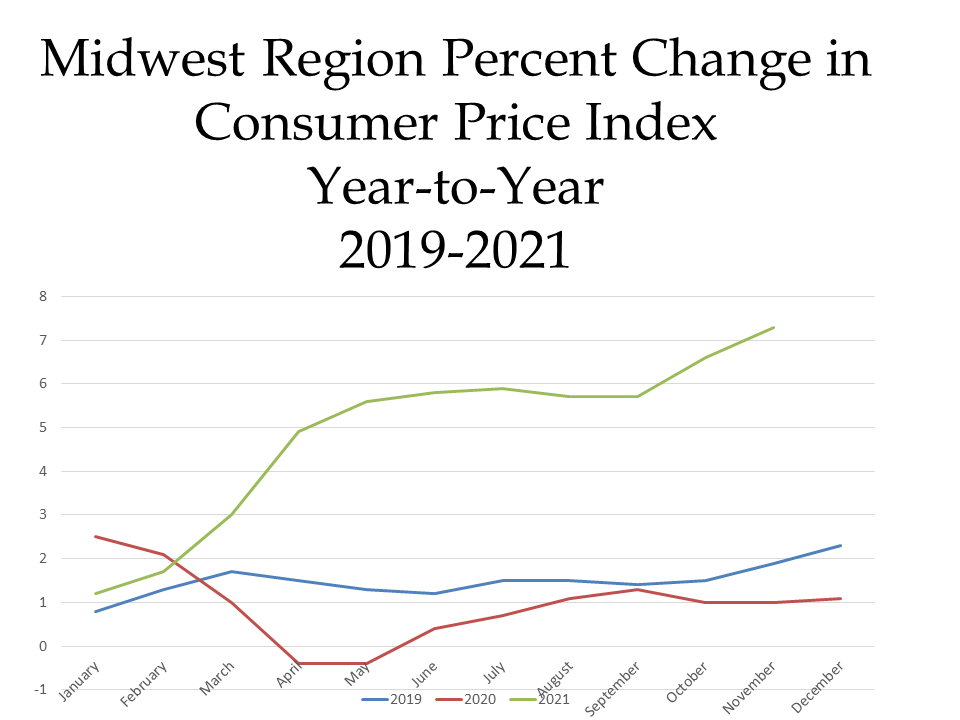
When examining the second chart, which shows how prices changed on a year-to-year basis, we see how prices continue to increase in 2021, with the November year-to-year CPI being the highest increase shown below. In November of 2021 the CPI was reported to be 7.9 percent above what it was the year prior. Contributing factors to the continued increase in the CPI include an increase in new and used motor vehicle prices by 17.2 percent, an increase in shelter by 4.5 percent, and an increase in household furnishings and operations by 7.6 percent. Additionally, energy prices increased by 36.7 percent between November of 2020 and November of 2021, largely due to higher prices for gasoline (62.9 percent). Prices paid for natural gas service increased 35.3 percent, and prices for electricity rose 3.6 percent during the last year. Food prices increased by 7.1 percent over the year, which also contributed to the increased CPI.
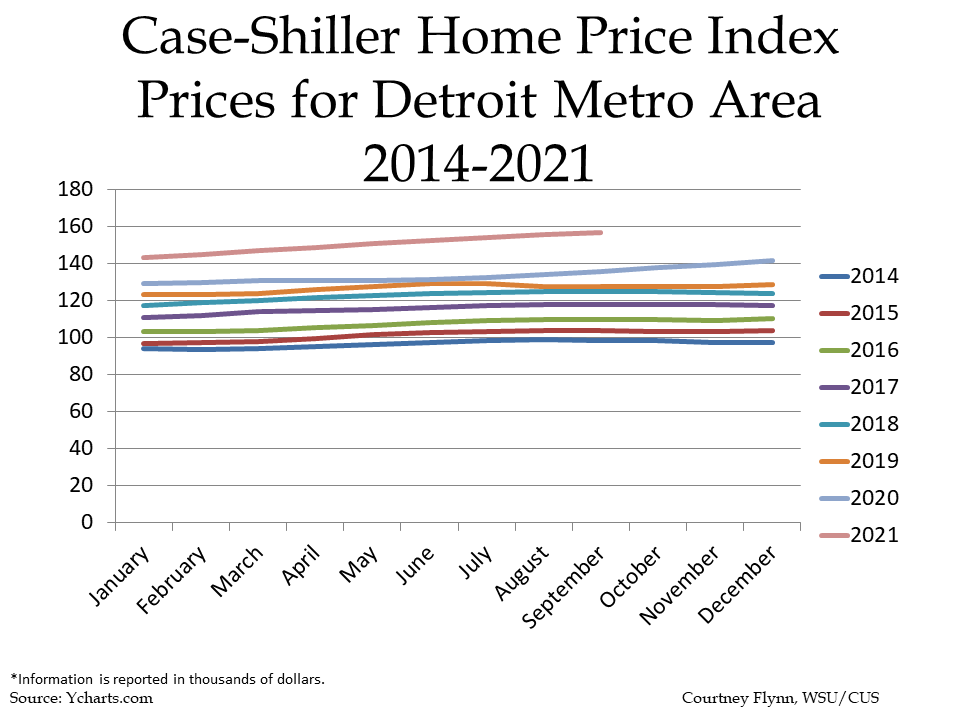
Home prices continue to increase, as has already been indicated by the increasing CPI. In Metro Detroit, according to the Case-Shiller Home Price Index, the average price of single-family dwellings sold was $156,550 in September of 2021; this was $1,110 higher than the average family dwelling price in August. The September 2021 price was an increase of $20,790 from September of 2020 and $58,210 from September of 2014. Home prices have continued to increase year-after-year but the recent average price of single-family dwellings sold in the Metro-Detroit area has shown signs of slowing down. For example, if you look at past economic indicators over the last year, the data shows that month-to-month and year-to-year increases were higher in previous months than for September.